Report - 28 jully, 2025Executive Summary
In a historic move to defuse transatlantic trade tensions, the United States and the European Union have struck a landmark agreement imposing a 15% blanket tariff on EU goods. The deal, brokered between President Trump and EC President Ursula von der Leyen, includes sweeping European commitments to increase purchases of American energy and military equipment—amounting to more than $1.35 trillion. This not only averts a trade war but realigns fiscal, defense, and industrial policy across the Atlantic. Meanwhile, Germany will escape EU sanction for deficit overruns due to elevated defense spending, and China has intensified its diplomatic push to lead AI governance, openly challenging U.S. technological hegemony.
These developments unfold amid a broader recalibration of global capital flows, with Chinese investors pouring record funds into Hong Kong equities, Brazil doubling down on BRICS despite tariff threats, and private equity investors increasingly opting for liquidity over continuation vehicles. All these signals point to a shifting world order, where economic fragmentation, tech rivalry, and military investment dominate the strategic calculus.
Market Reactions
Markets have reacted with cautious optimism. The resolution of the US-EU dispute has removed one of the most immediate risks to global trade, stabilizing risk sentiment. Equities across developed markets are firmer, while defense, energy, and industrial stocks in the U.S. have caught a fresh bid. European auto and export sectors remain under scrutiny given the tariff imposition, despite the broader stability.
The dollar softened slightly on expectations that the trade deal will reduce the likelihood of retaliatory disruptions, even as tensions over chip tariffs and Brazil’s alignment with BRICS persist. Gold briefly rallied but then settled as inflation expectations were tempered by diplomatic de-escalation. Oil prices remain subdued as demand signals remain weak despite energy reordering.
Fiscal and Political Implications
The US-EU agreement marks a major geopolitical win for Trump. The EU's commitment to spend $750 billion on U.S. energy and $600 billion on military procurement illustrates a fundamental pivot in the bloc’s external policy alignment. Politically, this underscores Washington’s ability to extract economic concessions under threat of tariffs—further validating Trump’s unilateralist negotiation style.
Germany’s exemption from EU deficit procedures further highlights Brussels’ strategic flexibility in an era where defense is taking precedence over fiscal austerity. Berlin will be allowed to run a deficit of 3.3% of GDP in 2025, thanks to a “national escape clause” invoked to cover expanded defense spending. This sets a precedent for other member states to follow suit, potentially unleashing a wave of fiscally supported rearmament across the EU.
Meanwhile, China's unveiling of a 13-point AI governance plan signals an emerging regulatory bifurcation in global technology. The push for a UN-backed AI governance body—and the positioning of its open-source models for Global South collaboration—challenges U.S. regulatory primacy and may spark a new front in the AI cold war.
Strategic Forecasts
The medium-term outlook is increasingly defined by strategic spending, tech sovereignty, and the weaponization of trade. The U.S. will likely continue to deploy tariffs not just for balance-of-trade concerns, but also to enforce strategic compliance. This tactic will carry mixed implications for global markets: inflationary near-term, but ultimately supportive of U.S. industrial and defense equities.
Europe’s gradual pivot toward U.S. alignment will create internal friction, especially among member states hesitant to cede strategic autonomy. At the same time, China’s AI diplomacy and Brazil’s defiance of U.S. tariffs will continue to fragment global consensus, creating an increasingly multipolar and protectionist macro environment.
Continued uncertainty around the Federal Reserve’s independence—as Trump ramps up pressure on Powell—will contribute to short-term volatility in bond and currency markets. The likelihood of delayed rate cuts or a politically forced pivot is increasing.
Risks and Opportunities
Risks include renewed tariff escalations, especially targeting tech, chips, and Brazil. Europe’s fiscal leniency could spook bond markets if perceived as unsustainable. In private equity, continuation vehicle fatigue risks forcing markdowns across illiquid portfolios.
Opportunities emerge in defense, energy, and AI-linked equities. The U.S. stands to benefit from a surge in industrial demand, while Chinese tech firms could capitalize on regulatory arbitrage in emerging markets. Open-source AI adoption will favor hardware and semiconductor exporters, particularly in Asia.
Asset Impact Analysis
Gold (XAUUSD):
Gold showed initial strength on trade fears but retraced as the deal lowered immediate inflation risk. With Powell’s position under political threat and long-term fiscal expansion in play, the bullish bias remains intact. Expect gold to test $3,400 in Q3 if Fed guidance shifts dovishly. Near-term support lies at $3,300.
S&P 500 (SPX):
Markets welcomed the trade clarity and defense spending surge. Industrials, defense, and energy are clear beneficiaries, while tech gains from relaxed macro pressure. Continued pressure on Powell could add volatility.
Dow Jones (DJIA):
Dividend-heavy Dow components in defense and manufacturing are poised to outperform. Trade normalization and fiscal leniency in Europe favor global cyclicals.
USDJPY:
With Japanese inflation slightly below forecast and the BoJ still cautious, yen strength is capped. U.S. political drama may induce mild USD weakness but not enough to break 145 convincingly.
DXY (US Dollar Index):
The dollar may weaken modestly as tariff resolution reduces safe-haven demand and the Fed comes under pressure to cut. A break below 103.00 would confirm a bearish turn.
Crude Oil (WTI):
Oil remains stuck in a neutral range. Although the EU will buy more U.S. energy, weak demand signals and lackluster PMI data keep prices rangebound. A breakout above $72 requires more forceful geopolitical tension.
XAUUSDK trade ideas

Gold Analysis and Trading Strategy | July 28
✅ Fundamental Analysis:
🔹 The United States and the European Union have reached a significant trade agreement, setting a unified tariff rate at 15% (previously threatened at 30%). The EU has also pledged to invest an additional $600 billion in the U.S. and to purchase $750 billion worth of American energy and military equipment.
🔹 This agreement has significantly eased trade tensions between the U.S. and EU, boosting market risk appetite and sending U.S. stock markets to new record highs. As a result, capital has shifted away from safe-haven assets like gold, causing gold prices to drop to the $3320 level during the Asian session.
✅ Technical Analysis:
🔸 4-Hour Chart:
Since retreating from the 3438.77 high, gold has formed a clear descending channel. While the current candlestick shows some signs of stabilization near the lower Bollinger Band, the rebound has been weak and has yet to touch the middle band, suggesting the downtrend remains intact.
Moving averages are in a bearish alignment, with the MA5 crossing below the MA10, and price continues to trade below both—indicating ongoing bearish control.
If the price fails to reclaim the MA10 level around 3347, the structure will likely remain bearish, with further downside potential targeting the 3316 and 3309 support levels.
On the upside, the 3365–3380 zone represents key resistance. For the bulls to gain meaningful control, the price must break and hold above this area.
🔸 1-Hour Chart:
The overall trend remains bearish within a weak consolidation phase, with price hovering near the lower Bollinger Band.
Despite several attempts to rebound, gold has repeatedly failed to break above the 3350 level, which now acts as a key resistance line.
The Bollinger Bands have begun to flatten slightly, and if the price cannot hold above the 3345–3350 area, the risk of a renewed drop remains. Focus on the 3320–3317 support zone in the near term.
Overall, recent rebounds appear to be corrective in nature, and the 1-hour bearish structure remains unchanged.
🔴 Resistance Levels: 3345–3350 / 3365–3370
🟢 Support Levels: 3330–3325 / 3316–3309
✅ Trading Strategy Reference:
🔻 Short Position Strategy:
🔰Consider entering short positions in batches if gold rebounds to the 3350-3355 area. Target: 3330-3310;If support breaks, the move may extend to 3280.
🔺 Long Position Strategy:
🔰Consider entering long positions in batches if gold pulls back to the 3333-3338 area. Target: 3345-3355;If resistance breaks, the move may extend to 3365.
🔥Trading Reminder: Trading strategies are time-sensitive, and market conditions can change rapidly. Please adjust your trading plan based on real-time market conditions. If you have any questions or need one-on-one guidance, feel free to contact me🤝

XAUUSD REBOUNDED FROM CURRENT TRENDLINE. WHAT'S NEXT?XAUUSD REBOUNDED FROM CURRENT TRENDLINE. WHAT'S NEXT?
Gold had successfully rebounded from the trendline, still showing mid-term bullish trend despite recent news on U.S. - E.U. and U.S. - Japan trade deals. Currently price is attempting to hold above the EMA20 on 1-h chart timeframe.
If this occurs and the asset develops another short-term bullish impulse, we may expect the price to reach 3,360.00 resistance level with further possible impulse towards 3,400.00 level.

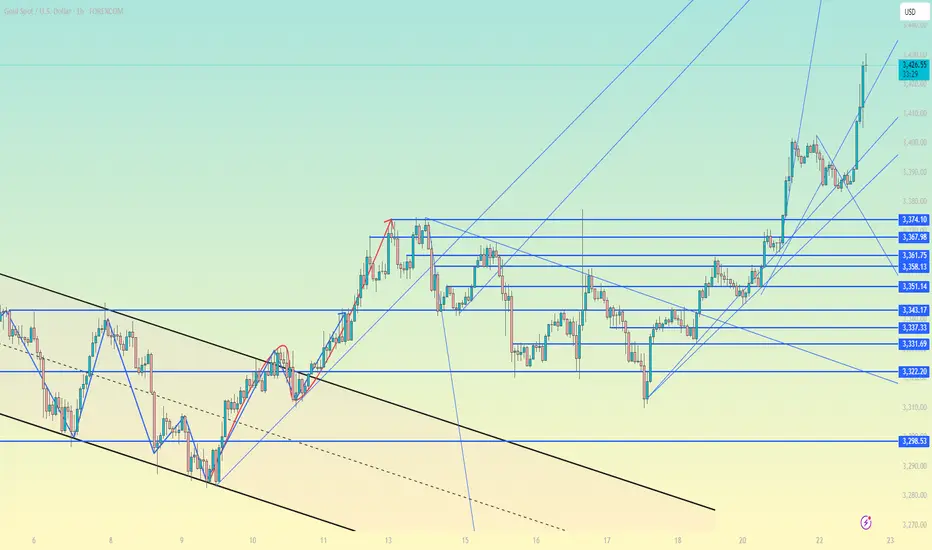
gold is in the range of 3440-3325gold is still in formation of penant in the higher time frame and currently has just given a sign of bullish after the 3 days bearish.
certain key levels to look out for.
3325, 3347, 3365, 3373,3393, 3402.
still sideways.

Gold – Range Break Incoming?Gold is still locked in a broad range, but recent price action suggests a possible breakdown. A break below the double bottom opens the door for a move toward the range midpoint.

"GOLD Bandit Strategy: Loot Pips Like a Pro!🏆 GOLD HEIST ALERT! 🏆 XAU/USD Bandit Strategy (Swing/Day Trade)
Steal Pips Like a Pro! 💰🔓 Bull vs. Bear Raid Plan
🌟 Greetings, Market Pirates! 🌟
"The trend is your accomplice—time to loot!"
🔮 Thief’s Technical & Fundamental Intel:
XAU/USD (The Gold Vault) is flashing BEARISH signals, but we’re ready to raid both sides! Follow the heist blueprint below 👇
🎯 ENRY POINTS (Where to Strike!)
🏴☠️ LONG RAID (Bullish Thieves):
Break & Grab: Enter above 3450.00 (Pullback Zone)
"Wait for the breakout, then ambush!"
🐻 SHORT RAID (Bearish Bandits):
Sneak Attack 1: Sell below 3300.00
Sneak Attack 2: Sell below 3260.00 (Support Wall Cracked!)
🛑 STOP-LOSS (Escape Routes)
Bullish Trade: SL at 3230.00 (Guard your loot!)
Bearish Trade 1: SL at 3360.00 (Don’t get caught!)
Bearish Trade 2: SL at 3280.00 (Risk = Reward!)
(Adjust SL based on your risk appetite & lot size!)
💰 TAKE-PROFIT (Cash Out & Flee!)
Bullish Thieves: TP at 3270.00 (Or escape early!)
Bearish Bandits (1): TP at 3270.00
Bearish Bandits (2): TP at 3210.00 (Big score!)
⚠️ WARNING: Market Traps Ahead!
News = Danger Zone! 📢 Avoid new trades during high-impact news.
Trailing SL = Your Getaway Car! Lock profits & evade reversals.
📰 FUNDAMENTAL BACKUP (Why This Heist Works)
Bearish momentum fueled by macro trends, COT data, & sentiment.
Stay sharp—markets shift fast!
💥 BOOST THIS HEIST! 💥
Like & Share to strengthen our pirate crew! 🚀 More alerts = More profits!
🚨 Next Heist Coming Soon… Stay Tuned! 🚨

XAUUSDLongterm gold os going to 5K
Midterm 3,500
Shorterm, we going to the bottom of the consolidation.

XAU/USD Buy Setup – Trendline + Support ConfluenceReasons for Possible Buy:
Price is sitting on a rising trendline acting as dynamic support.
Strong horizontal support zone previously acted as demand.
Signs of a potential bullish reaction or bounce after extended downside.
Trade Plan:
Looking for bullish confirmation (candle structure or momentum shift) around this level.
If confirmed, potential targets:
First target: $3,365–$3,380
Second target: $3,431
🔹 Invalidation: Clean break below $3,320 zone or trendline support would invalidate the setup.
This is a high-reward area if buyers step in again like they did previously. Patience for confirmation is key before executing.

XAU/USD 25 July 2025 Intraday AnalysisH4 Analysis:
-> Swing: Bullish.
-> Internal: Bullish.
You will note that price has targeted weak internal high on three separate occasions which has now formed a triple top, this is a bearish reversal pattern and proving this zone is a strong supply level. This is in-line with HTF bearish pullback phase.
Remainder of analysis and bias remains the same as analysis dated 23 April 2025.
Price has now printed a bearish CHoCH according to my analysis yesterday.
Price is now trading within an established internal range.
Intraday Expectation:
Price to trade down to either discount of internal 50% EQ, or H4 demand zone before targeting weak internal high priced at 3,500.200.
Note:
The Federal Reserve’s sustained dovish stance, coupled with ongoing geopolitical uncertainties, is likely to prolong heightened volatility in the gold market. Given this elevated risk environment, traders should exercise caution and recalibrate risk management strategies to navigate potential price fluctuations effectively.
Additionally, gold pricing remains sensitive to broader macroeconomic developments, including policy decisions under President Trump. Shifts in geopolitical strategy and economic directives could further amplify uncertainty, contributing to market repricing dynamics.
H4 Chart:
M15 Analysis:
-> Swing: Bullish.
-> Internal: Bullish.
H4 Timeframe - Price has failed to target weak internal high, therefore, it would not be unrealistic if price printed a bearish iBOS.
The remainder of my analysis shall remain the same as analysis dated 13 June 2025, apart from target price.
As per my analysis dated 22 May 2025 whereby I mentioned price can be seen to be reacting at discount of 50% EQ on H4 timeframe, therefore, it is a viable alternative that price could potentially print a bullish iBOS on M15 timeframe despite internal structure being bearish.
Price has printed a bullish iBOS followed by a bearish CHoCH, which indicates, but does not confirm, bearish pullback phase initiation. I will however continue to monitor, with respect to depth of pullback.
Intraday Expectation:
Price to continue bearish, react at either M15 supply zone, or discount of 50% internal EQ before targeting weak internal high priced at 3,451.375.
Note:
Gold remains highly volatile amid the Federal Reserve's continued dovish stance, persistent and escalating geopolitical uncertainties. Traders should implement robust risk management strategies and remain vigilant, as price swings may become more pronounced in this elevated volatility environment.
Additionally, President Trump’s recent tariff announcements are expected to further amplify market turbulence, potentially triggering sharp price fluctuations and whipsaws.
M15 Chart:

Xausd techinical analysis.Xausd techinical analysis next move posibale at h2 time frame.not finchinal advice.

XAUUSD
XAUUSD Updated in H1 :
The gold signal is marked on the chart based on the latest price changes and the supply and demand in the market. These points include the entry point, stop loss, and take profit

GOLD 4H Bullish Setup
Price is respecting the ascending trendline and demand zone. Expecting a bullish continuation from the 3,360–3,350 support area toward the 3,450 and 3,500 levels. Watching for rejection and confirmation within the demand zone before entry
🔹 Trendline Support
🔹 Demand Zone Bounce
🔹 Target Zones: 3,450 / 3,500
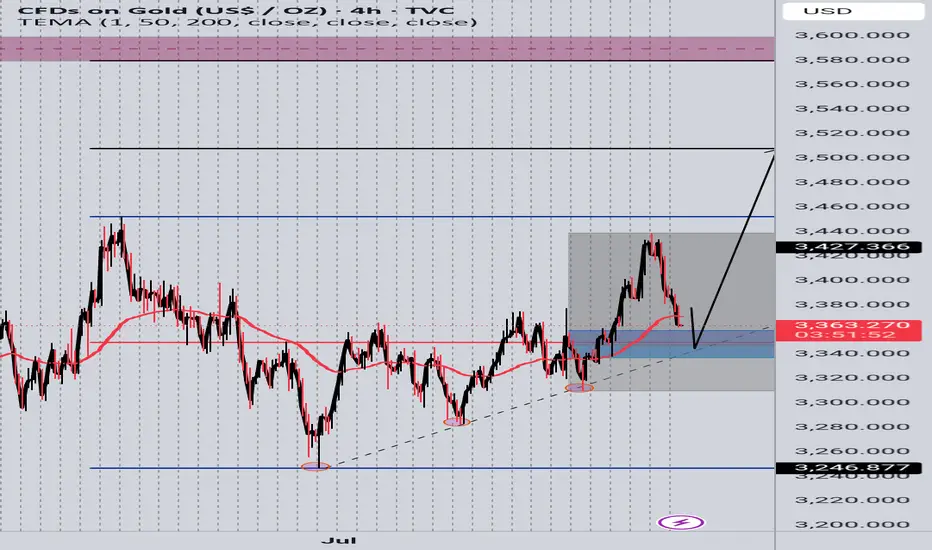
lONG FOR XAUUSDHello my friends
Get ready for the last bullish wave of gold.
You can hope for the roadmap I drew and have a buy guard with your own setup in the bullish direction.
Be profitable and successful

XAU/USD – Ranging Market Prepping for Breakout?Gold has been ranging for the next couple months and usually I am out of the market during the months of April Through July because historically these are not my best months trading XAU/USD. However you will see me posting a lot more in the coming months because my best months historically are August - December where the market really cranks up with some bigger moves.
So in a summarized version below you will find what it is that i am looking at with gold.
Gold (XAU/USD) has remained locked in a defined consolidation range between 3,250 (support) and 3,450–3,502 (resistance) since early April. Price has printed multiple internal falling wedge formations within this zone, indicating compression before potential expansion.
🔍 Technical Overview
Range Duration: ~3.5 months
Key Range:
Support: 3,250
Resistance: 3,450–3,502
Compression Patterns: Multiple falling wedges breaking upwards inside the range, hinting at bullish pressure.
Touch Confirmations: Both range boundaries have been tested multiple times, reinforcing validity (per Multi-Touch Confirmation).
Contextual Bias: Seasonally, August–December tends to be a high-volatility trending period for Gold.
🎯 Trade Plan
Inside Range:
Maintain neutral bias.
Execute range-to-range scalps/swing setups with clear invalidation zones.
Avoid trading mid-range.
Breakout Scenario (Bullish):
A clean close above 3,502 triggers breakout watch.
Ideal setup: Retest + 15-min flag → long continuation.
Potential upside target: ~3,700 (range height extension).
Breakdown Scenario (Bearish):
Loss of 3,250 opens door to bearish continuation.
Look for clean liquidity sweep or structure flip before committing.
Initial downside target: 3,100 zone.
🛡️ Risk Notes
Avoid third-touch entries in aggressive momentum unless followed by flag formation.
Remain disciplined with the 80/20 confluence rule — don't let perfectionism delay entries.
Always execute with pre-trade checklist and defined R:R profile.
✅ Summary
Gold is at a pivotal point. The confluence of a tight multi-month range, internal compression patterns, historical breakout timing, and validated levels builds a compelling case for an imminent expansion move. Remain patient, avoid anticipation, and react to confirmed structure and price behavior.

Gold trend analysis for July 23, 2025 : BuyToday's gold price trend is a contraction to continue rising, according to Bullish Pennant
We recommend buying Gold Spot at 3319 , 3400
Take Profit = 3440 / 3448 /3465

Gold is strong. Can it continue?On Tuesday, the overall gold price showed an upward trend. The highest price rose to 3433.32 on the day, and the lowest price fell to 3383.21, closing at 3431.46. On Tuesday, gold prices fluctuated during the early trading session and then corrected downward. During the European session, the price fluctuated mainly and fell weakly. It rose before the US session and hit the high point of the week again in the US session, and finally ended with a big positive line.
From the four-hour level, the technical adjustment needs, but the speculation of risk aversion suppressed this demand. There is a contradiction between the fundamentals and the technical aspects, and it is necessary to wait for the market sentiment to stabilize before clarifying the direction.
In the early Asian session, it hit a high of 3438 and then fell back. It is necessary to pay attention to the possibility of reaching the top. The support position is 3400-3405. If it falls to 3400, it may continue to adjust to around 3385. The probability of closing the negative line today is relatively high. If the price stabilizes above 3400, it is likely to maintain high fluctuations.
Today's market is complicated. Although the bullish trend has not changed, it is not advisable to be overly bullish. The operation is mainly shorting on rebounds, supplemented by long positions on pullbacks. The upper pressure position focuses on 3440-3450.
Operation strategy:
Short near 3440-3450, stop loss 3460, profit range 3420-3410.
Long near 3390, stop loss 3380, profit range 3420-3430.

Gold technical analysis and operation strategyGold technical analysis and operation strategy
Market review and current trend
Gold fell from $3402 as expected in the morning trading today. After the price rose in resonance in the evening, it chased more again at 3397.8. The current gold price has broken through the short-term acceleration line. The key resistance above is at $3420 (the pressure of the convergent triangle trend line). If it is touched for the first time, you can try shorting. The support below focuses on 3400-3405. After stabilization, it is still bullish. Breaking through 3420 is expected to challenge the previous high of 3452.
Key driving factors of fundamentals
Fed policy expectations: The market focuses on the speech of Fed Chairman Powell at 20:30 tonight. If he releases dovish signals (such as hinting at a rate cut), it may boost gold; if he maintains a hawkish stance, gold prices may be under pressure by 37.
Geopolitical and trade risks:
The escalation of the conflict between Russia and Ukraine has boosted safe-haven demand, and gold open interest has surged by 23%5.
As trade frictions between Europe and the United States intensify, the EU may impose retaliatory tariffs of $72 billion on the United States, exacerbating market volatility6.
US dollar and US Treasury yields: The US dollar index fell below 98, and the 10-year US Treasury yield fell back below 2%, reducing the cost of holding gold and supporting the gold price of 610.
Key points of technical analysis
Support level:
3400-3405 (short-term long-short watershed)
3385 (today's low, key defensive position)
3360-3350 (daily moving average support) 18
Resistance level:
3420 (convergent triangle upper track, short short for the first time)
3452 (previous high pressure, may accelerate upward after breaking through) 10
Operation strategy
Short-term short order: first touch 3430 light position short, stop loss 3438, target 3415-3410.
Pullback long: 3410-3405 stabilizes and then long, stop loss 3395, target 3430, break to see 3430-3452.
Breakout strategy: If it stands firm at 3420, you can follow up with long orders, with the target being 810 above 3450.
Risk warning
Powell's speech may cause violent fluctuations. It is recommended to control positions and avoid heavy positions in the data market.
If it falls below 3385, the short-term bullish structure may be destroyed, and we need to be vigilant about further corrections to 3360-3350.
Gold Bulls Back in Control as Trump Pressures Fed for Rate CutsHey Realistic Traders!
President Trump is ramping up pressure on the Fed to cut interest rates , saying the U.S. is falling behind countries with looser policies. As several Fed officials begin to shift their stance, expectations for rate cuts are growing. That’s putting pressure on the dollar and giving gold a fresh boost.
We’ll take a closer look at what this means for OANDA:XAUUSD (Gold) through technical analysis and explore its upside potential.
Technical Analysis
On the 4-hour chart, Gold has moved above the EMA-200, signaling a shift in momentum to the upside. Price has also broken out of a Descending Broadening Wedge (DBW) pattern, which often indicates the start of a bullish trend.
The breakout was confirmed by a Bullish Marubozu candle, reflecting strong buying pressure. To add further confirmation, the MACD has formed a bullish crossover, reinforcing the upward momentum.
Looking ahead, the first target is seen at 3417. If reached, a minor pullback toward the historical resistance zone (green area) may occur, with a potential continuation toward the second target at 3500.
This bullish outlook remains valid as long as the price stays above the stop-loss level at 3271 . A break below this level would invalidate the setup and shift the outlook back to neutral.
Support the channel by engaging with the content, using the rocket button, and sharing your opinions in the comments below.
Disclaimer: "Please note that this analysis is solely for educational purposes and should not be considered a recommendation to take a long or short position on XAUUSD.

GOLD - Cut n Reverse Area? What's next??#GOLD... Perfect holdings upside as we discussed in our video and last idea.
Now 3390-91 is major key level because only above that you can see again bounce otherwise not.
NOTE: we will cut n reverse above 3390-91 on confirmation.
Good luck
Trade wisely
Gold (XAU/USD) Elliott Wave Analysis — 4H Chart🟡 Gold (XAU/USD) Elliott Wave Analysis — 4H Chart
As of July 22, 2025
Summary:
The chart shows a completed impulsive 5-wave rally, followed by a complex W-X-Y corrective structure, and a potential larger-degree downward move in progress.
Wave Structure Breakdown:
✅ Completed Impulse (Green Labels):
Wave I → II → III → IV → V structure is clearly defined, marking a major bullish phase.
Wave V completed around the peak (~$3,480 zone), suggesting a medium-term top.
🔁 Complex Correction (W-X-Y in Green and ABC in Red):
After Wave V, a zigzag correction (A-B-C) unfolded (marked in red).
Then a W-X-Y double correction emerged, possibly forming a larger corrective flat/complex pattern.
🔻 Projected Bearish Leg (ABCDE Triangle or Descending Channel - in Pink):
A new ABCDE structure seems to be initiating (marked in pink).
Wave (A) has likely started and is expected to extend towards the $3,180–$3,200 area.
After minor bounces (B and D), final Wave (E) targets the major horizontal support around $2,950–$2,980.
📉 Support Zone to Watch:
$2,950–$2,980 zone (green horizontal line) is the critical level from April lows.
A break below this could lead to accelerated downside movement.
🧠 Strategic View:
Short-Term: Bearish bias towards $3,180–$3,200, with corrective bounces.
Medium-Term: Watch the $2,950 level — likely to act as a decision point.
Long-Term: If $2,950 holds, bullish continuation possible; else deeper retracement to $2,700 or lower.
⚠️ Risk Points:
If price invalidates the (Y) wave high, this bearish structure is likely invalid.
Consider dynamic trailing stops if trading based on this projection.
✅ Conclusion:
Gold has likely completed a major 5-wave uptrend and is currently undergoing a large corrective structure. The chart suggests a high-probability scenario of further decline towards the $2,950–$3,000 region. Tactical traders may explore short setups while maintaining awareness of reversal zones and invalidation levels.
📌 Disclaimer:
This analysis is for educational and informational purposes only and should not be considered financial advice. Trading in financial markets involves significant risk, including the risk of losing your entire investment. Always do your own research or consult with a qualified financial advisor before making any trading or investment decisions. The author is not liable for any financial losses incurred based on the information provided.

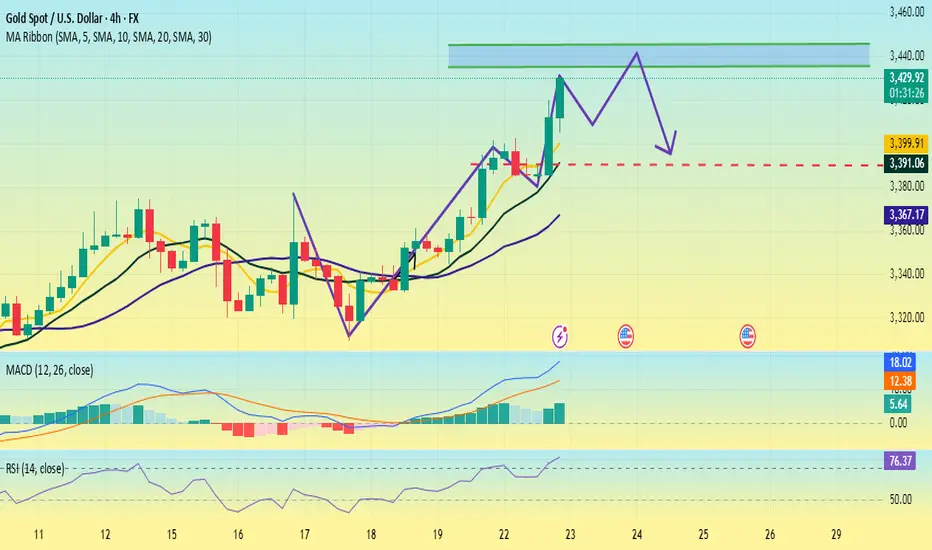
Gold is under pressure. Can it break through?Since the "W bottom" pattern was formed at the low of 3344 US dollars, the gold price broke through the neckline of 3380 and further stabilized at 3400 today, confirming the continuation of the medium-term upward trend. The moving average system is arranged in a bullish pattern, with the 5-day, 10-day and 20-day moving averages diverging upward in turn, and the support strength is stable.
The MACD indicator golden cross continues to expand, the upward momentum is enhanced, and no divergence occurs; the RSI indicator rises to around 76. Although it enters the overbought range, there is no obvious turn, indicating that the bullish momentum is still being released.
The current support level has risen to around 3390, and the support level has risen sharply. The resistance position needs to pay attention to 3430-3440. At present, several times have tested above 3430, but they have not stabilized above this position.
Operation suggestions:
3390-3400 light position to try more, stop loss 3360, profit range 3435-3445.
If it encounters resistance and falls back near 3435, you can consider short-term short orders with stop loss at 3445 and profit range at 3400-3380.
Although the upward momentum continues, some risk information still needs to be paid attention to; this week, we need to pay attention to the US June existing home sales data (July 23), the preliminary value of the second quarter GDP (July 25) and the core PCE price index (July 26). If the data is stronger than expected, it may trigger expectations of interest rate cuts.
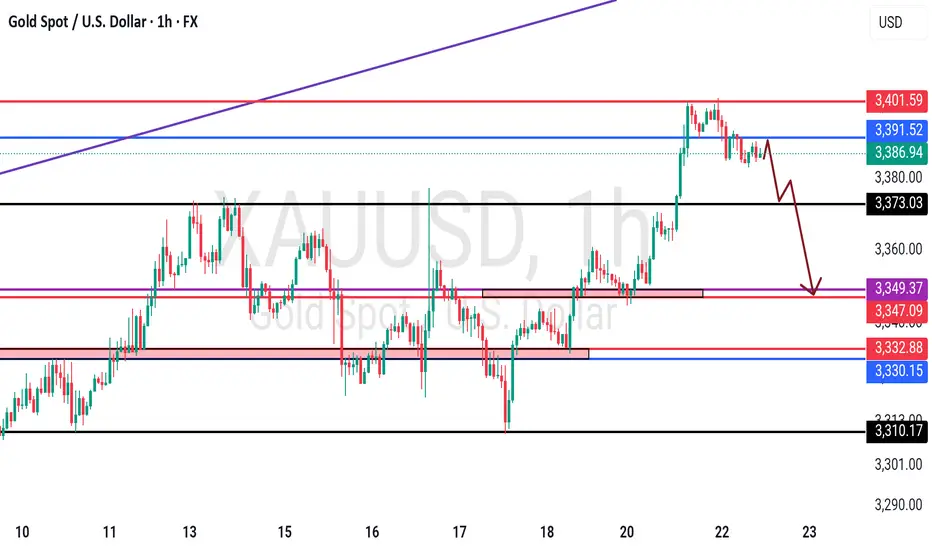
Gold Ends Rally, Focus Shifts to Fed MeetingGold slipped, snapping a three-day rally. The retreat came after the U.S. struck trade agreements with Japan, the Philippines, and Indonesia, easing safe-haven demand. The latest deal with Japan includes 15% tariffs and expanded U.S. access. Still, unresolved tensions with the EU and anticipation ahead of next week’s Fed meeting are keeping investors on edge.
Resistance is at $3,400, while support holds at $3,375.

Gold (XAUUSD) – 22 July Outlook | Reversal Zones in FocusGold (XAUUSD) – 22 July Outlook | Three Key Reversal Zones to Watch
Yesterday, Gold gave a strong breakout above the key resistance level at 3377 , shifting the M15 structure bullish and confirming upside strength.
Today, the market is likely entering a retracement phase on both the H4 and M15 timeframes — a healthy pullback after a breakout, which may lead to the next leg of the uptrend.
So where should we focus for long opportunities?
We are observing three key zones as potential bases for the continuation move:
📍 Zone 1 – 3377.6–3373.5 (Breaker Block):
This is the immediate structure zone — previous resistance which may now flip into support.
→ If price respects this area, we can anticipate a classic S&R Flip setup.
📍 Zone 2 – 3367.5–3363 (Demand Block):
If the first level doesn’t hold, this zone becomes critical. It lies just under the breakout base and could act as the next level of defense by bulls.
📍 Zone 3 – 3358.5–3350.5 (H4 Order Block):
This is the most significant support zone for the day. It aligns with a higher-timeframe order block, making it a high-probability POI for a deeper pullback and reversal.
But remember, we do not predict blindly .
Plan of Action:
– Observe price behavior at each zone
– Wait for confirmation via M1 internal structure shifts + BoS
– Trade only when all conditions align
– SL: 40 pips | TP: 120 pips
Risk-Reward: Always 1:3
Summary:
✅ Structure is now bullish on M15 and H4
✅ We’re in a pullback phase — ideal for continuation trades
✅ Three clear POIs mapped — now we wait for the market to speak
Patience. Precision. Discipline.
Let the trade come to you — not the other way around.
📘 Shared by @ChartIsMirror
