XAU Trade IdeaGold still bullish after yesterday's gingantic move?
Retracement to OTE + OB while sweeping Asian Low targeting yesterday's high and beyond!
XAUUSDK trade ideas

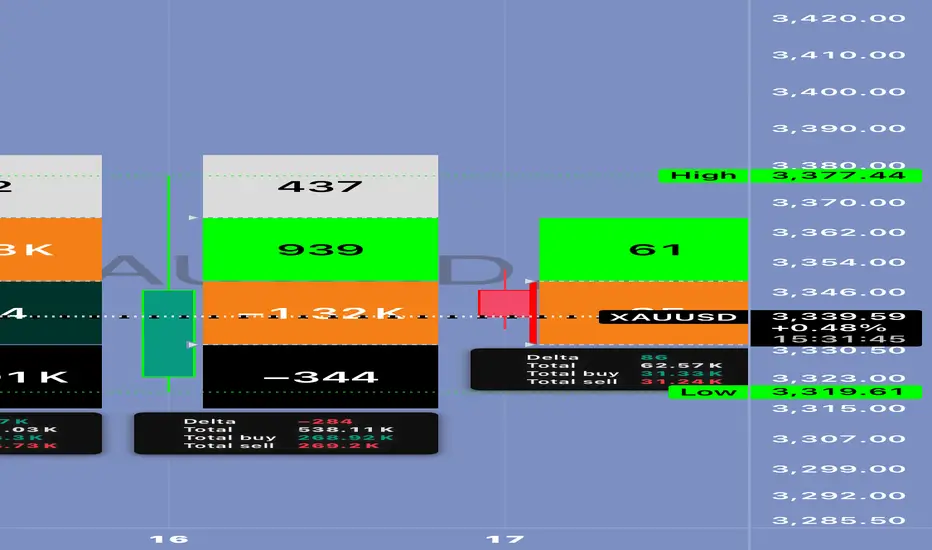
Is Gold Preparing for a Breakout — or a Trap? 🟡 Is Gold Preparing for a Breakout — or a Trap? Let’s break down the latest market data 👇
⸻
🟥 1. U.S. Inflation News (PPI & Core PPI)
Report Previous Forecast Actual
Monthly PPI 0.1% 0.2% 0.0%
Core PPI 0.1% 0.2% 0.0%
📉 Result: Very bearish for the U.S. dollar
→ Inflation is cooling
→ Fed may pause rate hikes
→ Interest rates could stabilize or drop
→ And gold loves that kind of setup 😍
⸻
🟫 2. U.S. Crude Oil Inventory Report
Report Previous Forecast Actual
Crude Oil Inventories +7.07M –1.80M –3.85M
🟢 Result: Very bullish for oil
→ Energy demand is higher than expected
→ Inflation could creep back up due to rising oil prices
→ That makes investors run to gold as a hedge against inflation 🔥
⸻
🧠 Technical & Market Outlook for XAU/USD:
📈 Gold pushed from $3,319 to $3,377
↩️ Now it’s in a pullback, testing Fibonacci levels:
• 38% retracement near $3,350
• 61% retracement near $3,339
📉 But… these pullbacks are happening with positive delta and absorption → which signals smart buying from below 👀
✅ Additional signs:
• VWAP is stable
• Volume is holding around the POC
• And macro data is clearly supporting upside momentum
⸻
🎯 Trading Plan:
• ✅ Entry Zones: $3,350 or $3,339
• 🛑 Stop Loss: Below $3,319 (recent low)
• 🎯 TP1: $3,377
• 🎯 TP2: $3,392 – $3,400
• ⚠️ Watch for a breakout above $3,377 with strong volume — that would confirm the real move.
⸻
🔄 Summary:
💥 Two major news events today are supporting gold:
1. Weak PPI = possible pause in rate hikes
2. Rising oil = renewed inflation risk
So gold is getting support from both angles.
But stay cautious — any surprise statement from the Fed or a sudden USD rally could change the game
Gold-Bullish Leg to ContinueGold is Bullish. a minor pullback may happen before it continues its leg up. Looking at uncertainty at global level, Gold might push to 3400.
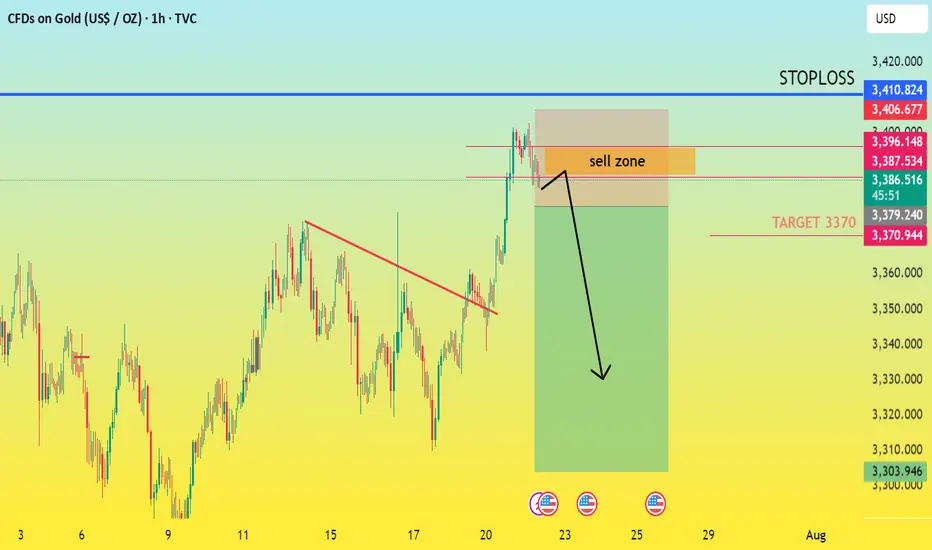
XAUUSD: THE GOLDEN OPPORTUNITY FOR BEARS!FUNDAMENTAL ANALYSIS
Are you ready to capitalize on the impending short-term correction in Gold? XAUUSD is flashing clear sell signals from the 3390 to 3370 zone, setting the stage for a profitable bearish move. Don't miss this chance to ride the downward momentum!
Here's why we anticipate Gold's descent to 3370:
The Ceiling is Here: Key Resistance at 3390-3400
Gold has been grappling with strong resistance in the 3390-3400 area. This level represents a critical juncture where bullish momentum is consistently capped. Multiple attempts to breach this ceiling have been met with selling pressure, indicating a clear supply zone. As long as XAUUSD remains beneath this formidable barrier, the path of least resistance is to the downside
Technical Exhaustion: After a notable rally, Gold is showing signs of being overextended. The recent consolidation around current levels suggests buyer exhaustion and a lack of conviction to push higher. This often precedes a short-term correction to digest recent gains.
Dollar Strength Brewing: While the US Dollar has seen some recent weakness, there are underlying signals that a rebound could be on the horizon. A strengthening Greenback typically exerts downward pressure on dollar-denominated assets like Gold, making it more expensive for international buyers and reducing demand. Keep an eye on the DXY for confirmation.
Targeting the Support Zone: The Path to 3370
Our immediate target for this bearish impulse is the key support zone around 3370. This level is not arbitrary; it aligns with:
Previous Price Action: This level has historically acted as both a support and resistance pivot, making it a significant area of interest for market participants.
Fibonacci Retracement Levels: Depending on the swing high from which we're retracing, 3370 often aligns with a significant Fibonacci retracement level, indicating a probable area for a bounce or temporary halt in the downtrend.
Dynamic Support (e.g., Short-term EMAs): Falling prices are likely to find their first significant bounce around the 50-period Exponential Moving Average (EMA) on shorter timeframes, which often converges around this 3370 level.
Trade with conviction and precision! The bearish short trend in XAUUSD from 3390 offers a compelling opportunity for sellers to target the 3370 support. Prepare to act decisively as the market unfolds.
ENTRY POINT 3390
TARGET 3370
STOPLOSS 3400
XAUUSD on swing Gold is currently holding rising channel along with the Range of 3340-3375
What's possible scanarios we have?
▪️I'm looking for Buying trade 1st we have 3342-3345 support area for potential buying spot.
Other then we have pending liquidity below 3340-3335 which I'm expecting the perfect buyying opportunity keep buy set targets at 3370 then 3400.
•Also we have buyying option If h4 closed above 3380 I will buy and target will be 3400.
▪️ keep in mind below 3330 we have sellers gap and our targets will 3305 then 3290
#XAUUSD

GOLD/XAUUSD maintaining Bullish TrendOANDA:XAUUSD / TVC:GOLD Long Trade, with my back testing of this strategy, it hits multiple possible take profits, manage your position accordingly.
Gold is keeping bullish volume and wants to hit key resistance of July, then to consolidate there and then will see what price does further.
Note: Manage your risk yourself, its risky trade, see how much your can risk yourself on this trade.
Use proper risk management
Looks like good trade.
Lets monitor.
Use proper risk management.
Disclaimer: only idea, not advice

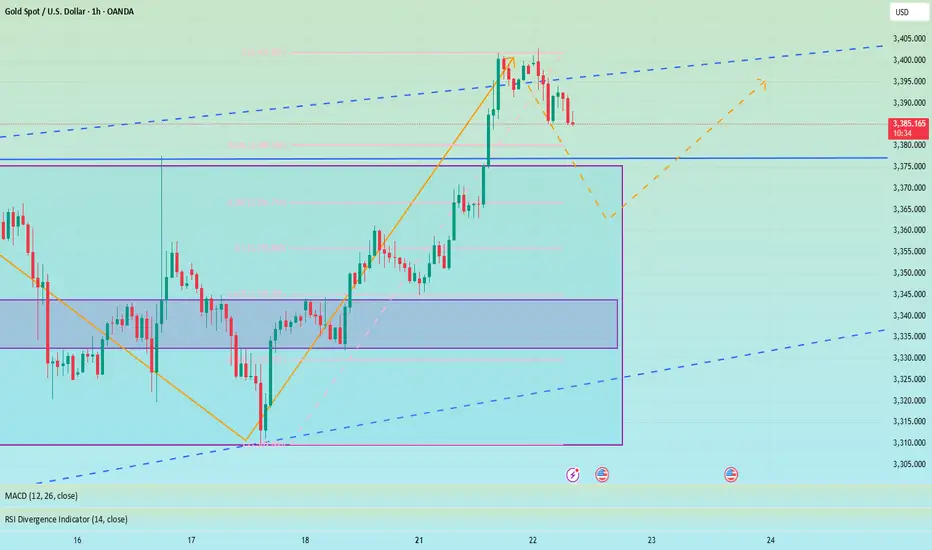
Bulls are still the main theme, 3400 is not the high point📰 News information:
1. Fed Chairman Powell delivers a welcome speech at a regulatory conference
2. The tariff deadline is approaching
📈 Technical Analysis:
Today's opening high reached around 3402, and did not effectively break through the upper resistance of 3405-3415. As I said yesterday, a decline and return to the moving average is an inevitable result. The tariff issue is still there, with the deadline on August 1, and the daily MACD indicator still shows a golden cross. The general direction of short-term bullishness has not changed, but from a technical point of view, gold still has room to fall to correct the overbought part.
Below the day, we first focus on the top and bottom conversion position of 3377-3375. As time goes by, the 4H middle track will probably resonate with the 50% position of the Fibonacci line at 3355, which is also a good long position I expect. Therefore, if the price falls back to 3380-3375 for the first time during the day, you can consider going long. If the price continues to fall, pay attention to the second opportunity to go long at 3355, with the target at 3390-3410.
🎯 Trading Points:
BUY 3380-3375
TP 3390-3410
BUY 3360-3350
TP 3370-3380
In addition to investment, life also includes poetry, distant places, and Allen. Facing the market is actually facing yourself, correcting your shortcomings, facing your mistakes, and exercising strict self-discipline. I share free trading strategies and analysis ideas every day for reference by brothers. I hope my analysis can help you.
TVC:GOLD PEPPERSTONE:XAUUSD FOREXCOM:XAUUSD FX:XAUUSD OANDA:XAUUSD FXOPEN:XAUUSD
Gold trend analysis: bullish but not chasing the rise.Gold, last Thursday's daily line closed with a long lower shadow, bottomed out and stabilized, and once again stabilized at the lower track support point of the large convergence triangle. Combined with the cyclical movement after the two stabilizations at 3247 and 3282, it was three consecutive positive rises; therefore, last Friday, and at least these two days on Monday this week, there will be consecutive positive rises; today gold rose as expected, the Asian and European sessions continued to be strong, and there was a second rise in the U.S. session. Since the U.S. session went directly higher before and after, the current support below has moved up to the 3377-75 area, where a top and bottom conversion position will be formed. Therefore, if it falls back to 3375-77 in the evening, you can continue to go long and look to above 3400. If it falls below 3370, it will fluctuate. The upper short-term resistance level is 3387-3393, the previous high. If the market touches here for the first time, you can try to see a double top decline.

Weekly Analysis on GOLDFor next week trading session i will wait for buy set up since market structure is still in a bullish trend. There might be a selling opportunity but still i will wait for a great buy set up.

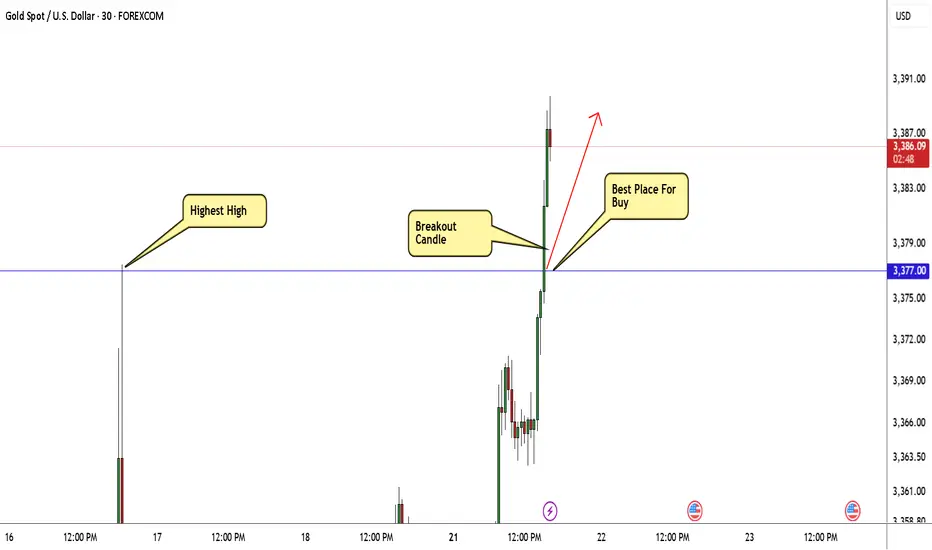
GOLD Breakout Done , Long Setup Valid To Get 200 Pips !Here is My 30 Mins Gold Chart , and here is my opinion , we finally above 3377.00 and we have a 30 Mins Candle closure above this strong res , so i`m waiting the price to go back and retest this res and new support and give me a good bullish price action to can enter a buy trade and we can targeting 200 pips , and if we have a 4H Closure Above This res this will increase the reasons for buyers , just wait the price to back a little to retest it and then we can buy it . if we have a daily closure below it this idea will not be valid anymore .
XAUUSD TRADE SETUPWait for retest the entry level and bullish momentum then take a trade for Buy otherwise skip this setup

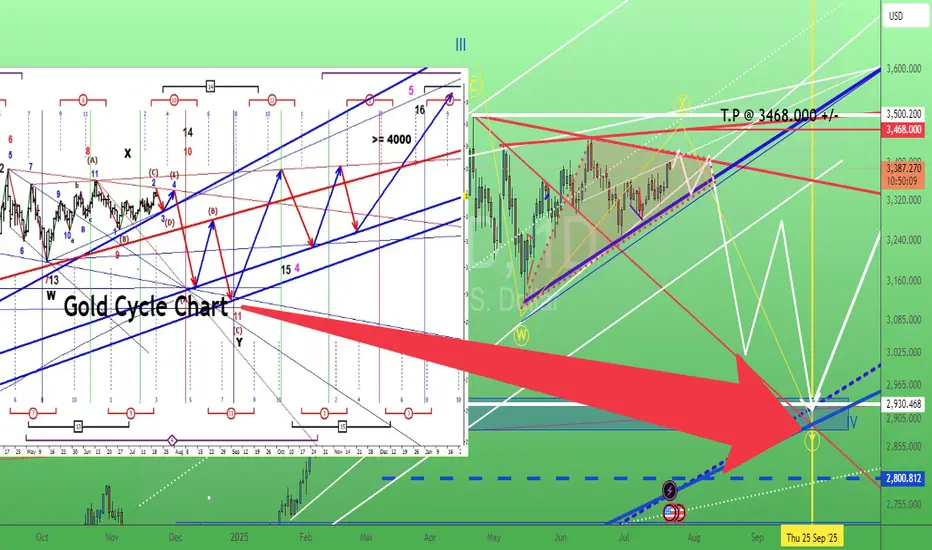
Gold is forming a bull or bear triangle. 22/July/25XAUUSD. is gold forming a bearish or bullish triangle, but the cycle chart shown it is pointing to the "south", maybe my analysis s is "wrong"...
XAU / USd 1 Hour Chart Hello traders. It was an impulse buy, but it worked out well. The chart shows it all. Perfect mvoe up, did well for my 1 trade this week thus far. Big G gets a shout out. Be well and trade the trend.

XAUUSD CAN FLY HIGHXauusd buy from 3375
Tp1 3385
Tp2 3395
Tp3 3405
Stope lose 3368
Trade at your own risk

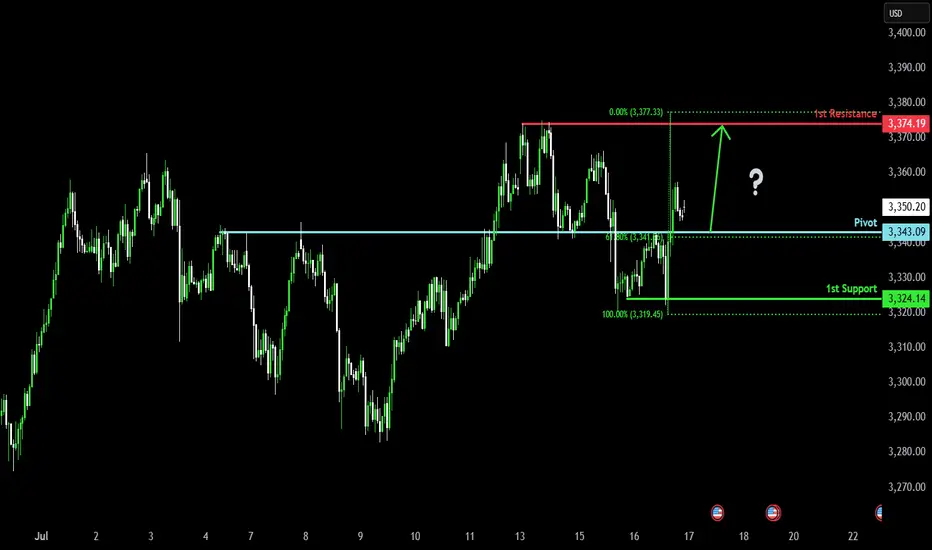
Bullish bounce off overlap support?The Gold (XAU/USD) is falling towards the pivot which has been identified as an overlap support and could bounce to the pullback resistance.
Pivot: 3,343.09
1st Support: 3,324.14
1st Resistance: 3,374.19
Risk Warning:
Trading Forex and CFDs carries a high level of risk to your capital and you should only trade with money you can afford to lose. Trading Forex and CFDs may not be suitable for all investors, so please ensure that you fully understand the risks involved and seek independent advice if necessary.
Disclaimer:
The above opinions given constitute general market commentary, and do not constitute the opinion or advice of IC Markets or any form of personal or investment advice.
Any opinions, news, research, analyses, prices, other information, or links to third-party sites contained on this website are provided on an "as-is" basis, are intended only to be informative, is not an advice nor a recommendation, nor research, or a record of our trading prices, or an offer of, or solicitation for a transaction in any financial instrument and thus should not be treated as such. The information provided does not involve any specific investment objectives, financial situation and needs of any specific person who may receive it. Please be aware, that past performance is not a reliable indicator of future performance and/or results. Past Performance or Forward-looking scenarios based upon the reasonable beliefs of the third-party provider are not a guarantee of future performance. Actual results may differ materially from those anticipated in forward-looking or past performance statements. IC Markets makes no representation or warranty and assumes no liability as to the accuracy or completeness of the information provided, nor any loss arising from any investment based on a recommendation, forecast or any information supplied by any third-party.
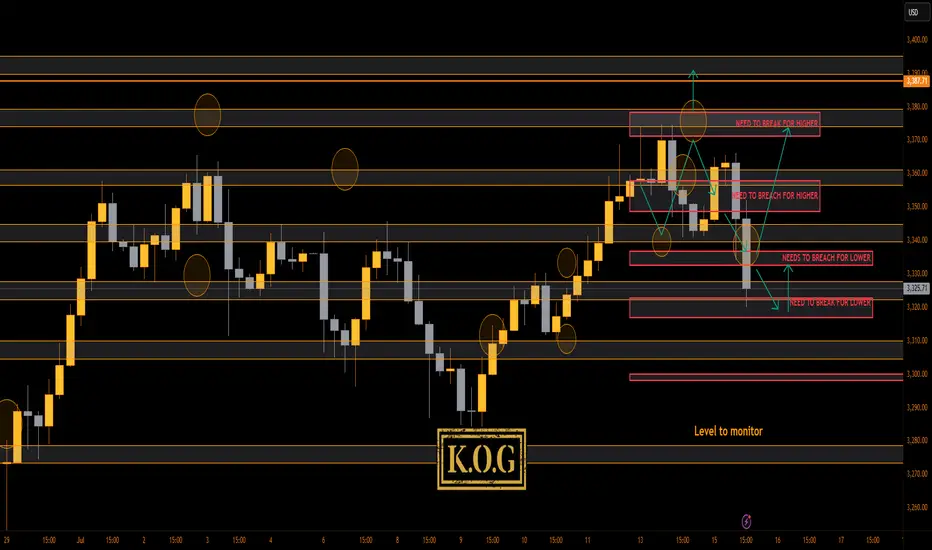
THE KOG REPORT - UpdateEnd of day update from us here at KOG:
Madness on the markets. I can honestly say, if you're less experienced in these markets, and like some of you trading with large lots and large or no SL's, you're unfortunately going to get yourself into a little bit of a pickle.
Did it go to plan today? Yes, and no! We followed the path which worked, but then we wanted support to hold at the bias level 3340 to then push us back upside. We got a small bounce for 100pips on the red box indicators but ideally we wanted this to completed the move up before coming back down. We're now at crucial support 3320 with resistance at the 3335-40 region, which, if we hold here without breaching should be a decent retracement on this move.
Other than that, I can say our plan for today wasn't as we hoped, we took an SL but then got a 100pip bounce. It is what it is
RED BOXES:
Break above 3365 for 3372, 3375, 3388 and 3406 in extension of the move
Break below 3350 for 3335✅, 3330✅, 3326✅ and 3307 in extension of the move
As always, trade safe.
KOG
Weekly XAUUSD Outlook | July 21–25GoldFxMinds | Structure-Based HTF Plan
Hello traders,
This week we’re back in key HTF territory. Price is compressing inside a premium structure zone, between clean supply and demand areas. Trend is still bullish, but momentum is weakening — so we focus on structure to guide us.
🟨 Weekly Bias: Neutral | Range Structure in Play
We currently have no confirmed bullish or bearish bias on the weekly timeframe.
Gold remains trapped in a macro range between:
🟥 Upper Resistance Zone: 3355–3380
🟦 Lower Demand Zone: 3280–3240
Last week’s movement created a wick grab near 3375 followed by a strong push down, but without a clean break of structure — meaning we’re still inside a distribution–accumulation trap.
📌 Until we see a clear breakout (above 3380 or below 3280), the weekly bias remains neutral.
This is not a time to force directional trades on the weekly.
Instead, we wait for Daily and H4 confirmation, and position ourselves around the edges of this weekly range.
🔹 Last Week Recap
Weekly candle created a wick into 3377, rejecting just under previous week’s high. No BOS, no liquidity sweep with continuation — just a clear rejection inside supply, confirming premium trap.
Weekly candle closed with a top wick and small body — price is compressing under resistance. Still bullish structure, but not impulsive.
🔹 Weekly Key Structure Zones
🔸 3365–3390 (Supply)
→ Reason: Rejection from prior weekly high (3377), aligned with clean OB and FVG left behind from June breakout.
→ Structure context: No bullish BOS above 3375. This is now an unbroken supply zone with strong wick rejections. Liquidity sits above.
→ Use: Wait for price to tap back in → look for M15–H1 reaction for possible sell if no BOS above 3390.
🔸 3430–3450 (Supply - Last Line)
→ Reason: Unmitigated impulsive candle OB from prior macro swing high. This zone marks the final structure before a full continuation toward new highs.
→ Structure context: If this breaks with a strong BOS, macro structure flips bullish again.
→ Use: Only engage if price clears 3390 with strong volume and closes → watch this for last reaction zone.
🔸 3285–3260 (Demand)
→ Reason: Last bullish OB + FVG combo from early July, unmitigated. Price never retraced to this base since the rally.
→ Structure context: No BOS down yet, so this is still valid bullish origin.
→ Use: If price pulls back aggressively this week, watch this zone for LTF confirmation (CHoCH or BOS bullish). This would be a clean discount buy.
🔸 3210–3180 (Deep Demand)
→ Reason: Higher timeframe CHoCH origin zone, aligns with Fibonacci 61.8% retracement from entire May–July swing.
→ Structure context: Only in play if 3260 fails and we get clean BOS down on Daily.
→ Use: This is your swing buy zone if market breaks structure lower. Strong confluence for reaction.
🔹 HTF Structure Recap
Weekly trend: Still bullish (no BOS down), but compression under resistance
Structure range: Between 3390 and 3260 — price inside premium, no breakout yet
EMA Flow: Bullish but extended. Space for retracement.
RSI: Divergence above 3350 — supporting possible retrace.
🔹 Macro Events This Week
Tuesday: Powell speaks 🗣️ (volatility risk)
Thursday: Flash PMIs (usually directional)
Friday: Durable Goods & Home Sales 🏡
⚠️ Be patient on high-impact days. Let price come into your marked zones — don’t chase inside noise.
🔹 Summary & Plan
We are inside a macro range between 3390 (supply) and 3260 (demand). Structure is not broken — so we play both sides:
Sell Setup: If price taps back into 3365–3390 with no BOS → watch for reaction
Buy Setup: If price retraces into 3285–3260 → look for clean bullish CHoCH to validate
Middle area = chop. Wait for price to get to structure zones — don’t guess.
Thanks for reading 💛
We’ll drop daily and intraday outlooks once price moves closer to one of these structure zones. Until then:
🎯 Trade the reaction, not the prediction.
🔥 If you want these levels and sniper plans every day, follow , like 🚀🚀🚀 and drop a comment if you caught the move!
Stay focused, stay sharp, and never force a trade.
GoldFxMinds
Gold has broken trendline and consolidatingGold has broken trendline and consolidating in narrow zone waiting for bullish fundamental cue.

XAUUSD For Swing Trade It has broken out of a symmetrical triangle and looking good for a swing trade.

Gold - Week of 21st JulyWelcome to a new trading week. Price is compressing within a premium structure, boxed between clean supply and demand zones. While the overall trend remains bullish, momentum is clearly fading — so structure takes priority this week.
🟨 Weekly Bias: Neutral | Range-Bound Conditions
There’s no clear directional conviction on the weekly timeframe — we’re in a consolidation phase.
📊 Technical Overview & Strategy
We’re currently range-locked between:
Main Supply: 3380–3405
Main Demand: 3275–3250
Until either breaks decisively, we treat this as a two-sided market.
🔹 Weekly Key Zones
🔸 3365–3390 (Primary Supply)
Why it matters: Price was rejected cleanly from a previous weekly high (3377), aligning with a fresh Order Block (OB) and Fair Value Gap (FVG) from June.
Context: No bullish Break of Structure (BOS) above 3375. Repeated wick rejections indicate strong supply.
Game plan: If price returns, monitor M15–H1 for reaction. Consider shorts only if there's no BOS above 3390.
🔸 3430–3450 (Final Supply Barrier)
Why it matters: Unmitigated OB from a macro swing high — the final ceiling before bullish continuation.
Context: A clean BOS through this zone flips the larger structure bullish again.
🔸 3285–3260 (Key Demand Base)
Why it matters: Last untouched bullish OB + FVG combo from early July.
Context: No downside BOS yet. If price pulls back sharply, this zone offers a potential clean long from discount.
🔹 HTF Structure Summary
Trend: Still bullish (no BOS down), but compression under key resistance
Structure Range: 3390–3260
EMA Flow: Bullish, but extended — watch for pullbacks
RSI: Bearish divergence above 3350 — potential retracement brewing
🕯️ Daily Zones
🔸 Supply Zones
3380–3405 – Main Daily Supply / Liquidity Pool
Top of current range. Multiple upper wicks = rejection zone. Unless we get a daily close above 3405, this remains a trap for breakout buyers.
3355–3375 – Internal Supply / Inducement Block
Acted as a consistent ceiling post-CPI. Often triggers fake breakouts and quick reversals — ideal for fading strength.
🟢 Demand Zones
3312–3300 – Mid-Range Internal Demand
Reactive level post-CPI and NY session. Often used for stop hunts and intraday bounces.
3275–3250 – Main Daily Demand
Held firm as support all month. Every dip here has resulted in strong rallies. A daily break below flips the HTF bearish.
⏱ H1 Execution Map
🚩 SELL ZONES
3358–3370 – Primary Intraday Supply
Site of last week’s failed breakout. If price taps this and shows M15/M5 bearish momentum — it’s a sniper entry short.
3380–3395 – Upper Liquidity Trap
Classic fakeout zone. If breakout fails with a sharp reversal, it’s prime territory for “fade and dump” trades.
⚪ DECISION ZONE (Neutral / Pivot)
3335–3345:
A choppy, indecisive area. No clear OB or FVG. Avoid trading here — only observe and wait for clean setups on the edges.
🟢 BUY ZONES
3326–3332 – Primary Intraday Demand
Strong evidence of absorption + sharp reversals. Look for clean M15/M5 snapbacks — a reactive long setup.
3311–3320 – Deep Demand / Fear Zone
Sits below recent lows — ripe for liquidity sweeps. Only consider longs if a strong impulsive bounce follows. High risk, high reward.
Disclaimer: For educational context only.
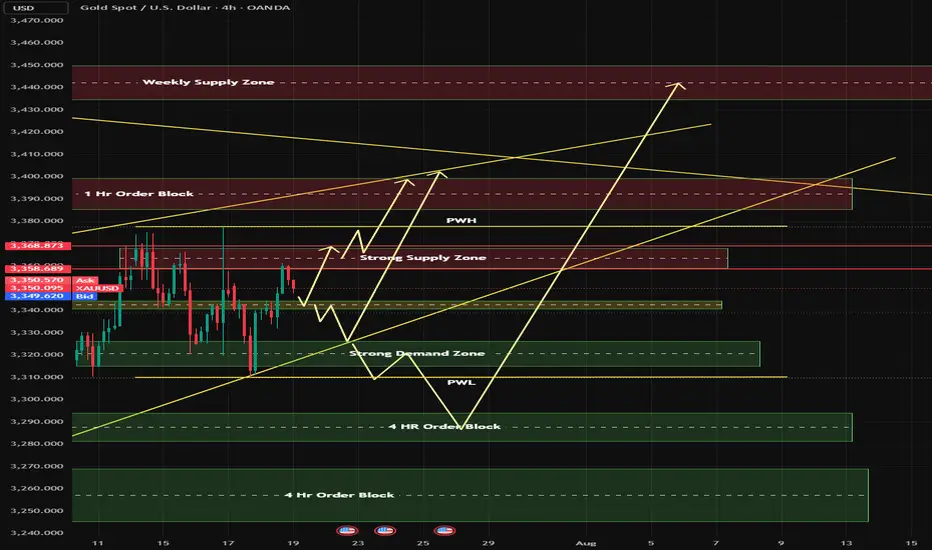
Short Idea possibleFollowing up from the recent run up to @ 3400, from a trend line POV there are still 2 targets that will be favourable for shorts.
These levels are 3400, 3420 to 3440.
The 3420 to 3440 range also confluences with weekly sell cluster, which means seller conviction in the past. As time went by, this level was protected by sellers, high probability they do this same this time
Looking for a slow rotation and Choch on 5 to 15 mins within the ranges of 3420 - 3440 for a strong pullback to @ 3370.

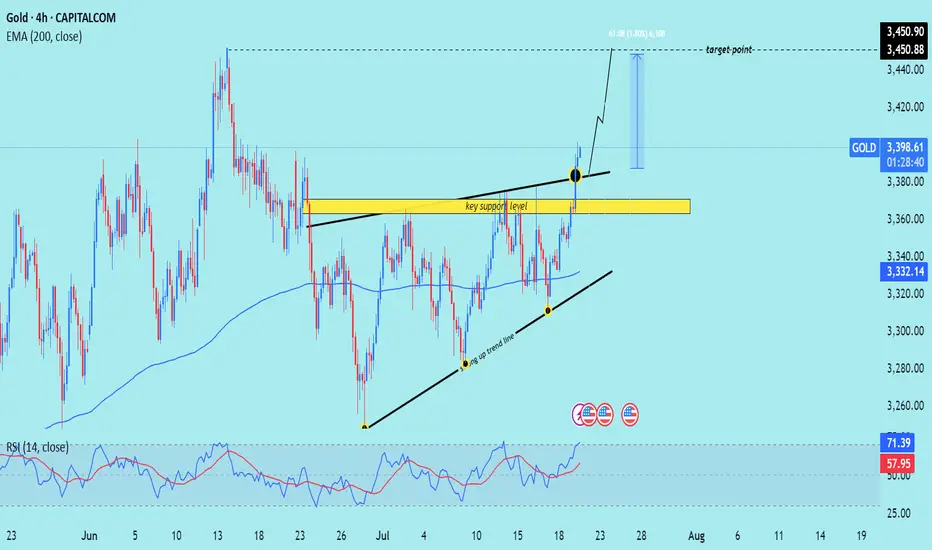
XAU/USD) breakout analysis Read The captionSMC Trading point update
Technical analysis of (XAU/USD) on the 4-hour timeframe, highlighting a move toward the $3,450 target. Here's the full technical breakdown
---
Technical Analysis – Gold (4H)
1. Breakout from Resistance Zone
Price has broken above a key horizontal resistance level (now turned support, marked in yellow).
The breakout is confirmed by a strong bullish candle with momentum, suggesting buyers are in control.
2. Ascending Triangle Formation
Price formed an ascending triangle, a classic bullish continuation pattern.
The breakout above the upper boundary confirms the pattern, projecting a potential measured move.
3. Trendline Support & Higher Lows
The structure shows a rising trendline (black), where price bounced multiple times — confirming a higher low sequence.
The confluence of trendline support + breakout level adds strength to the bullish case.
4. 200 EMA Confluence
The 200-period EMA (3,332.13) has been acting as a dynamic support throughout.
Price retested it earlier in the move, then surged upward — validating trend continuation.
5. RSI Indicator
RSI is at 71.13, entering overbought territory.
This implies strong bullish momentum, but a short-term pullback to retest the breakout level is possible.
6. Target Projection
Target Point: $3,450.90, calculated from the height of the triangle (~61 pts or 1.80%) added above the breakout zone.
A retest of the breakout area (yellow zone) around $3,370–$3,380 could offer a better entry before continuation.
Mr SMC Trading point
---
Summary
Bias: Bullish
Current Price: $3,397.62
Support: $3,370–$3,380 zone (previous resistance turned support)
Trend: Higher lows + breakout above resistance
EMA Support: 200 EMA at $3,332.13
Target: $3,450.90
RSI: 71.13 – bullish but near overbought
Please support boost 🚀 this analysis)