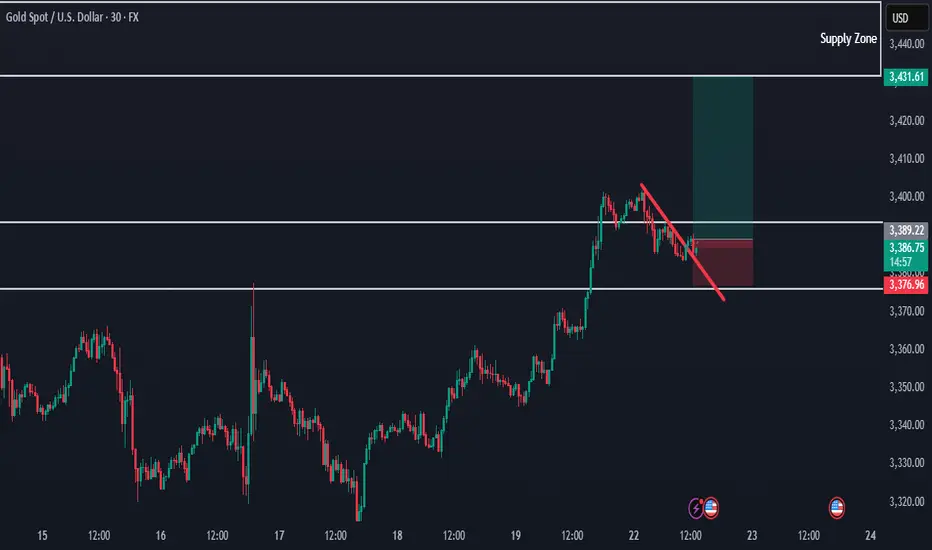
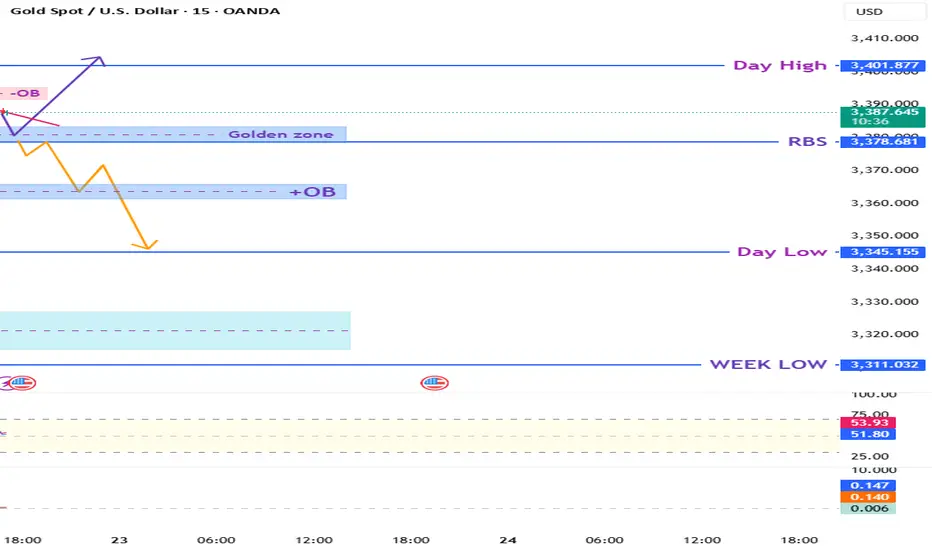
Gold at Key Decision Zone! Bounce from Golden Zone or Breakdown ✍️ Description:
Gold is approaching a critical Golden Zone near the RBS level (3,378). Price is currently compressing below a descending trendline and is testing hidden demand.
🔍 What to Watch:
📌 If price holds and reacts bullishly from the Golden Zone, we may see a strong rally towards Day High (3,401).
📌 But a break below this zone could trigger a bearish drop toward Day Low (3,345) or even Weekly Low (3,311).
⚡ RSI and MACD both show consolidation — big move likely soon.
🔁 Wait for clear reaction at Golden Zone before entering — price is at a make-or-break zone!
XAUUSDK trade ideas
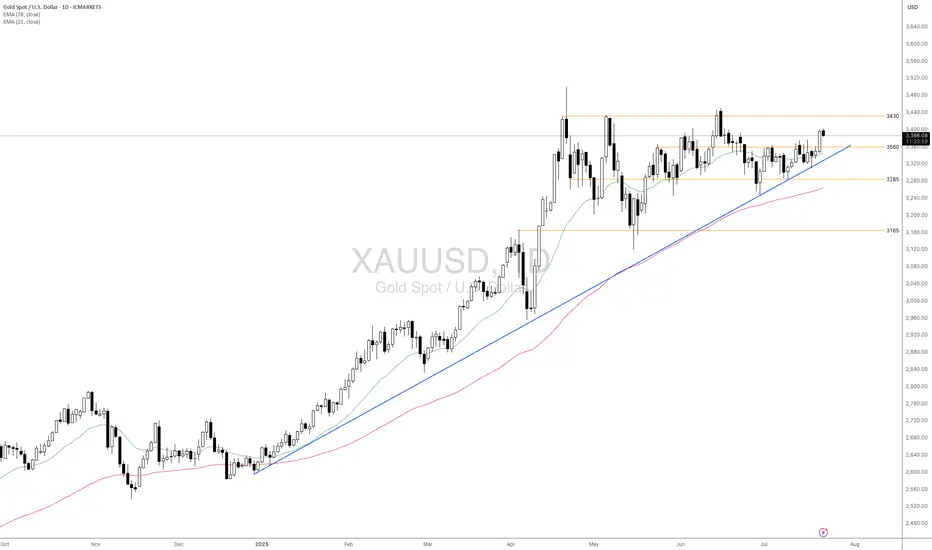
Will The Emerging Uncertainties Support Gold Ahead?Macro approach:
- XAUUSD advanced this week, supported by broad-based US dollar weakness and reviving safe-haven demand amid rising global trade tensions. The yellow metal briefly reached a five-week high as investors sought safety following headlines of escalating US tariffs and uncertainty over the Fed’s policy direction.
- Gold may remain well-supported if risk aversion persists, with upcoming global PMIs and further US trade developments set to guide market direction. Additional Fed commentary and central bank actions could trigger new volatility for XAUUSD throughout the week.
Technical approach:
- XAUUSD remains above both the EMA21 and EMA78, reflecting ongoing bullish momentum. The recent price action shows consolidation below the resistance at 3430 after rejecting the swing high. In contrast, higher lows have formed above the ascending trendline and the support at 3285.
- If XAUUSD stays above the support at 3560, it may extend towards the previous swing high at around 3430 and open for another record high.
- On the contrary, if the price drops below the support at 3560 and the ascending trendline, it may retreat toward the following support at 3165.
Analysis by: Dat Tong, Senior Financial Markets Strategist at Exness
XAUUSD Intraday / Swing Trade PlanTop-Down Analysis
D1: Price is currently in a ranging phase, moving sideways within a defined range.
H1 / H4: Lower timeframes are showing an uptrend.
However, price has already reached the 423% Fibonacci Extension on H1, which may trigger a significant pullback.
If a correction occurs on H1, but H4 structure remains bullish, we can look for continuation setups targeting the Fibonacci extension levels on H4.
Trading Strategy (Brief Overview)
Since price is ranging on the higher timeframe, we can trade "ping-pong style" — bouncing between key levels.
Trend Continuation
Look to follow the trend when price reacts at Key Level 1 (likely a demand zone or Fibonacci confluence).
Potential Reversal
Watch for a loss of momentum on H1 when price approaches Upper Key Level 2 — this could signal a reversal opportunity.


Gold holds steady near resistance – Is a breakout coming?Hello everyone, let’s explore today’s gold market together!
Overall, during the Asian session on Monday, gold traded cautiously, consolidating just below the nearest resistance level at $3,360, with minimal price movement. The uptrend remains strong, primarily driven by a sharp momentum shift last Friday following key news, as the weakening USD reignited investor interest in gold.
Current market sentiment suggests that major institutional funds and retail traders alike are showing renewed attention. As long as the previous support level around $3,330 holds firm, the next move could be a break above the $3,360 resistance, which would likely open the door for further upside expansion.
However, if price breaks below that support zone, I would consider the bullish setup invalid and shift to a wait-and-see approach until clearer signals emerge.
Feel free to share your thoughts in the comments — your perspective could contribute tremendous value to the global TradingView community!
GOLD 18.7.2025 FRIDAYHow to see on chart. waiting for clearly breakout of 4h channel then buying gold with SL . I see potencial taking Liquidity of 3390-3400. Enjoy!

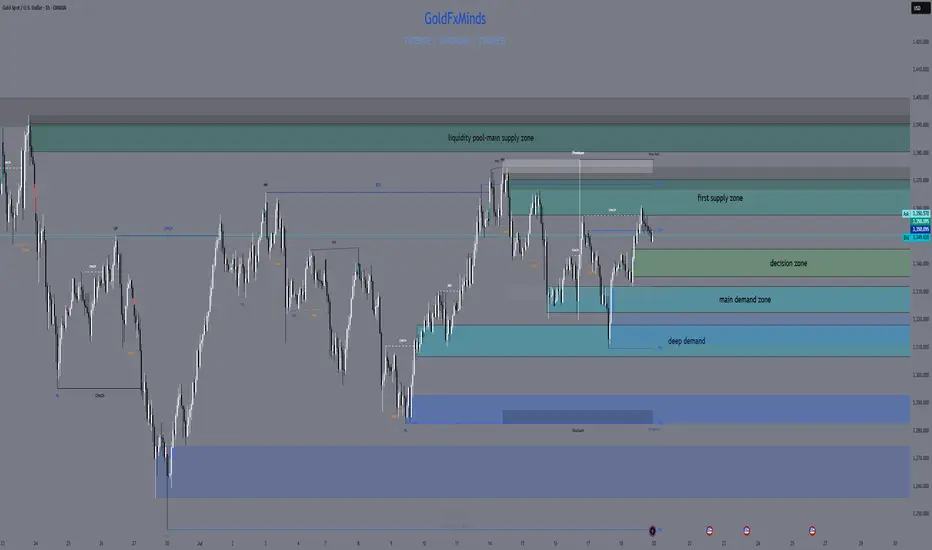
GOLD SNIPER PLAN – July 21, 2025Hey, GoldMinds! 🔥
This isn’t just another range day — it’s the type of market that separates disciplined snipers from impulsive chasers. If you want an edge, you need a plan that’s both sharper and more refined than what most see on their charts.
After a week full of fake breakouts, confusing swings, and whipsaw price action, gold is giving us the gift of clarity — but only for those patient enough to let the market reveal itself. Here’s how you cut through the noise and focus on the only zones that actually pay.
🚩 SELL ZONES
1. Primary Supply: 3358–3370
This is the fortress where real sellers pushed back hard. The structure here is crystal clear: last week’s failed breakout, sharp rejection, and a textbook H1/M30 order block. You want the sniper entry? Wait for price to tap here and only short if you see an instant, aggressive bearish response on M15/M5 — not just a slow drift.
2. Upper Liquidity Trap: 3380–3395
Classic trap for late buyers. This is where price loves to sweep stops and trigger emotional FOMO — but the real professionals are only interested if the move fails hard. Watch for a fake breakout and sudden reversal; this is the sniper zone for “fade and run” shorts.
⚪ DECISION ZONE (Neutral / Pivot)
Pivot Range: 3335–3345
Forget this level — it’s where amateurs get chopped up. There’s no order block, no real fair value gap, just confusion and false hope. A true sniper waits here, watching, not acting.
🟢 BUY ZONES
1. Main Demand: 3326–3332
This is the engine room for bulls: a refined order block, evidence of real absorption, and a history of sharp reversals. Don’t try to anticipate — let price come here and look for a snapback move on M15/M5. This is where patient buyers take their shot.
2. Deep Demand: 3311–3320
Where the fear turns to opportunity. This zone sits under recent lows, home to panic sweeps and emotional selling. Only consider a long if you see a powerful, impulsive bounce. The risk is high, but the reward for perfect timing is even higher.
BIAS & EXECUTION
Bias: Neutral, but watch for range expansion — the market is coiling for a bigger move.
Execution:
– Only act at the true edges, never in the middle.
– Let M5/M15 price action prove your setup — the market owes you nothing.
– If a zone breaks with momentum, do not fight the flow; stand aside or prepare for the next edge.
FINAL SHOT
This is where discipline pays.
Sniper trading is about letting the market come to you and striking only when your zone lights up with confirmation. Every other move is just noise, meant to shake out the impatient. Drop a comment below with the zone you’re watching most , follow and🚀🚀🚀 GoldFxMinds for daily sniper maps, and remember: in gold, only real structure pays.
Disclosure: Charts powered by Trade Nation. Educational content only.
Gold Setup. Midas losing his touch.TVC:GOLD has reached an all time high of $3500. It further created a LH @ $3435 in the daily TF. This signals the beginning of a possible down trend of the commodity with the current fundamentals as confluence.
Furthermore, TVC:GOLD is likely to reach level $3160 and possibly test levels as low as $2960, below the much acclaimed $3000 support structure.

Gold Strategy: Long in 3320-3330 & TargetsDuring Friday’s (July 18th) US trading session, spot gold traded in a narrow range with a downward bias 😔, currently hovering around 3350.05. Thursday saw spot gold stage a heart-stopping "deep V" move 😲! Driven by the dual catalysts of the US June retail sales surging 0.6% (beating expectations) and initial jobless claims dropping to 221,000, the US Dollar Index once spiked to a monthly high of 98.95, instantly slamming spot gold to an intraday low of 3309.82. Surprisingly, however, gold prices then staged a strong rebound, closing at 3338.86 with a mere 0.25% decline.
This "fake dip" pattern reveals a deep-seated contradiction in the current market – while economic data temporarily supports dollar strength, investors’ inflation concerns triggered by tariffs are forming an "invisible buying force" for gold 💪. The concurrent rise in the dollar and US Treasury yields has indeed weighed on gold prices, yet robust buying interest emerges at every dip window. Behind this phenomenon lies shrewd capital quietly positioning itself. When the 10-year US Treasury yield climbed to a monthly high of 4.495%, gold refused to fall further – this divergence signals significant market 分歧 over the Federal Reserve’s policy trajectory 😕.
Gold Trend Analysis:
Gold remains in a bullish trend 👍. From the daily chart perspective, gold continued its strong upward momentum today, closing with a positive candle. Technically, the MACD bullish energy bars have started to expand, and the KDJ is in a golden cross heading upward, indicating that the overall price is in a strong phase. As long as gold doesn’t break below 3320, the market is expected to continue its upward trajectory, potentially targeting 3375-3400. If it fails to break through, gold may see a minor short-term pullback. If the pullback doesn’t break 3330, gold is likely to gather momentum again to attack 3375; a break below would shift focus to the 3310 support level. As long as 3310 holds, gold remains in a bullish rebound structure. Next week’s broad range is expected to be 3375-3310.
On the 4-hour chart, the KDJ indicator, after being oversold, has started to turn upward and is now in a golden cross. Notably, this upward move has been accompanied by clear medium bullish candles, making KDJ a more reliable indicator here – the potential for continued bullish candles remains high 😃. The MACD fast line is turning upward at a high level, on the verge of another golden cross, with green energy bars continuing to contract and poised to turn red by inertia. Overall, gold’s current trend is either consolidating or rising. Given the clear bullish bias, we can consider firmly going long first, and only observe the possibility of shorting when KDJ approaches the upper 100 level and the MACD fast/slow lines are about to cross.
Focus on buying on pullbacks. The short-term support levels lie at 3330-3320 – as long as these levels hold, they present buying opportunities. If gold rises during the US session, watch whether 3365 and 3375 are broken; a failure to break through could bring pullback space, offering opportunities for short-term short positions.
Gold Trading Strategy 😎: Go long decisively once on the first pullback to the 3320-3330 range 😏, with targets looking at the 3350-3360 range – just wait for profits to roll in 💰!
🚀 Buy @3320 - 3330
🚀 TP 3340 - 3350
Accurate signals are updated every day 📈 If you encounter any problems during trading, these signals can serve as your reliable guide 🧭 Feel free to refer to them! I sincerely hope they'll be of great help to you 🌟 👇

Gold Market Opens 4th Week of July with Bullish Continuation Gold market opens the 4th week of July maintaining a bullish trajectory, with price action looking to continue toward 3370’s through 3390’s. Market sentiment remains firm as bullish structure builds momentum.
Eyes on the upcoming levels for potential reaction and continuation signals. follow for more insights , comment and boost idea

gold on sell#XAUUSD sell at 3362, the candle is rejecting on bullish which will make retracment on the price.
Entry below 3362 on H1 or M15 closure. Target 3344, stop loss 3372.
Bullish can break following longer candle closure on H1.

Gold – Bullish Structure Still Intact, but Bears are Knocking📉 What happened yesterday?
As expected, XAUUSD made another leg down, breaking even below my buy zone (3330–3335) and hitting a low at 3320. From there, we’re now seeing a modest rebound, with gold trading around 3333 at the time of writing.
📌 Current position:
I'm currently holding a long position. It hovers around break-even – fluctuating between small gains and small losses. Nothing solid yet.
❓ Key question:
Was this just a deep pullback within a bullish structure… or the beginning of a deeper trend reversal?
🔍 Why bulls still have a case:
• Price prints higher lows – bullish structure technically remains intact
• A clean break above 3350 would show short-term strength
• A confirmed break above 3375 would activate a bullish ascending triangle → targeting the 3450 zone
⚠️ But here's the concern:
• Yesterday’s dip to 3330 happened during the New York session (strong volume)
• The bounce from 3320 has been weak, with no follow-through
• Daily candle closed near the lows, showing a long upper wick → a classic bearish signal
• The confluence support now lies at 3310–3320. A red daily candle closing in this area could mean the medium-term trend is flipping
🎯 My trading plan:
Although I'm still holding my buy, if bulls don’t recover 3350 quickly, I will consider closing early. The break of 3310 would shift my bias bearish.
________________________________________
📌 Conclusion:
We’re in a critical zone. The bullish structure isn’t broken yet, but yesterday’s action was not encouraging. If buyers fail to reclaim control soon, the market may be preparing for a deeper correction. Stay sharp. 🚀
Disclosure: I am part of TradeNation's Influencer program and receive a monthly fee for using their TradingView charts in my analyses and educational articles.
Long XAUUSDElite Analysis
30m Bullish BOS
Broke away from structural liquidity
Targeting highs
This is an A set up (Not A+)
Executed on the 15m TF.
XAUUSD Analysis Today Hello traders, this is a complete multiple timeframe analysis of this pair. We see could find significant trading opportunities as per analysis upon price action confirmation we may take this trade. Smash the like button if you find value in this analysis and drop a comment if you have any questions or let me know which pair to cover in my next analysis.

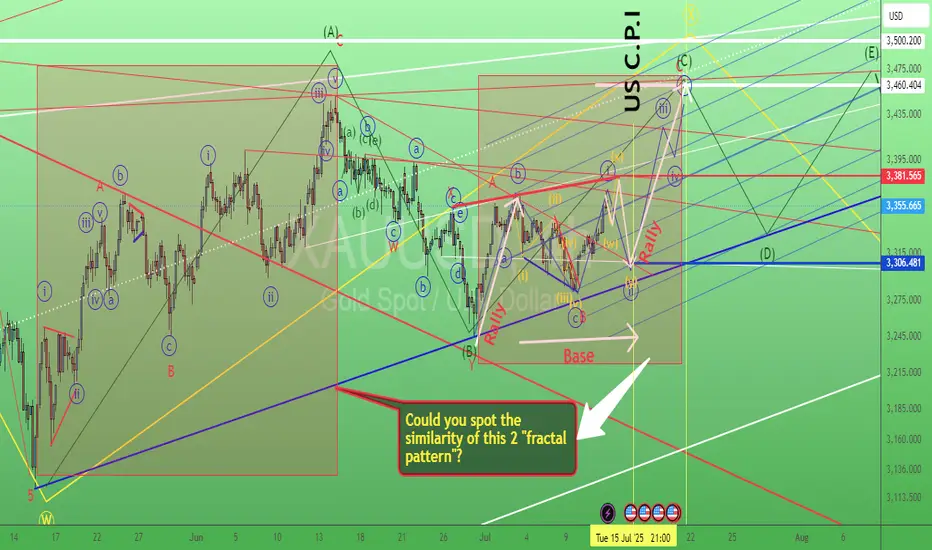
Gold swing trade setup 13/July/25XAUUSD. Based on the latest "speed" development of chart instead of forming a triangle pattern gold probably building a "flat" "Base" before rallying toward 3460 +/- Coming Tuesday US CPI could be the "trigger" for launching the rocket..
Report - 21 jully, 2025Executive Summary – Multi-Event Market Pulse
UK Retreats on Encryption Order: Facing U.S. tech retaliation risk, London softens its demand that Apple create backdoor access. Apple and WhatsApp resist, Washington defends encryption integrity. → Positive for U.S. tech (Apple, Meta), bullish Nasdaq, bearish UK regulatory credibility.
EU Confronts Italy and Spain Over Bank M&A Blocks: Brussels says national vetoes breach merger law. Push to consolidate banking into “EU champions.” → Bullish for European bank stocks if deal-making resumes. EUR volatility risk if tensions escalate.
Japan’s PM Under Fire After Upper House Loss: LDP loses majority amid cost-of-living and immigration backlash. PM Ishiba struggles to reach tariff deal with U.S. → Bearish for JPY near-term, pressure on USDJPY to rise. Uncertainty weakens Japanese equities.
Trump’s First 6 Months: Tariffs, ICE Raids, Fed Tensions, and Executive Rule:
DXY at risk as dollar has worst year since 1973.
Tariffs at 8.8% effective rate; targeting copper, autos next.
170 executive orders destabilize governance and investor sentiment.
“One Big Beautiful Bill” cuts taxes, axes Medicaid, boosts ICE funding.
→ Supports short-term U.S. GDP but structurally negative for dollar and fiscal outlook.
Audit Regulator Shakeup: PCAOB chief removed; deregulation wave begins. → Increased risk for audit quality in U.S. equities. Long-term trust implications.
London Stock Exchange Eyes 24-Hour Trading: In response to retail and crypto-driven demand. → Bullish for UK capital markets infrastructure long-term; potential tech strain and regulatory pushback.
Copper Markets Shaken by Tariff Uncertainty: Codelco warns of U.S. demand disruption. Supply chain anxiety for EVs, data centers. → Copper price volatility likely; bearish short-term if tariffs confirmed.
ECB Focused on Euro Strength’s Disinflation: Unlikely to comment amid tariff fog. → EUR strength may persist absent pushback; pressure on export-reliant EU names.
U.S. PMI and UK Retail Data Awaited: PMIs expected to cool modestly. UK data may worsen amid inflation and tax burdens. → Short-term equity volatility possible. GBP faces downside bias.
Strategic Forecast & Market Reaction
1. US–UK Encryption Clash
The UK government is being forced to retreat from its encryption crackdown targeting Apple’s most secure cloud services after escalating pressure from U.S. leadership, including Vice President JD Vance and President Trump. With Apple and Meta resisting surveillance backdoors and withdrawing services from the UK, tech-sector alignment with U.S. privacy norms is reaffirmed. Britain’s attempt to enforce decryption via the Investigatory Powers Act triggered transatlantic diplomatic strain, risking bilateral tech partnerships.
Market Impact: Bullish for large-cap U.S. tech (especially Apple, Meta), supportive of Nasdaq (NDX) and S&P 500 (SPX) tech sector weight. UK regulatory credibility weakens, negative for UK-listed tech firms. Expect near-term outperformance of U.S. tech relative to EU/UK peers. U.S. surveillance policy divergence also solidifies investor bias toward Silicon Valley over European counterparts.
2. EU–Italy/Spain Banking Intervention
Brussels’ direct challenge to Italian and Spanish interference in major bank mergers marks a potential turning point in European financial consolidation. Legal warnings to Meloni’s government and formal notice to Spain over BBVA–Sabadell freeze signal EU commitment to a unified capital market.
Market Impact: Bullish for EU bank equities (e.g., UniCredit, BBVA, Banco BPM) if mergers are unblocked. EUR may gain if consolidation expectations rise. Sovereign risk premium in Italy/Spain could briefly widen. European bank ETFs (e.g., EUFN) may attract inflows.
3. Japan’s Political Shakeup
Prime Minister Ishiba faces an internal leadership challenge after losing the LDP’s upper house majority. Tariff tensions with the U.S., especially affecting Japan’s auto sector, add pressure. The rise of populist and xenophobic parties adds volatility.
Market Impact: Bearish for JPY (USDJPY bullish bias). Risk-off sentiment may suppress Nikkei momentum. Japanese auto stocks face downside on unresolved U.S. tariff risks. Foreign investors may pause equity allocations pending leadership clarity.
4. Trump’s Institutional Shockwaves
Six months into his second term, Trump’s sweeping executive agenda — including $64B in tariff revenue, Fed destabilization, mass ICE arrests, and the “One Big Beautiful Bill” — is reshaping U.S. macro dynamics. Dollar weakness (-12% YTD), structural fiscal erosion, and regulatory disintegration (PCAOB ouster, Musk-led “Doge” agency cuts) risk undermining long-term asset trust.
Market Impact:
DXY: Structural weakening pressure → 🔻
XAUUSD: Supported by institutional instability → 🔼
SPX: Volatile with upside if GDP stays strong, but institutional drag rising → 🔁
2Y/10Y Yields: Sticky inflation + fiscal dysfunction = steeper curve → 🔼
Copper (HG1): At risk from U.S. tariff uncertainty → 🔻 short-term
Key Global Asset Reactions
XAUUSD (Gold):
Institutional erosion and rising CPI expectations support gold. If Powell is forced out or dollar drops further, gold likely reclaims $3,400+.
Direction: 🔼 Medium-term
S&P 500 / SPX:
Rotation into financials, M&A resurgence, and U.S. tech resilience provide upside offset. But tax/reform volatility raises headline risk.
Direction: 🔁 Near-term; 🔼 if earnings beat
USDJPY:
LDP instability + Fed yield premium = weak yen. Unless Ishiba resigns and risk-off returns, 150–152 in play.
Direction: 🔼 Short-term
DXY:
Threatened by executive overreach, weakening investor trust, and fiscal imbalance. Could breach 103 to the downside if data turns.
Direction: 🔻 Structural bias
Crude Oil (WTI):
Geopolitical bid (Japan, copper disruption) offset by global macro risk. Could trade $65–$70 range.
Direction: 🔁 Neutral for now
Dow Jones:
Outperformance due to dividend bias, financials strength, and lower tech exposure. Value rotation continues.
Direction: 🔼 Steady upside

NordKern - XAUUSD InsightNordKern | Simplified Insight OANDA:XAUUSD Short Opportunity Ahead
Gold saw a sharp surge in price today, primarily driven by political headlines that temporarily shook market sentiment. To be specific:
📅 Jul 16, 2025 – 16:56 CET
CBS Reports: Trump asked Republican lawmakers whether he should fire Fed Chair Jerome Powell. This headline alone triggered an intraday spike of +$52/oz in gold as markets priced in increased macro and institutional risk.
As previously stated "Context Matters."
While the President cannot remove the Fed Chair without cause, even the suggestion introduces uncertainty and undermines confidence in the Fed’s independence especially ahead of a high-stakes election cycle.
However, further developments quickly followed: 📅 Jul 16, 2025 – 17:58 CET
Trump: “Firing Powell is highly unlikely.” 📅 Jul 16, 2025 – 18:06 CET
Trump: “Reports on me firing Powell are not true.” With this clarification, the initial rally appears overstretched and sentiment-driven, leaving room for a corrective pullback as the market digests the full picture.
Trade Setup - Short Bias
Parameters:
Entry: 3356.40
Stop Loss: 3690.30
Take Profit: 3322.00
Key Notes:
- The spike was headline-driven and not supported by policy shift or macro data.
- Trump’s denial removes much of the political risk premium that had been briefly priced in.
- Watch for momentum fading near resistance and confirmation via intraday structure.
This remains a tactically driven setup. Manage risk appropriately and stay alert for any renewed political developments.
Gold on high time frame
"Hello traders, focusing on gold, the price recently swept liquidity around $3,250 and displayed strong signals indicating a potential upward movement. The next target could be around $3,400."
If you need further clarification or have more details to discuss, feel free to share!

GOLD (XAU/USD) MA Breakout – High-Probability Long Setup!💰🚨 GOLD HEIST ALERT! XAU/USD MASTER PLAN (Thief Trading Style) 🎯
🔥 Steal Pips Like a Pro – High-Probability Gold Breakout Strategy! 🔥
🎯 Thief Trading’s GOLD Heist Strategy (Swing/Day Trade) �💸
👋 Hey there, Market Pirates & Profit Snatchers! 🌍✨
Based on our 🔥Thief Trading Style🔥 analysis, we’re plotting a major heist on XAU/USD (GOLD). The plan? Buy the breakout, escape before the cops (resistance) arrive! 🚔💨
📈 ENTRY ZONE: The Heist Begins!
🚀 "Wait for the MA Breakout (3400) – Then Strike!"
Bullish Confirmation: Enter on a 15M/30M pullback after MA breakout.
Thief’s Trick: Use Buy Stop above MA or Buy Limit near swing lows for best risk-reward.
DCA/Layering Strategy: Deploy multiple limit orders to maximize gains.
🔔 Set an ALERT! Don’t miss the breakout – thieves move fast! ⏳
🛑 STOP LOSS: Protect Your Loot!
📍 Thief’s SL Placement: 3330.00 (4H Swing Low) – Adjust based on your risk & lot size.
⚠️ WARNING: If using Buy Stop, DO NOT set SL until after breakout – unless you love unnecessary losses! 🔥
🎯 TARGET: Escape with the Gold!
🏴☠️ Take Profit Zone: 3460.00 (or Exit Early if Bears Show Up!)
Scalpers: Only trade LONG side – use trailing SL to lock in profits.
Swing Traders: Ride the wave but watch for resistance traps!
📰 MARKET CONTEXT: Why This Heist?
Neutral Trend (But Bullish Potential! 🐂)
Key Factors: Geopolitics, COT Data, Macro Trends, Sentiment Shift
🚨 News Alert: Avoid new trades during high-impact news – trailing SL saves profits!
💥 BOOST THIS HEIST! (Like & Share for More Pips!)
💖 Hit the 👍 Boost Button to strengthen our Thief Trading Crew!
🚀 More Heist Plans Coming Soon – Stay Tuned!
⚠️ DISCLAIMER (Stay Safe, Thieves!)
This is NOT financial advice. Do your own analysis & manage risk.
Markets change fast! Adapt or get caught.
🎯 Happy Trading, Pirates! Let’s Steal Some Gold! 🏴☠️💛
XAUUSD (Gold) Buy Setup✅ Entry: As marked on chart
🎯 Take Profit 1 (TP1): Highlighted on chart
🎯 Take Profit 2 (TP2): Highlighted on chart
🎯 Take Profit 3 (TP3): Highlighted on chart
🛑 Stop Loss (SL): Defined below recent swing low
📊 Technical Insight (Dow Theory):
Gold is currently in a primary uptrend, confirmed by a series of higher highs and higher lows on the daily chart.
Recent price action shows a secondary retracement that has respected the previous swing low, maintaining structural integrity.
A bullish reversal has emerged at a key demand zone, signaling potential continuation of the primary trend.
Momentum indicators align with the trend, and volume analysis suggests accumulation, supporting bullish bias.
📍 As long as price remains above the stop loss level, we anticipate a drive towards TP1 and potentially TP2, TP3 as the next leg of the uptrend unfolds.
🚨 Conservative traders may wait for a confirmed breakout above the last minor high for further validation.
Gold technical analysis and trading strategyGold technical analysis and trading strategy
From the daily level, the gold price has confirmed that it has broken through the lower track support of the large convergence triangle, forming a typical three-day continuous pull-up pattern. Yesterday's big positive line was full of entities, not only breaking through the 3365-3377 area of the previous few weeks of shock highs, but also standing on the 3380 mark of the small convergence triangle trend pressure level, which opened up technical space for subsequent rises.
The 4-hour chart shows that the price continued to strengthen after breaking through the middle track, and the MACD indicator golden cross ran well, indicating that the bullish momentum is increasing. It is worth noting that the previous resistance area of 3365-3377 has now been transformed into an important support belt, and together with the 5-day moving average of 3360, it constitutes a callback defense line.
【Key price analysis】
Support:
The primary support is in the 3380-3383 range, which is the resonance area of the trend line conversion support and the middle track of the hourly chart
The secondary support is at 3360-3365, including the 5-day moving average and the previous breakthrough position
Resistance:
The short-term primary target is the 3408-3420 area, which is the upper track of the large convergence triangle
After the breakthrough, it will challenge the space above 3450, and then a unilateral upward trend may be launched
【Disk details observation】
In the morning, the gold price experienced a technical correction after testing the overnight high of 3401, but it remained above the 3380 support. From the hourly chart:
There is obvious buying in the 3382-3383 area
Although the price briefly fell below the middle track of 3386, it quickly recovered the lost ground
If the US market can regain the 3400 mark, it will confirm the start of a new round of upward attack
It is particularly worth noting that the current market presents a typical time-for-space feature. If the 3380 support fails to be effectively broken before 22:00, it is likely to complete the adjustment through sideways consolidation and then directly start the upward attack.
"In the context of a clear positive trend, it is recommended to adopt a trading strategy of mainly doing more on pullbacks:
Ideal entry point for long orders: 3400-3405 range
Strict stop loss setting: below 3395
Initial target: 3415-3420 area
After breaking through 3420, you can continue to hold and look at 3450
For aggressive traders, you can try to go long with a light position in the 3400-3410 support area, but you need to strictly control your position. Conservative investors can wait for the price to stabilize at 3400 before intervening."
Professional reminder: "The essence of trend trading is to follow the trend. The current gold price has formed a complete upward channel, and each pullback is a good opportunity to arrange long orders. But you need to pay attention to controlling your position and guard against the short-term volatility risks that may occur in the US market."
Gold Breaking Previous Highs — Bullish Trend ContinuesHello everybody!
Price is continuing its bullish trend and has broken some significant resistance.
According to the market structure, we’re looking for it to go higher, up to the 3430 area.
The break of the downward trendline is a confirmation for a buy position.
Manage your risk and trade safe!