Elliott Wave Analysis – XAUUSD | July 22, 2025
🔍 Momentum Overview
• D1 timeframe: Momentum has entered the overbought zone, signaling a potential reversal within the next 1–2 sessions. That said, the current bullish leg may still extend — it’s important to wait for tomorrow’s D1 candle close for confirmation. Entering overbought territory is a warning that upside momentum is weakening.
• H4 timeframe: Momentum is currently declining. Unless a strong bullish candle closes above 3391 to trigger a reversal, the price is likely to continue moving sideways or downward today.
• H1 timeframe: There are signs of a bullish reversal. If the price holds above 3385 and posts a strong breakout candle above 3391, it could present a short-term buying opportunity.
🌀 Elliott Wave Structure Update
• Price is consolidating within the 3390 – 3402 range — a key zone to monitor closely.
• The 3380 level is a critical threshold, aligned with the 0.382 Fibonacci retracement of Wave (3). A daily close below this level would raise the possibility that the move is part of a correction rather than Wave 4.
• A flat ABC correction is currently unfolding, with the 1.618 extension of Wave A already reached at 3385.
• If price breaks below 3360, it would overlap with the previous Wave 1, invalidating the current impulsive wave count. In that case, we should consider the potential continuation of a larger abcde triangle correction.
🔗 Momentum & Wave Structure Combined
• H1 is showing early signs of a bullish reversal, but H4 momentum remains bearish. Without a strong breakout candle above 3391, price is likely to drift sideways or lower until H4 reaches the oversold zone.
• Conservative approach: Wait for H4 to enter oversold territory before considering any long positions.
• The ideal buy setup would be a bullish reaction from the 3382 – 3380 zone.
📈 Trade Setup
• Buy Zone: 3382 – 3380
• Stop Loss: 3372
• Take Profit 1: 3402
• Take Profit 2: 3412
• Take Profit 3: 3428
XAUUSDK trade ideas

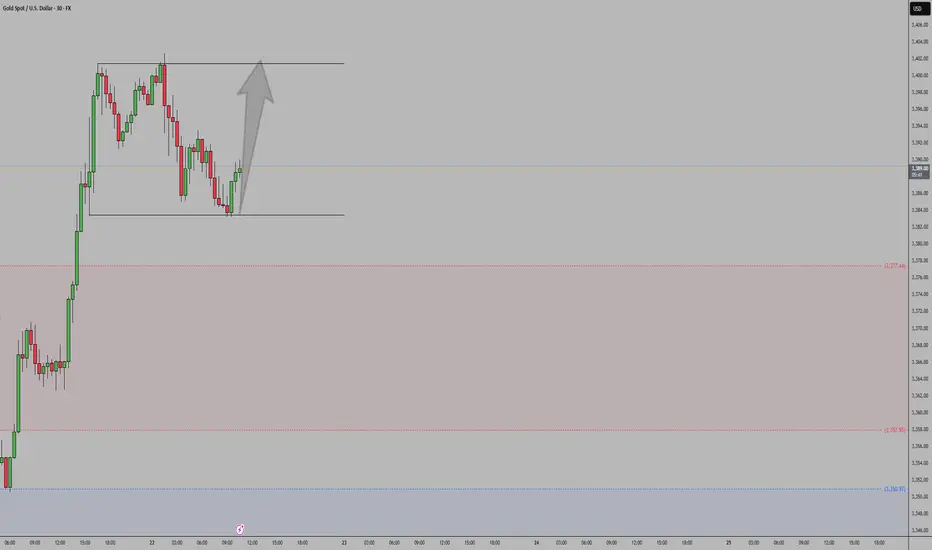
GOLD to the MoonHiper Clear Structure and the beginning of a new impulse towards 3.600 and 3.700
Hope everybody had a chance to got in
gg

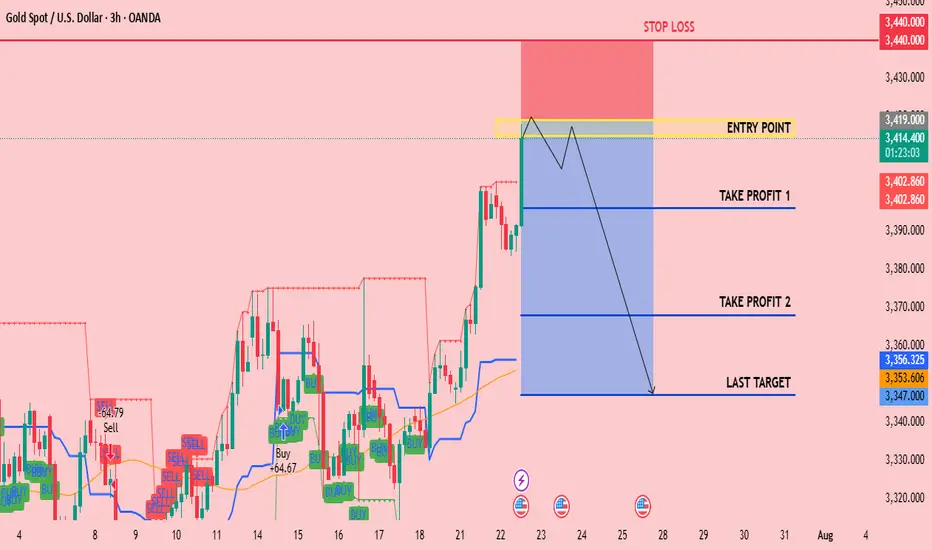
CHECK XAUUSD SIGNAL READ CAPTAINEntry Point: Around 3419 3415
Stop Loss: Around 3440
🎯 Target Levels
Take Profit 1:
3396
Take Profit 2:
3368
last target
3347
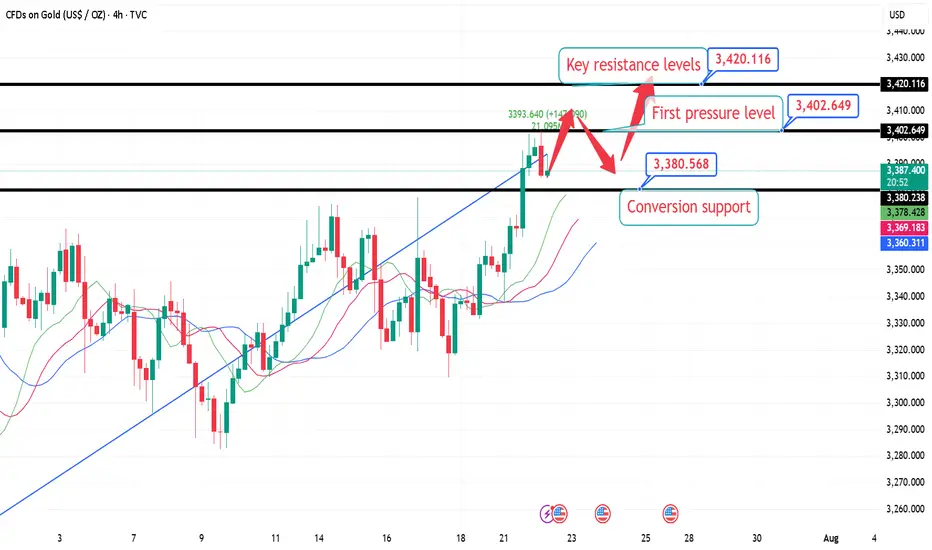
7.22 London Gold Market Analysis and Operation SuggestionsFrom the market perspective, the trend suppression line from the historical high of 3500 to the secondary high of 3452 has moved over time and is now around 3420, which can be used as an important resistance level reference for this week; the previous resistance level of 3376 can be converted into support after breaking through. For intraday short-term operations, focus on this range of callbacks and go long, wait for the key resistance level to be touched before going short, or see if there is an opportunity to arrange a mid-term short order based on the real-time trend.
Specific intraday operation ideas:
①. When the gold price falls back to around 3380, participate in long orders and call, protect the position of 3374, and first look at the position of 3402, the high point on Monday;
②. After yesterday's high point breaks, wait for a correction to around 3395 to continue to participate in long orders and call, protect the position of 3388, and look at the key suppression level of 3420;
③. (Aggressive orders, for those who are afraid of missing out) If you are short or have enough positions, you can first participate in long orders with a light position at the current price of 3388, and wait for 3380 to increase your position, and the target is the same as above.
XAUUSDGold maintains a bullish outlook supported by ongoing global macro uncertainty, central bank demand, and expectations of lower real interest rates. As long as price holds above key support levels, the uptrend remains intact.
GOLD: Strong Bullish Sentiment! Long!
My dear friends,
Today we will analyse GOLD together☺️
The in-trend continuation seems likely as the current long-term trend appears to be strong, and price is holding above a key level of 3,392.264 So a bullish continuation seems plausible, targeting the next high. We should enter on confirmation, and place a stop-loss beyond the recent swing level.
❤️Sending you lots of Love and Hugs❤️

GOLD SELL POSITIONPrice have been correcting the last move down and now is showing a strong resistance at this level. expect price to move down in any news coming soon from US session.

XAUUSD M30 BEST SETUP FOR TODAY📉 Gold Analysis:
🔸 Gold is forming an M-pattern – a potential bearish setup.
➡️ We can look for a sell opportunity if we get a strong candle closing below the M-pattern structure.
📈 Buying Setup (Support Zone):
🔹 There's a strong buy zone at the bottom, marked by:
✅ Fair Value Gap (FVG)
✅ Order Block (OB) confirmation
🕵️♂️ Wait for clear price action confirmation before entering any trades.

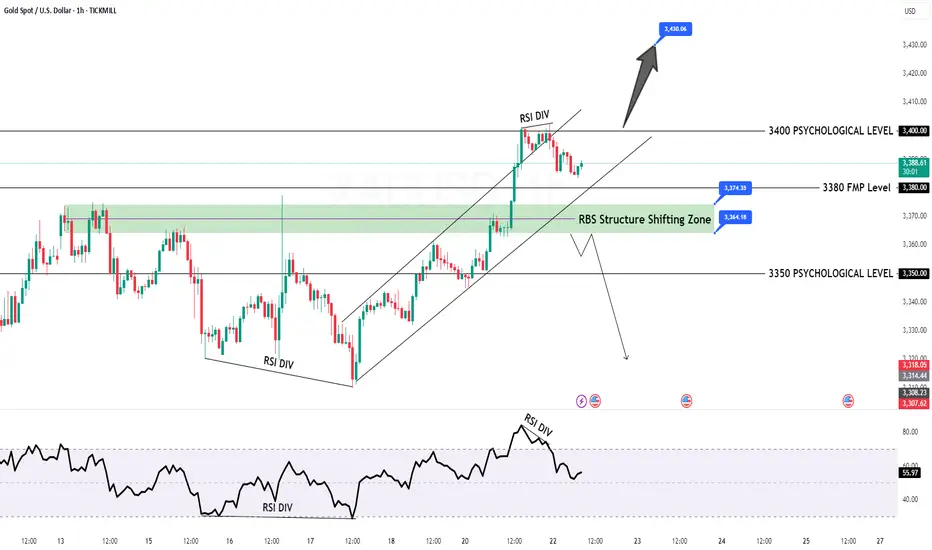
GOLD Intraday H1 Chart Update For 22 July 2025Hello Traders,
Today we have FED Chair Powell Speech ahead
all eyes on 3400 Psychological Level Break for now, if market successfully breaks 3400 then it will move towards 3435
below 3400 it will move back towards 3350 level
Disclaimer: Forex is Risky
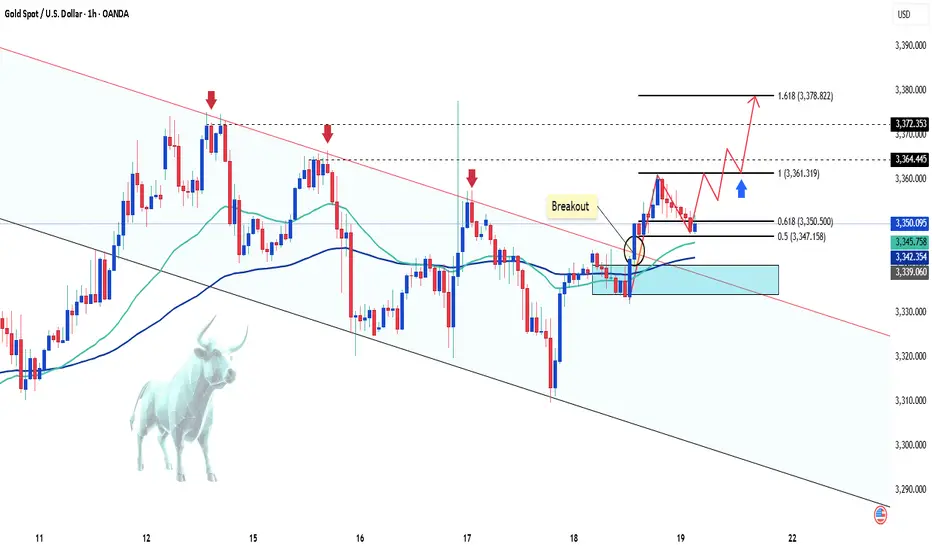
Gold Sees Mild Increase as USD WeakensGold ended Friday's session with a slight increase, regaining the 3350 USD level and recovering over 100 pips by the end of the day.
The weakening of the US Dollar (USD) allowed XAU/USD to rise modestly. Concerns about US President Donald Trump's erratic trade policies and their potential impact on the global economy further supported the precious metal.
In the short term, the technical chart shows gold breaking out of the downward channel and starting an upward wave. The price is currently adjusting at 3350 USD, which coincides with the 0.618 Fibonacci retracement level and the EMA zone, suggesting the potential for further price increases from this level, with targets towards key resistance levels.
Key resistance levels: 3160, 3172, and 3378 USD.
Support zones: 3350, 3340, 3331 USD.
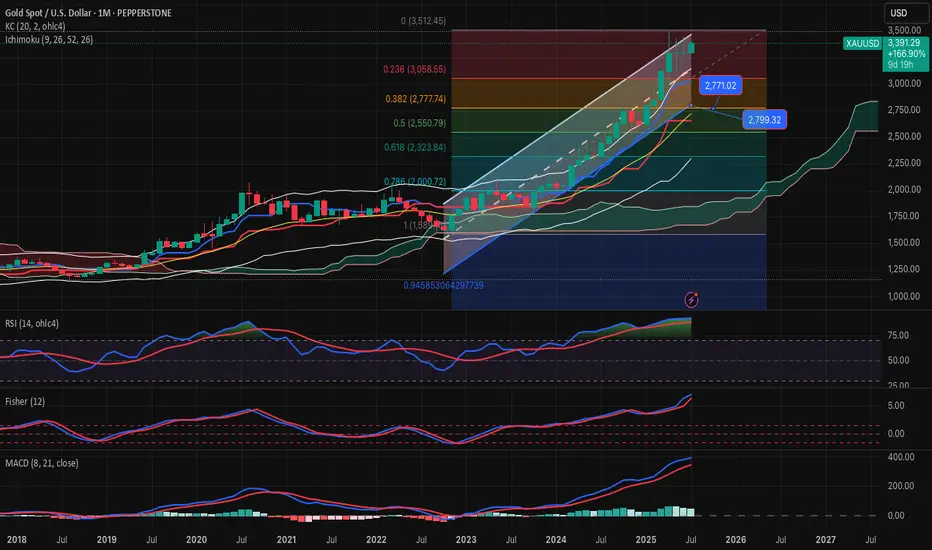
GOLD-SELL strategy Monthly chart Reg. ChannelGold is very overbought medium-term, and the danger is we may see a large decline. Same as I pointed out today on the shorter time-frame, we are in SELL mode, even though we have been moving higher. Crypto will lead the way.
Strategy SELL @ $ 3,385-3,450 and take profit near $ 2,845 for now.
XAUUSD Continues Bullish Structure With Key Retracement OpportunTechnical Outlook – 22/07/2025
On the 1-hour chart, XAUUSD is maintaining a clear bullish market structure with a sequence of higher highs and higher lows. The projected price path drawn on the chart suggests a potential retracement before a continuation toward the 3,420 USD region. Let’s break down the key technical zones and strategies for today:
Key Levels to Watch
Immediate Resistance: 3,390 – 3,400 USD
This is the recent high. A breakout above this area could trigger momentum toward the projected 3,420 USD extension.
Support Zone: 3,345 – 3,350 USD
This zone aligns with the potential pullback as illustrated on the chart, offering a high-probability buy-the-dip opportunity. It coincides with previous structure resistance now turned support.
Trendline Support: The ascending yellow trendline has been respected multiple times and should act as dynamic support on any intraday retracements.
Indicators & Tools Used
EMA: Price is currently trading above the short-term EMA (not shown), suggesting intraday bullish bias remains intact.
RSI (Recommended Use): Look for RSI near 40–50 on the pullback for confluence at support.
Fibonacci Tool (suggested): If measuring from the swing low near 3,320 to the high of 3,390, the 0.618 Fib lies close to 3,345 – an ideal area to look for long entries.
Suggested Trading Strategies
🔹 Buy the Dip Strategy:
Wait for a corrective move into the 3,345–3,350 area. Confirm with bullish reversal candles or RSI support, then enter long targeting 3,400–3,420. Stop-loss ideally below 3,335 (structure break).
🔹 Breakout Continuation Strategy:
If price breaks cleanly above 3,390 with volume, a momentum trade toward 3,410–3,420 is viable. Use tight trailing stops to protect gains.
🔹 Avoid chasing highs – Patience at support zones or confirmation above resistance will offer better reward/risk setups.
Conclusion
Gold is respecting bullish market behavior on the 1H chart, and while a short-term correction is expected, the broader trend favors upside continuation. The 3,345–3,350 area will be critical for today's trading decisions.
Remember to follow for more updates and strategy insights. Save this post if you find it useful.
If you’d like, I can also add a version using RSI or Fib levels directly plotted. Let me know.

XAUUSD
XAUUSD Updated in 15M :
The gold signal is marked on the chart based on the latest price changes and the supply and demand in the market. These points include the entry point, stop loss, and take profit.

GOLD DISTRIBUTION TYPEHello folks. its been a while I am posting. Been dealing with this idea last week.
wait for a rally to 3344, if it breaks above 3351 then we still waiting below our main Entry 3280-3289 zone. less stoploss below the friday low.
Trade it swing if we see monday rally. then wait our entry.
Goodluck and have fun trading,
If trading is a lifestyle this is it.
this is your lifestyle.
waiting here is boring.
thats why we need to be more patience.
xiaaaaooo.

XAUUSD Analysis – Smart Money Perspective XAUUSD Analysis – Smart Money Perspective
🧠 Market Structure & BOS (Break of Structure):
The chart clearly shows multiple Break of Structure (BOS), confirming bullish intent.
After the final BOS around 3,370, price aggressively broke above resistance, forming a new high at 3,397.
This indicates bullish market momentum backed by strong demand.
🔎 Key Zones Identified:
🔼 Strong Resistance (3,390 – 3,400 Zone)
This level has been tested and now shows potential exhaustion, possibly trapping late buyers.
Price currently rejecting this zone with a bearish reaction.
🔽 Support Zone (3,300 – 3,320)
Prior consolidation and BOS originate from here.
Strong bullish OB and demand lie here—key area for future long setups.
📉 Expected Short-Term Move:
The projection arrow indicates a potential retracement toward 3,360, a previous BOS + potential FVG area.
This aligns with Smart Money's tendency to rebalance inefficiencies before continuation.
🔺 Volume Analysis (VRVP - Volume Profile):
Notice how high volume nodes align with the support and resistance zones.
Price is currently sitting in a low-volume gap, supporting the idea of a retracement to a more balanced area.
⚡ Momentum Shift Signal:
The steep angle of the last move up suggests possible liquidity grab above resistance.
Expectation: Price may dip to mitigate demand or OB before resuming the uptrend.
✅ Conclusion:
This chart illustrates a textbook SMC scenario:
Bullish BOS confirms structure shift.
Liquidity sweep above resistance may lead to a retracement.
3,360 is a key price point to watch for FVG fills or bullish continuation.

XAU / USD 1 Hour ChartHello traders. Wow, what a push up for gold today. I have marked my current area of interest. Gold usually takes a few days to carve out it's potential paths for the week, so let's see if we continue up or start pushing down for a retest after such a move up. Big G gets a shout out. Be well and trade the trend. Happy Monday.

XAUUSD 5M DEMAND SETUPSpotted a clear 5M demand zone aligned with a bullish trend and previous higher highs. Noted a break of structure before the zone was tapped, with a fair value gap confirming the setup. Entered after a strong rejection and break of candle , targeting a 1:2 R:R. Trade hit take profit, ending the session with a solid result.

XU price touch the resistance level of the symmetrical triangle Price just approached the resistance level of symmetrical triangle that’s currently forming on the daily timeframe. We’re yet to ascertain the next possible direction of price from the daily timeframe but for the meantime, I’d expect a correction in price. Therefore I’d be expecting price to drop in correction of the already made impulse move

Gold (XAUUSD) Bullish SetupGold is maintaining its bullish momentum, with price action respecting key support levels. The chart highlights three target levels (TP1, TP2, TP3) marked with green lines, indicating potential zones for profit-taking as the uptrend progresses. A stop-loss is defined below the recent swing low, marked with a red line, to manage downside risk. This setup aligns with the prevailing trend and favors continuation traders.

SELL XAUUSDFirst scenario hit stop loss, I a still expecting price to dump very hard soon towards 3440. Patience is key here

Bullish Breakout Toward 3,436 TargetThis chart shows a technical analysis setup for XAUUSD (Gold Spot vs US Dollar) on the 1-hour timeframe using harmonic and pattern trading strategies. Here's a discretionary breakdown:
---
🔍 Pattern Identified:
A Bullish Gartley Pattern or potentially ABC-D Harmonic Pattern is forming:
Points X-A-B-C-D are labeled, with D just completed.
D point completion indicates a buy (long) opportunity, as the price reversed upward from point C to D.
---
📊 Current Market Action:
Price is currently at 3,386.770 (green candle).
A breakout from the potential neckline or resistance zone around the D point is observed.
There's a small bullish consolidation marked as “TR” (likely Trading Range or Temporary Resistance).
---
🎯 Target Projection:
The price target is labeled at 3,436.495, which is:
Based on the harmonic projection or previous swing high.
~+50 points above the current level (around +1.5%).
---
🧩 Support & Resistance Levels:
Immediate support: 3,360.125 (gray zone)
Next major support: 3,344.380 (lower red line)
Resistance/Target: 3,436.495 (red line/target zone)
---
📈 Discretionary Insight:
Bullish Bias: The pattern suggests a bullish reversal or continuation.
Breakout confirmation: If price holds above the D point and TR zone, it could accelerate to the target.
Risk consideration: Watch for potential pullbacks into the support zone near 3,360. A break below that could invalidate the setup.
---
✅ Potential Trading Plan (Discretionary):
Entry: Already triggered above the D point (confirmation breakout).
Stop Loss: Below C or below the gray support zone (around 3,344).
Target: 3,436.495
Risk-Reward Ratio: Appears favorable if stop is tight and target is reached.

The Dangers of Holding Onto Losing Positions...One of the most common — and costly — mistakes in trading is holding onto a losing position for too long. Whether it's driven by hope, ego, or fear, this behavior can damage your portfolio, drain your capital, and block future opportunities. Successful trading requires discipline, objectivity, and the willingness to accept when a trade isn’t working. Understanding the risks behind this behavior is essential to protecting your capital and evolving as a trader.
-- Why Traders Hold Onto Losing Trades --
It’s not always poor strategy or lack of experience that keeps traders locked in losing positions — it’s often psychology. Several cognitive biases are at play:
1. Loss Aversion
Loss aversion refers to our instinctive desire to avoid losses, often stronger than the desire to realize gains. Traders may hold onto a losing position simply to avoid the emotional pain of admitting the loss, hoping the market will eventually turn in their favor.
2. Overconfidence
When traders are overly confident in their analysis or trading thesis, they can become blind to changing market conditions. This conviction may cause them to ignore red flags and hold on out of sheer stubbornness or pride.
3. The Sunk Cost Fallacy
This is the belief that since you’ve already invested money, time, or effort into a trade, you need to keep going to “get your investment back.” The reality? Past investments are gone — and continuing the position often compounds the loss.
These mental traps can distort decision-making and trap traders in unproductive or damaging positions. Being aware of them is the first step toward better judgment.
-- The True Cost of Holding Losing Positions --
Holding onto a bad trade costs more than just the money it loses. It impacts your entire trading strategy and limits your growth. Here’s how:
1. Opportunity Cost
Capital tied up in a losing trade is capital that can’t be used elsewhere. If you keep $8,000 in a stock that’s fallen from $10,000 — hoping it rebounds — you're missing out on placing that money in higher-performing opportunities. Inactive capital is wasted capital.
2. Deeper Compounding Losses
A 20% loss doesn’t sound catastrophic until it becomes 30%… then 40%. The deeper the loss, the harder it becomes to break even. Holding out for a recovery often makes things worse — especially in markets with high volatility or downtrends.
3. Reduced Liquidity
Successful traders rely on flexibility. When your funds are tied up in a losing position, you limit your ability to respond to new opportunities. In fast-moving markets, this can be the difference between success and stagnation.
Recognizing these costs reframes the decision from “holding on until it turns around” to “preserving capital and maximizing potential.”
Consider this simple XAUUSD (Gold) weekly chart example. If you base a trading strategy solely on the Stochastic oscillator (or any single indicator) without backtesting and ignoring the overall trend, focusing solely on overbought signals for reversals, you'll quickly see the oscillator's frequent inaccuracies. This approach will likely lead to substantial and prolonged losses while waiting for a reversal that may never occur.
-- Signs It’s Time to Exit a Losing Trade --
The hardest part of trading isn’t opening a position — it’s closing a bad one. But if you know what to look for, you’ll know when it’s time to let go:
1. Emotional Attachment
If you find yourself feeling “married” to a trade, it’s a warning sign. Traders often assign meaning or identity to a position. But trading should be based on data and strategy, not sentiment.
2. Ignoring or Adjusting Your Stop Loss
Stop Loss orders exist for a reason: to protect your capital. If you habitually move your stop further to avoid triggering it, you’re letting hope override risk management.
3. Rationalizing Losses
Statements like “It’ll bounce back” or “This company always recovers” can signal denial. Hope is not a strategy. When you catch yourself justifying a bad position without objective reasoning, it’s time to reevaluate.
Consider also reading this article:
-- How to Cut Losses and Move Forward --
Cutting a loss isn’t a failure — it’s a skill. Here are proven techniques that help you exit with discipline and confidence:
1. Use Stop Losses — and Respect Them
Set a Stop Loss at the moment you enter a trade — and stick to it. It takes the emotion out of the exit and protects your downside. Moving the stop is the fastest path to deeper losses.
2. Trade With a Plan
Every trade should be part of a bigger strategy that includes risk tolerance, entry/exit points, and profit targets. If a position hits your predetermined loss threshold, exit. Trust your system.
3. Apply Position Sizing and Diversification
Never risk more than a small percentage of your capital on a single trade. Keep your portfolio diversified across different instruments or sectors to avoid one position derailing your progress.
4. Review and Reflect
Post-trade analysis is vital. Review both wins and losses to learn what worked — and what didn’t. This practice sharpens your strategy and builds emotional resilience over time.
-- Why Cutting Losses Strengthens Your Portfolio --
There’s long-term power in letting go. Here’s what cutting losses early can do for you:
1. Preserve Capital
The faster you cut a losing trade, the more capital you retain — and the more opportunities you can pursue. Capital preservation is the foundation of longevity in trading.
2. Reduce Emotional Stress
Sitting in a losing trade weighs heavily on your mindset. The stress can cloud your judgment, increase risk-taking, or cause hesitation. Exiting early reduces this emotional drag and keeps you clear-headed.
3. Reallocate to Better Setups
Exiting losing trades frees up both capital and mental energy for higher-probability opportunities. This proactive approach builds momentum and reinforces the idea that it’s okay to be wrong — as long as you act decisively.
Consider also reading this article:
-- Final Thoughts: Discipline Over Denial --
Holding onto losing trades may feel like you're showing patience or commitment — but in reality, it's often denial wrapped in hope. Trading is about probabilities, not guarantees. The most successful traders aren’t the ones who win every trade — they’re the ones who manage losses with discipline.
Letting go of a bad trade is a show of strength, not weakness. It’s a deliberate choice to protect your capital, stay agile, and refocus on trades that serve your goals. The market doesn’t owe you a comeback — but with a clear head and disciplined approach, you can always find your next opportunity.
✅ Please share your thoughts about this article in the comments section below and HIT LIKE if you appreciate my post. Don't forget to FOLLOW ME; you will help us a lot with this small contribution.
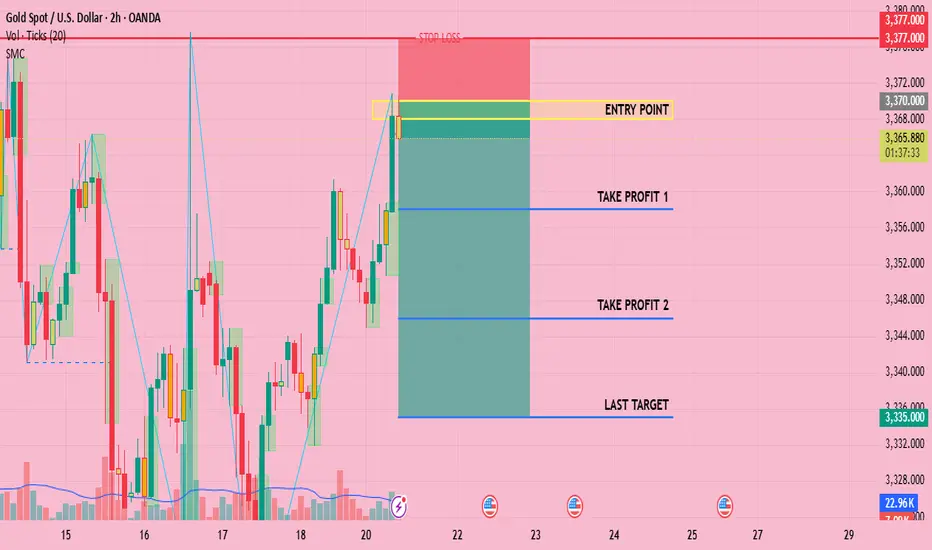
CHECK XAUUSD SIGNAL READ CAPTAINEntry Point: Around 3368 3370
Stop Loss: Around 3377.000
🎯 Target Levels
Take Profit 1:
3358.000
Take Profit 2:
3346.000
last target
3335.000