XAUUSD H4 Outlook – Full Structure & Macro | July 21, 2025Hello, GoldMinds! 💙
After a volatile week, gold remains caught in a wide H4 range, ping-ponging between structural supply and demand. Let’s break down the current picture so you can navigate the next big moves with confidence.
🌍 Macro & Bias
Macro context:
Last week’s US CPI print triggered a temporary rally, but gold failed to hold above resistance and quickly reversed as the dollar strengthened. Next week brings Fed Chair Powell’s testimony, global PMI numbers, and jobless claims—all catalysts for new volatility.
Bias:
Neutral on H4:
Gold is consolidating inside a broad sideways range.
The market is waiting for a catalyst to break above 3375 or below 3310 before showing a real trend.
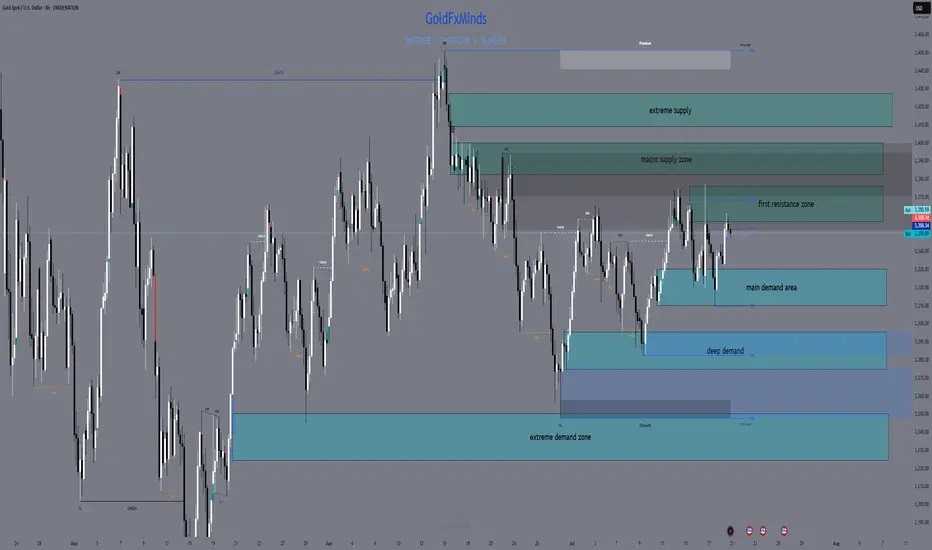
🔸 Structural Key Supply Zones (Above Price)
1️⃣ 3357–3375 | Main H4 Supply
Why it matters:
Aggressive NY and CPI rallies have been sold off here; price rejected every attempt to close above 3375. OB, liquidity cluster, inducement—this is the first real ceiling above price.
Trade logic:
Watch for M15/H1 reversal or exhaustion. No clean break = supply remains active.
2️⃣ 3384–3400 | Macro Supply
Why it matters:
All failed breakouts from early summer were stopped in this block. Liquidity pool and macro OB; every test led to sharp pullbacks.
Trade logic:
Avoid FOMO—only short with confirmation of rejection.
3️⃣ 3410–3425 | Extreme Supply
Why it matters:
The final upper ceiling for now. Any spike here is likely to see big profit-taking and volatility.
🔹 Structural Key Demand Zones (Below Price)
1️⃣ 3330–3310 | Main H4 Demand
Why it matters:
All major dips last week bounced here—bulls are active in this OB. It’s the base of the current “micro-range,” with clear LTF inducement and high volume.
Trade logic:
Look for bullish reversal (M15/H1) before trusting any long from here.
2️⃣ 3295–3275 | Swing Demand / Discount Zone
Why it matters:
The main structure support for July. Strong OB, historic liquidity sweeps—each deep flush has brought responsive buyers.
Trade logic:
Watch for reaction, but don’t knife-catch without a clear structure break.
3️⃣ 3250–3225 | Extreme Demand / HTF Liquidity Pool
Why it matters:
The “final line” for bulls. This zone has absorbed all major liquidations and created swing reversals since early spring.
📊 H4 Structure Logic
Current play:
Gold is stuck in a structural cage between 3375 and 3310.
Until price closes outside these edges, every spike is likely a liquidity hunt.
Pro move:
Only react to confirmation in these zones—don’t force trades in the mid-range!
🧠 Game Plan
Set alerts at each supply & demand zone.
Wait for confirmation: M15/H1 CHoCH, BOS, wicks, or volume.
Let the news come to you: Powell & PMI will likely force a test of an edge; be patient.
💬 What’s your bias for the week? Drop it below and tag a friend!
🚀🚀🚀 and Follow GoldFxMinds for sniper-level gold planning and deep-dive SMC education.
Posted using the Trade Nation broker feed as part of their influencer program for using their TradingView charts in educational content.
— GoldFxMinds 💙
XAUUSDK trade ideas
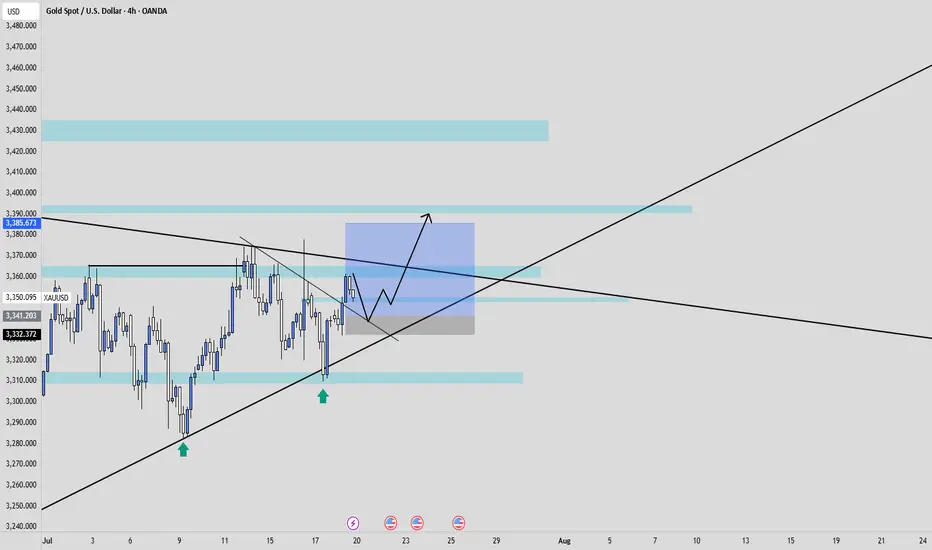
XAUUSD potential scenarioTake away points :
- XAUUSD has been in a good uptrend for the last couple of months, mainly driven by Central banks demand for Gold.
- We had a break of structure to the upside on the left followed by a trendline bullish break, which indicate strength to the upside.
- Price is currently retesting a minor H4 zone, monitor this area for bearish exhaustion and wait for bullish candlestick formation.
Here is my trade idea, it's not a financial advice, just for entertainment purpose.
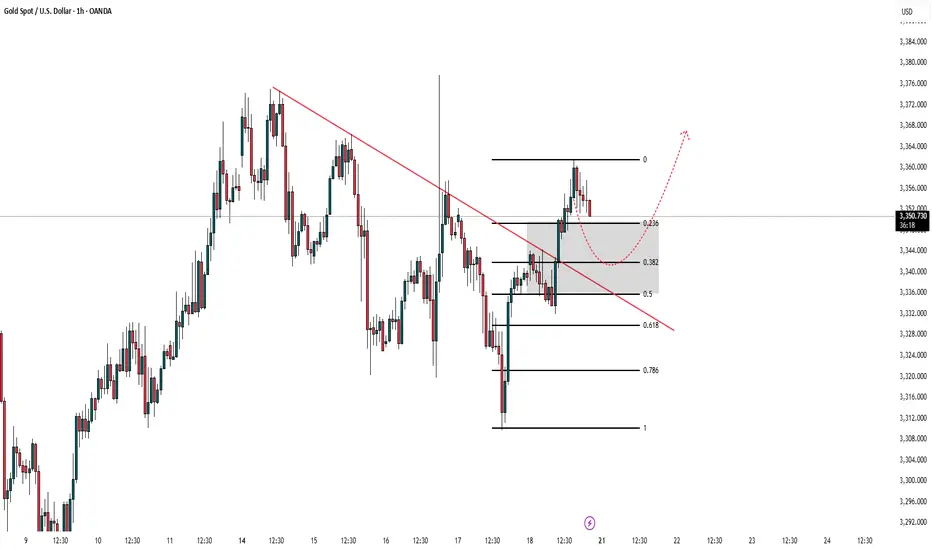
xau next week mapDear all traders wish you bests and hope you were profitable.
clear breakout happend from trend line.
expect a retracement as it has strong movement i think 23.6 would be enough
then you can search for a buy levels in lower timeframe like 15min
if wanted to trade sell we have to find clear structure and good momentum in 1 min or 5min
keep your risk management stay in market
good weeknd "ITS JUST GOOD BUSINESS"
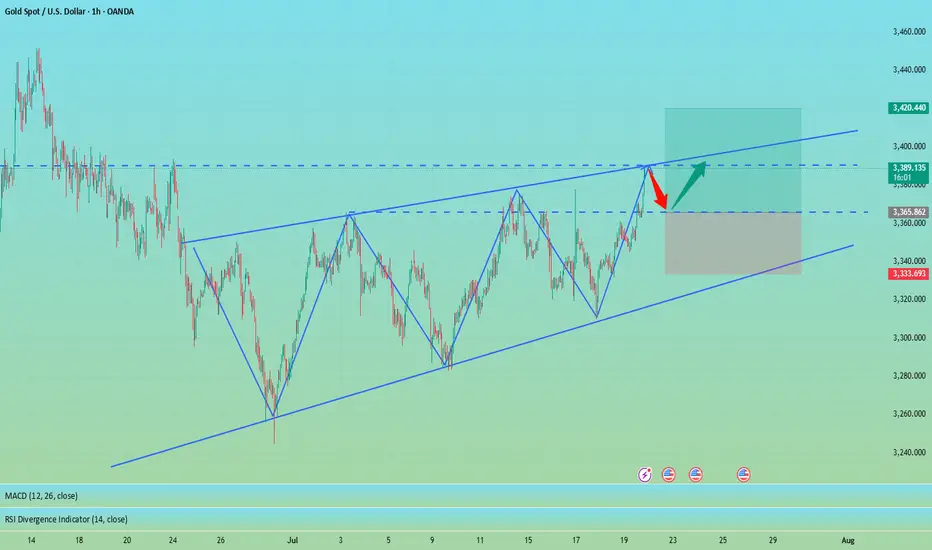
Gold Roadmap: Next Stop $3,325 After Ascending Channel Break?Gold ( OANDA:XAUUSD ) failed to touch the Potential Reversal Zone(PRZ) in the previous idea , and I took the position at $3,351 = Risk-free.
Gold is moving in the Resistance zone($3,366-$3,394) and has managed to break the lower line of the ascending channel .
In terms of Elliott Wave theory , with the break of the lower line of the ascending channel, it seems that gold has completed the Zigzag correction(ABC/5-3-5) .
I expect Gold to trend downward in the coming hours and succeed in breaking the Support zone($3,350-$3,325) and attacking the Support line again , and probably succeeding in breaking this line this time.
Note: Stop Loss (SL) = $3,396
Gold Analyze (XAUUSD), 1-hour time frame.
Be sure to follow the updated ideas.
Do not forget to put a Stop loss for your positions (For every position you want to open).
Please follow your strategy; this is just my idea, and I will gladly see your ideas in this post.
Please do not forget the ✅ ' like ' ✅ button 🙏😊 & Share it with your friends; thanks, and Trade safe.

Monday market forecast, pay attention to the 3339 retracement📰 News information:
1. The Trump administration puts pressure on the Federal Reserve to cut interest rates
2. The continued impact of tariffs and the responses of various countries
📈 Technical Analysis:
This week's basic judgment and forecast on the gold market trend were consistent, but on Friday, the overall gold fluctuations were not large. The overall trend of the daily line fluctuated around 3345, and the 3345 line also became a short-term long-short watershed. Although prices are likely to rise more easily than fall in the short term, it should be noted that the three-month adjustment cycle is coming to an end while the fundamentals of the bull market have not changed. It is recommended that you focus on preventing risks from short position operations next week. At the same time, the overall strong shock pattern, the anti-pulling momentum has not reached the top suppression position, and the area around 3339 below is the previous intensive trading area, which constitutes a certain support in the short term. If the market fails to effectively break below next week, it will greatly boost the bullish momentum, and it is not ruled out that there will be a possibility of refreshing the high point near 3380 next week.
On the whole, the short-term focus next week is the 3345-3335 area below. If it falls back to this point, you can consider arranging long orders. The short-term target is 3355-3365, and the strong trend is expected to continue to touch 3375-3385.
🎯 Trading Points:
BUY 3345-3335
TP 3355-3365-3375-3385
In addition to investment, life also includes poetry, distant places, and Allen. Facing the market is actually facing yourself, correcting your shortcomings, confronting your mistakes, and strictly disciplining yourself. I hope my analysis can help you🌐.
TVC:GOLD PEPPERSTONE:XAUUSD FOREXCOM:XAUUSD FX:XAUUSD OANDA:XAUUSD FXOPEN:XAUUSD

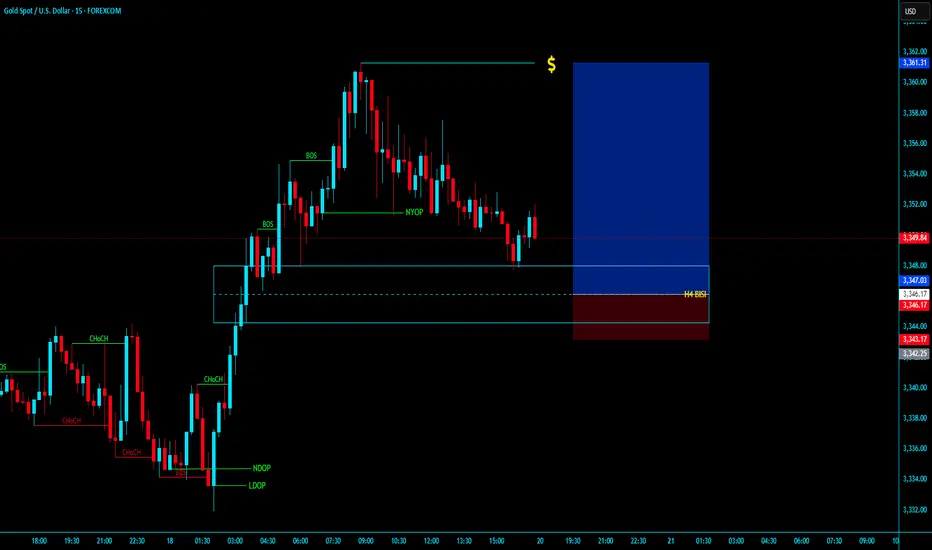
XAUUSD H4 BISI BUY LONGXAUUSD H4 BISI BUY LONG
- Market bearish to Bullesh market is in h4 BISI .
- In LTF after valid MSS with vslid OBI / LTF BISI then entry with Tight SL and Long TP
---- KGB PRIYABRTA BEHERA -----
ICT Trader & Advance Mapping SMC Trader
GOLDGOLD needs some more upside, reaction zone is 3380-3395, will see how gold reacts at that level.
Disclosure: We are part of Trade Nation's Influencer program and receive a monthly fee for using their TradingView charts in our analysis.

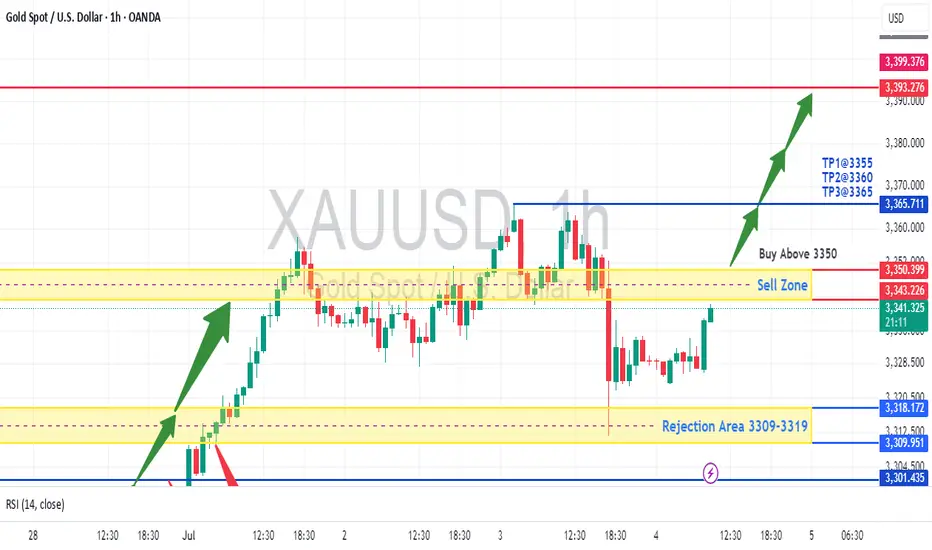
XAUUSD - Retesting 3400 before DeclineThe chart shows a potential buy setup for gold (XAUUSD) with the following key points:
Price Action: Gold is trading at 3,341.465, above the suggested "Buy Above 3350" level, indicating a bullish bias.
Support/Resistance: The rejection area at 3309-3319 held as support, and price has moved higher, confirming buyer interest.
Take Profit Levels: TP1 (3355), TP2 (3360), and TP3 (3365) provide clear upside targets.
RSI Confirmation: The RSI (14) at 54.21 shows moderate bullish momentum without being overbought.
Volume & Close: The slight increase in price (+0.09%) with supportive volume suggests accumulation.
Trade Idea: Enter long above 3350 with stops below 3309, targeting TP1-TP3. The rejection zone and RSI support further upside.
Disclaimer: This is not financial advice. Please consult with a financial advisor before making any investment decisions. We are not responsible for your loss because we are not SEBI registered and this analysis based on technical aspects and only for educational practice. Do your own research.
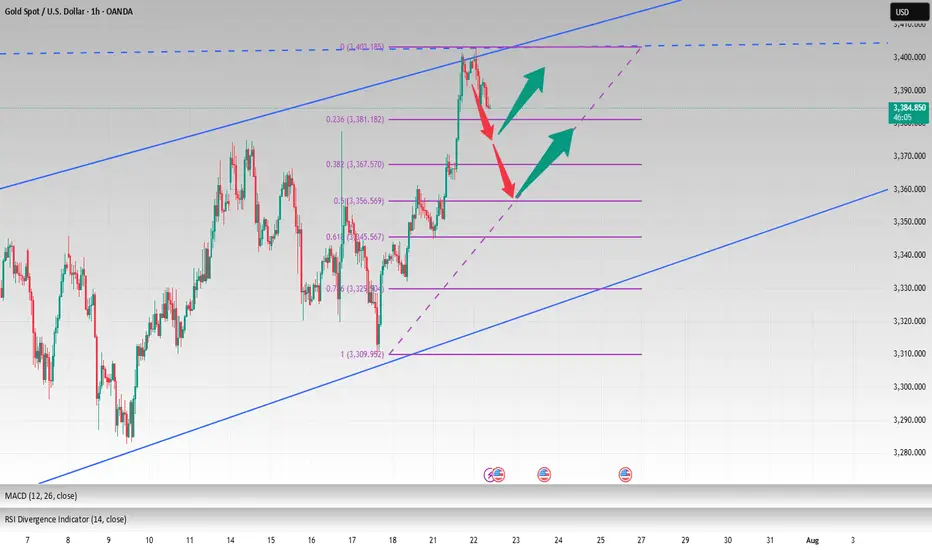
3400 has been reached, wait patiently for a pullback to go longGold opened on Monday with a volatile rise. After breaking through the 3360-65 area, the bulls turned strong. After breaking through the 3375~80 area in the evening, the bulls accelerated their rise, reaching the highest point of 3402. It fluctuated sideways in the late trading, and the daily line closed at around 3397 with a big positive line! Gold temporarily broke the small range oscillation pattern, but the bulls were not strong, and it still fluctuated upward.
From the perspective of the intraday cycle, after yesterday's rapid rise, the market fell into a serious overbought state; however, yesterday's $60 big positive line supported the bulls, and it is expected that the market will fluctuate; the next focus is still the 3400 mark area. The pressure in the 3400~05 area was dense last night, and adjustments may be made at any time before the breakthrough; and since the rise of 3282, it has just touched the upper edge of the parallel channel. The big sweep will continue, but the range is constantly changing!
So although gold broke the recent volatility yesterday and hit the 3400 mark with a big positive line; however, if it cannot stand above it, then it will continue to fall; recently we have repeatedly and many times emphasized the importance of the 3400 mark. If it stands here, the market will gradually rise to 3420~25 and break through to the 3450 area before looking for a decline.
Today we will continue to focus on the 3400 mark area. First, we will rush to the high altitude, with the goal of retracement to the 3375 and 3356 regional support platforms, and then pay attention to long opportunities; if the bulls stand above the 3400 mark, they will further bullishly impact 3420~25 and break through the 3450 area before falling back.
OANDA:XAUUSD
XAUUSD - Falling Wedge Parallel ChannelGold Volatility being more. Banks increasing the gold inventories, may surge to new highs. Sharing Some idea it may go either way some big rally or big correction.
This chart is only for educational purpose, Do your own study before taking any trades
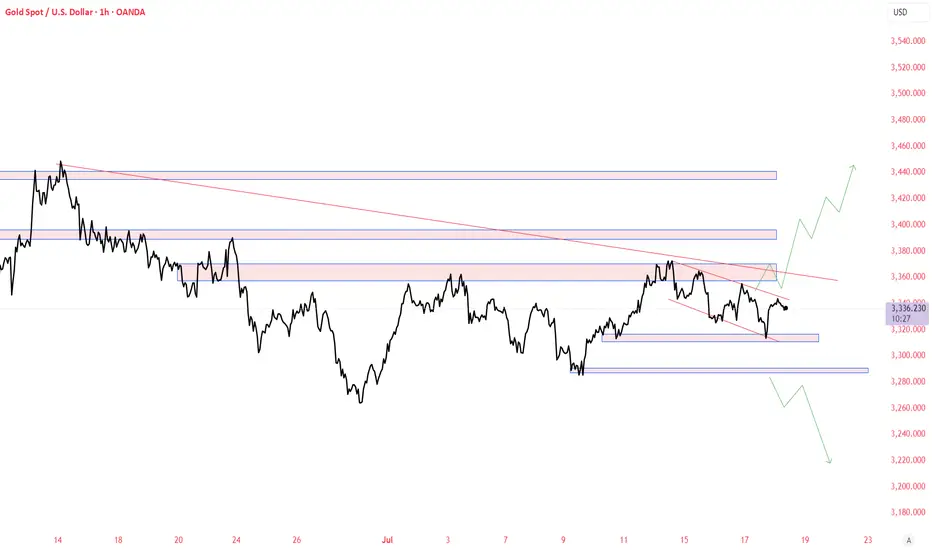
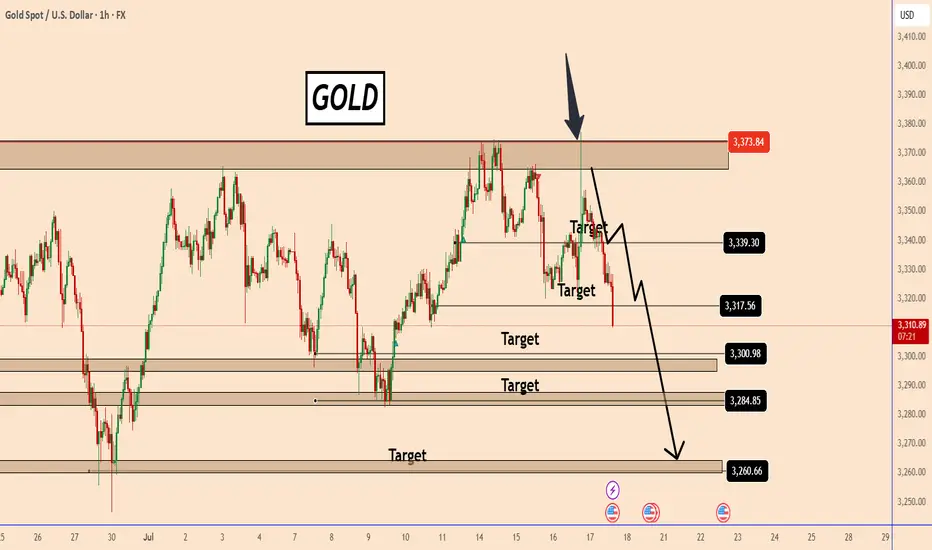
Gold 1H Intra-Day Chart 22.07.2025Option 1: Gold rejects from CMP & drops towards $3,260.
Option 2: Gold buyers hold around $3,260 and push price back up.
Which scenario do you find more likely?

GOLD: Continues to respect our bearish scenarioGOLD: Continues to respect our bearish scenario
Yesterday we had a bad joke from Trump and the price tested again a very strong resistance area located near 3378.
As you can see from the chart, the sell-off happened quickly and was just a sell-off in a deep pullback.
Today, the price was struggling to find a clear direction, but after Trump said he had no plans to fire the Federal Reserve's Powell, the market calmed down easily.
The price fell from another strong support area earlier today after the US printed strong Retail Sales data for June of 0.6% versus an estimate of 0.1%.
The chances of further declines, as I explained earlier, are increasing further and it could even reach 3260, it seems.
You may find more details in the chart!
Thank you and Good Luck!
PS: Please support with a like or comment if you find this analysis useful for your trading day
Gold Hits Five-Week High as Trade Tensions MountGold reversed early losses to rise above $3,420 per ounce, hitting its highest level since June 16, as US Treasury yields and the dollar continued to weaken amid persistent uncertainty over trade negotiations.

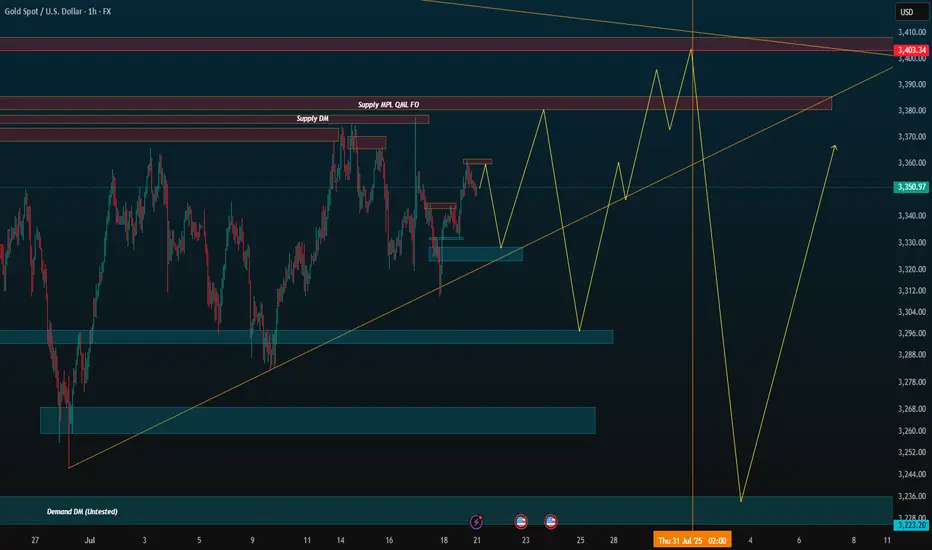
XAUUSD critical area, both sides are possiblecorrection waves are always complicated and messy often changes direction too often, goes up and down in a wide range either triangle, wedge or some sort of zigzag, internal waves usually goes as abc, wxy, wxyxz type of correction waves and it may seem like ended many times in the subwaves. so often confused with many other ideas. i believe correction continues yet criticals levles to watch 3307-3419 brake side will determen the future of gold.
my 3250 target already achieved but i expect another one, shor term targets 3250-3205 mid term targets 3119-3070-3050
daily candle body above 3420 invalidates short ideas.

Don't chase the bullish trend,wait for the short position layout#XAUUSD
The tariff policy recently announced by the US government is undoubtedly the focus of the current gold market. Trump also tied the tariffs to the trial of former Brazilian President Jair Bolsonaro, adding to policy uncertainty. ⚖️
The implementation of the tariff policy may push up commodity prices, thereby exacerbating inflationary pressure, which is both an opportunity and a challenge for gold📊. On the one hand, rising inflation expectations may enhance the attractiveness of gold as an anti-inflation asset; on the other hand, the strengthening of the US dollar and US Treasury yields may offset this positive. 💡
At present, the lower support has moved up to the 3375-3365 area, where a top-bottom conversion position will be formed. The upper short-term resistance level is 3387-3393, the previous high. If the market touches this for the first time, you can try to see a double top fall.
🚀SELL 3385-3390
🚀TP 3365-3355
Pure Speculation Mode (FOMC + NFP)This is just pure speculation projection I made. Just ignore, I wanna save this and compare before and after next month.