Sartorius: When Opportunities Are Hidden in Lower TimeframesSartorius: When Opportunities Are Hidden in Lower Timeframes
Sartorius is a German company that has delivered an astonishing 30,000% return since 2008.
Yes, you read that right, investing €10,000 back in 2008 would have turned into €3,000,000 by 2021 , thanks in part to a final surge fueled by the COVID-19 boom.
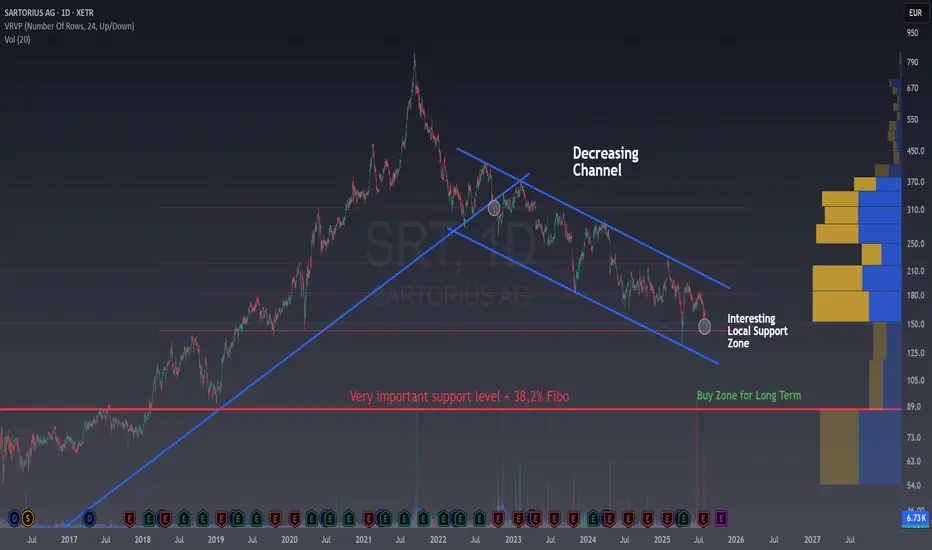
Looking at the long-term weekly chart, we can clearly see a major trendline that was broken, sending the stock into a prolonged downtrend. So far, Sartorius has dropped 80% from its peak, and there might still be room for further declines before reaching key support areas, such as the 38.2% Fibonacci retracement and the pre-COVID highs.
Are we witnessing the last leg down before a major reversal? Or is there more pain to come?
Bounce at Key Local Support — Short-Term Opportunity
Right now, the price is bouncing off a very interesting local support, the same area that previously created a sharp V-shaped bottom . This pattern suggests buyers are stepping in aggressively, seeing these levels as a bargain .
Revisiting this area gives us a potential long entry .
It’s true we could aim for the upper boundary of the current channel for a +30% gain, but placing the stop loss would be tricky, it would need to be relatively wide and against the prevailing trend, which I’m not a fan of.
In situations like this, I zoom into lower timeframes to see if a more precise, short-term setup makes sense.
In this case, we can see that, in the very short term, the price has formed a base and broken above a resistance today. That breakout opens the door for a long trade aiming for a +3.5% return in 2–3 days , with a tight stop loss that still gives plenty of room for price action to breathe.
Based on my analysis of similar historical patterns, the odds of success are over 70%. With probability and risk/reward on our side, let’s go for it!
By first studying the higher timeframe trend and then zooming into the lower timeframes , traders can identify short-term opportunities that align with the broader market direction.
This alignment increases the probability of success, as trades are placed in harmony with the stock’s long-term momentum rather than against it.
💬 Does this setup align with your view on XETR:SRT ?
🚀 Hit the rocket if this helped you spot the opportunity and follow for more easy, educational trade ideas!
SRT trade ideas
SRT3 on XETR. BUY.The uptrend is strong, price is close to some Supply but it is not fresh and not quite there yet. This is a great Demand level. Can consider holding it through the high at 371 as well.

Sartorius: Target 180 Euro?After subsequent negative news, we see again a important floor broken and a falling knife movement. There are two different patterns indicating a move towards 180 or into a side movement corridor between 168 and 196 which is again 15 to 30% downwards potential. It's an ABC pattern (not a perfect one) as well as the side range which includes a local double top. The side range/ideal target of this is nearly the same as the ABC target: Approx. 182 Euro.

Sartorius AG LONG Signal createdLooking on this weekly chart:
Price broke the triangle pattern to the upside
Price is over all moving averages
Looking at the last 10 years: Sartorius has a bullish seasonality until summer
Good trades, folks!

Short-term profit targetOn Friday TecDax favorite Sartorius AG underwent a fail breakout. So I will follow the short consolidation up to the FIB level representing the lower line of the symmetrical triangle. I assume that strong resistance may likely hold a third time, so that risk for loss is acceptable.
To cover the trade, I used a put KO 1.31% warrant with a leverage of 7.
