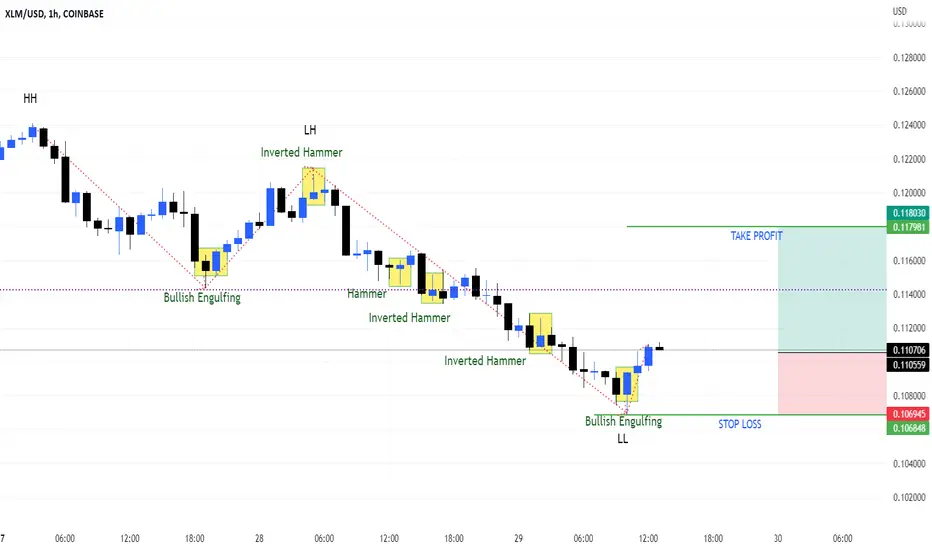
LONG - XLMUSD - 1HPAIR:- XLMUSD
INSTRUMENT:- CRYPTO
POSITION:- Long
STRATEGY:- Dow Theory + Candlestick Pattern
REASON:-
* Multiple hammers + engulfing
* Bearish candles getting smaller and smaller (momentum loss)
* Bulls are starting to step with 3 consecutive bullish candles, trying to catch from the bottom and ride the uptrend wave
Entry @ CMP
Take Profit @ 0.117981
Stop loss @ 0.106564
Risk to Reward:- 2:1
XLMUSD.P trade ideas
XLM TO $0.03 (£0.025)- XLM is in a downtrend as you can see.
- It will most likely reach £0.025
- The first target where I will personally take some small profits is at the 4.618 level at $4 (£3.30) - 132 X RETURN
- MY second target would be around $30 (£24) - 960 x RETURN
- So if you was to invest £1,000 at £0.025 you could turn that into £132,000
- If you was to invest £1,000 at £0.0.25 you could turn that into £960,000 this could take around 5-8 years!
- NOT FINANCIAL ADVICE!!!

ARIASWAVE - XLM STELLAR LUMENS - PRICE ACTION UPDATEIn this update I highlight how XLM has been taking a very clear path towards the target to complete the final 5-Wave Move to the downside.
So far nothing suggests that XLM will continue to plummet after this move is over but rather it should begin to form a base in the coming days and weeks.
Once we complete the move it is my assertion that we see a move back up above where this pattern began in order to confirm that the whole correction is over.
Don't be surprised if the broader markets also start to see signs of life.
Remember to use Disciplined Money Management Principles to ensure longevity as a trader.
If you don't know the long term pattern shouldn't you be doing your research instead of just following the crowd?
Just remember: I am not a financial adviser, I suggest using this only as a guide. Always do your own research.

Interesting setup for StellarHere's an interesting setup for Stellar if it plays out. I don't expect this to work out given the headwinds all markets are seeing right now, but if stellar holds this line as support, it would potentially mean a big swing to the upside (7X back to the top). Invalidated if it breaks below.

Stellar will shock you - Play your setup right Stellar is getting ready for bullish strike - play your setup right , or market setup will outplay you
Beginners, dont underestimate the power of risk management - learn it

ARIASWAVE - XLM STELLAR LUMENS - PRICE ACTION UPDATEIn this video I cover the latest price action update for XLM Stellar - Lumens.
This Wave E is moving slow which indicates that the bear market has already weakened substantially.
To be honest not much has changed which is why I have delayed this update until now.
If you do not have a relatively accurate way of observing price action then chances are that you spend
a significant potion of your valuable time trying to figure out what is happening.
Nothing could be more painful than observing such negativity in the media and trying to find a good entry point.
That is exactly why I ignore everything I read and hear from the mainstream media that relates to the economy.
Treat the media as entertainment because that is all it is good for, if that.
My goal is to help you understand what is happening using ARIASWAVE.
Once we start this new bull market I believe it will become clear how effective this methodology really is.
Me myself I am just dollar cost averaging into this because it's likely that we will never see these prices again.
Remember to use Disciplined Money Management Principles to ensure longevity as a trader.
If you don't know the long term pattern shouldn't you be doing your research instead of just following the crowd?
Just remember: I am not a financial adviser, I suggest using this only as a guide. Always do your own research.

XLM chart showing time to accumulate XLM has a lot of potential down the road we have a similar structure that is taking place that occurred in 2018-2020. Info in chart, this alignment would be perfect for the iso launch in November 2022

XLMUSD - 1W - Wait for the end of this falling wedgeHi guys,
on the weelky timeframe we can notice Stellar (XLM) is in a giant falling wedge pattern. This is usually a pattern leading to an upside move.
We can't ignore the red path as bitcoin and macro are not at their best at the moment. Bitcoin still on the edge of further downside.
However, if things can get better for crypto, we can imagine (and pray) for the green path.
then first target would be the 0,47$ (strong resistance and ichimoku level on the monthly / daily)
then second target is the top of the falling wedge which is also the previous ATH (weekly close) at 0,70$.
This could form a giant cup and handle. If and only if we have a strong break to the upside with a strong candle close :)
if this cup and handle is confirmed the targets will be awesome.
But dont get excited too quickly there are still many targets to achieve first.
If you agree, please feel free to like this idea :)
Bye guys
NFA

ARIASWAVE - XLM STELLAR LUMENS - PRICE ACTION UPDATEIn this quick update I go over the latest XLM STELLAR LUMENS ARIASWAVE count for what could possibly be that last wave in this entire correction since May 2021.
This is in line with the count in the Euro Dollar chart video which I recently posted.
This is also in line with the long term count for the Dow Jones.
The bears are quickly running out of steam and this whole thing could change direction very quickly.
If these counts are accurate then we could possibly be about see huge reversals take place within the coming days and weeks.
A lot of the fraudulent BS crypto projects have already been flushed out and exposed as phony.
It is time for the phoenix to rise out of the ashes.
All time highs will be obliterated in the coming bull run but make sure you make informed decisions along the way.
Remember to use Disciplined Money Management Principles to ensure longevity as a trader.
If you don't know the long term pattern shouldn't you be doing your research instead of just following the crowd?
Just remember: I am not a financial adviser, I suggest using this only as a guide. Always do your own research.

xlmusdtthe federal reserve has admitted they are falling behind on cbdcs and have also admitted that a central bank digital currency could help maintain the dollar international standing at this point they have two options, either they start from scrath and be behing a decade. or start on already up an running tech its either XRP or XLM that they will need to choose. for me xrp is far ahead of xlm but the dam lawsuit its holding it back. so might want to have both coins at this point, , accumulation looks rock solid on alot of top coins. this blockchain tech is no joke some will take off big some will vanish so you want to pick the top coin on every category, nfts, de fi, metaverse,..

XLMI wonder if this is how the story goes…. Just going to leave this right for now and come back to it Feb 2023

XLMThe price broke through the 50% fibo level and fell to the downtrend line. The 61.8% fibo level and POC are strong support levels. If they are broken, the price will fall to the level of 78.6% fibo

XLMUSD: Double BottomXLM could see a 50% rally up to a previous support level where it might then test it as new resistance if the rally proves weak. One may want to wait until after the FOMC before putting full size on this trade just incase there is any negative volatility during the meeting.

XLMUSD ❕ Stellar above the liquidity zoneStellar broke above the liquidity zone.
The 50MA broke up the 100MA on the 30m Timeframe.
XLM has fixed above the 100MA on the 30m Timeframe.
I expect the coin to break out of the downward channel in the near future, and if it fixes above the resistance level, the price may continue to rise.

ARIASWAVE - XLM STELLAR LUMENS - PRICE ACTION UPDATEThe previous count was invalidated but it doesn't really change much given what is happening in the stock market.
Bitcoin and Ethereum are taking a beating by comparison but then again they haven't been correcting since May 2021 like other coins.
It's their turn to correct.
I still maintain my long-term bullish view because I still believe that March 2020 was the start of a mega bull trend that will last years.
I shall keep dollar cost averaging into this throughout this whole period and I will be bullish until the trend is no longer my friend.
Remember to use Disciplined Money Management Principles to ensure longevity as a trader.
If you don't know the long term pattern shouldn't you be doing your research instead of just following the crowd?
Just remember: I am not a financial adviser, I suggest using this only as a guide. Always do your own research.

Stellar (XLM)- June 14hello?
Traders, welcome.
If you "follow", you can always get new information quickly.
Please also click "Like".
Have a good day.
-------------------------------------
(XLMUSD 1W Chart)
Below 0.124080 is likely to be a mid- to long-term investment area.
Therefore, the key issue is whether it can rise above 0.124080 to receive support.
(1D chart)
In the short-term and medium-term perspective, it needs to rise above the 0.124080-0.132063 section and find support to turn into an uptrend.
However, since a volume profile section is formed around 0.164204, it can be said that it is completely converted to an upward trend only when it rises above this point.
------------------------------------------------------------ -----------------------------------------------------
** All indicators are lagging indicators.
Therefore, it is important to be aware that the indicator will move accordingly as price and volume move.
However, for convenience, we are talking in reverse for the interpretation of the indicator.
** The MRHAB-T indicator used in the chart is an indicator of our channel that has not been released yet.
** The OBV indicator was re-created by applying a formula to the DepthHouse Trading indicator, an indicator disclosed by oh92. (Thanks for this.)
** Support or resistance is based on the closing price of the 1D chart.
** All descriptions are for reference only and do not guarantee a profit or loss in investment.
(Short-term Stop Loss can be said to be a point where profit and loss can be preserved or additional entry can be made through split trading. It is a short-term investment perspective.)
---------------------------------

ARIASWAVE - XLM STELLAR LUMENS - PRICE ACTION UPDATEIn this XLM price action update I now revert the count to another common pattern which is called a Type-1 Weak 5-Wave Move.
I still believe this is going much higher however the first leg up will likely take a little longer due to extreme bearish sentiment plaquing the markets lately.
These fractal patterns can change in their appearance but still point to one potential outcome.
At these prices it would be wise to accumulate because we may never see them this low again.
Always focus on the bigger picture.
These small degree moves just allow me to practice wave identification using AriasWave.
Check out the previous related ideas below.
Remember to use Disciplined Money Management Principles to ensure longevity as a trader.
If you don't know the long term pattern shouldn't you be doing your research instead of just following the crowd?
Just remember: I am not a financial adviser, I suggest using this only as a guide. Always do your own research.

ARIASWAVE - XLM STELLAR LUMENS - PRICE ACTION UPDATEIn this video we will be discussing what happened a couple of hours ago on the STRUSDT chart.
I think it is interesting to see these types of moves happen especially when they line up with the waves.
The only thing that is strange is that it didn't happen on the XLMUSD chart but still gives us a taste of what's ahead.
Now that things are getting interesting is when I start to increase the frequency of my updates.
Whatever is coming will be extreme and will likely catch a lot of people off guard.
Especially those that have already lost money in this bear market.
Market sentiment is roughly at the same level as it was in March 2020.
You make up your mind, what do you think will happen next?
Remember to use Disciplined Money Management Principles to ensure longevity as a trader.
If you don't know the long term pattern shouldn't you be doing your research instead of just following the crowd?
Just remember: I am not a financial adviser, I suggest using this only as a guide. Always do your own research.

Subsequent downtrend continues...For the upcoming inflation report, a further drop in the cryptocurrency may well be...

Stellar Lumens XLM Is Using The Support Of Previous TriangleHi friends, and welcome to the new update on Stellar.
Big wedge and key support:
On a weekly time frame, XLM has bounced from the key support of $0.12 and the support of a big falling wedge pattern. This move can also be seen on a monthly time frame.
After breaking out this wedge the next move can be up to $0.75, which is the top of this wedge. Before this XLM had already broken out a big channel as well.
Symmetrical triangle and external supports:
On a 4-hr time frame, Stellar has broken down a symmetrical triangle. But it has still a down trendline support and the previous triangle's support is also still in play. Therefore,
there is a probability, that XLM will breakout the resistance of the triangle using these supports. After the breakout XLM can also break out the next resistance of $0.154.
Conclusion:
Even though Stellar has broken down the triangle but some external supports are in play therefore, there is a possibility that stellar will breakout the same triangle whcih is broken down.

ARIASWAVE - XLM STELLAR LUMENS - PRICE ACTION UPDATETake a look at these waves happening at the small degree.
Once you do I will explain what each one means according to ARIASWAVE.
If you do not understand what each wave means then it just makes things harder.
It makes it harder to feel confident about what you are invested in.
It also makes it very difficult to get a feel for the larger pattern in progress.
That's right, markets are not random.
They are the sum of the whole representing predictable human psychology.
Remember to use Disciplined Money Management Principles to ensure longevity as a trader.
If you don't know the long term pattern shouldn't you be doing your research instead of just following the crowd?
Just remember: I am not a financial adviser, I suggest using this only as a guide. Always do your own research.

XLM 20% pump incoming, double bottom, hidden bullish divergenceXLM/USD current price $0.1467 cents, Short term bullish, Possible long trade.
Bullish divergence on RSI Daily chart. Dates Jan 22, 2022, May 12, 2022
XLM holding $0.12 cents with double bottom on the daily confirmed.
Next possible support price is $0.14 cents.
Stop loss at $0.1390 cents
Long trade possibility, buy zone $0.14 cents to $0.15 cents.
Sell target (1)
$0.1595
Sell target (2)
$0.1670
Sell target (3)
$0.1738
COINBASE:XLMUSD

XLMUSD (4H) Bullish BreakoutHi Traders
XLMUSD (4H Timeframe)
The market is in an uptrend and we are waiting for an entry signal to go LONG above the 0.154 resistance level. Only the downward break of 0.133 would cancel the bullish scenario.
Trade details
Entry: 0.154
Stop loss: 0.133
Take profit 1: 0.167
Take profit 2: 0.188
Score: 4
Strategy: Bullish Breakout
