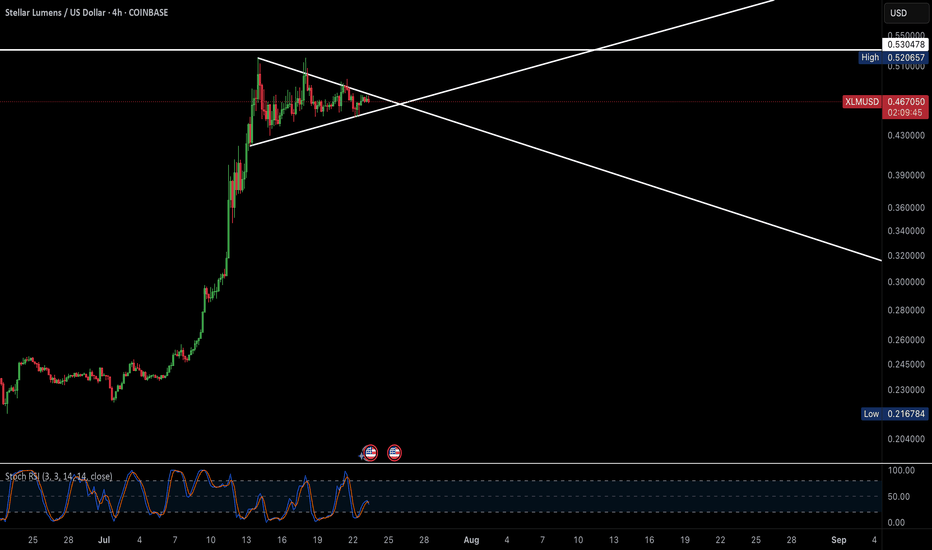
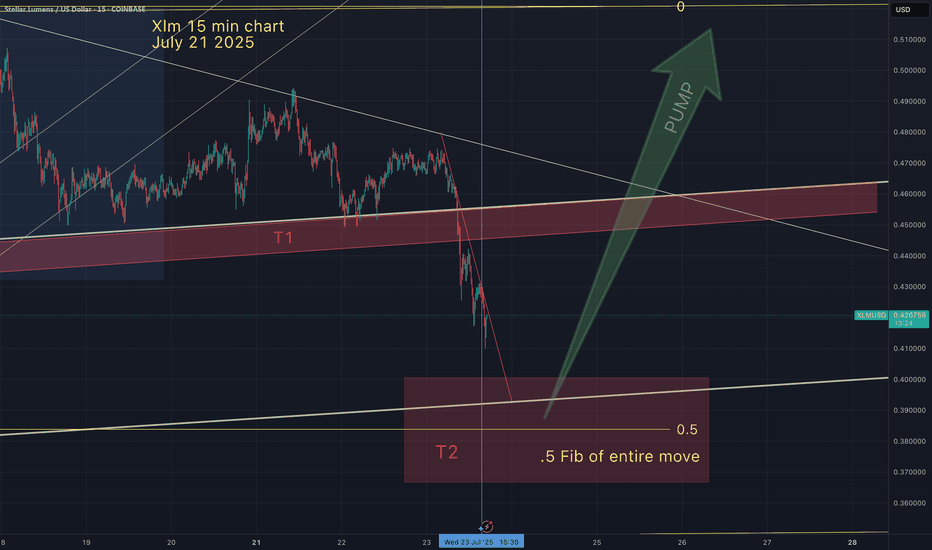
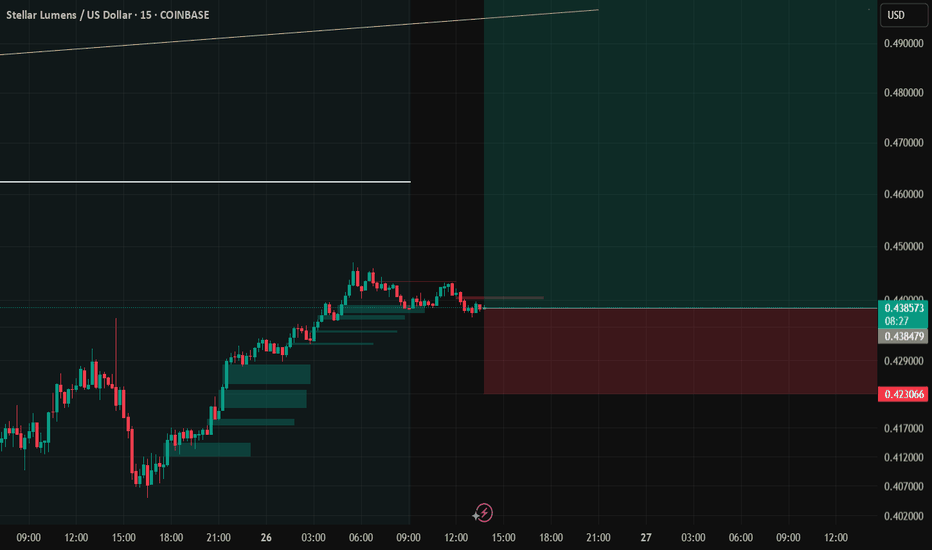
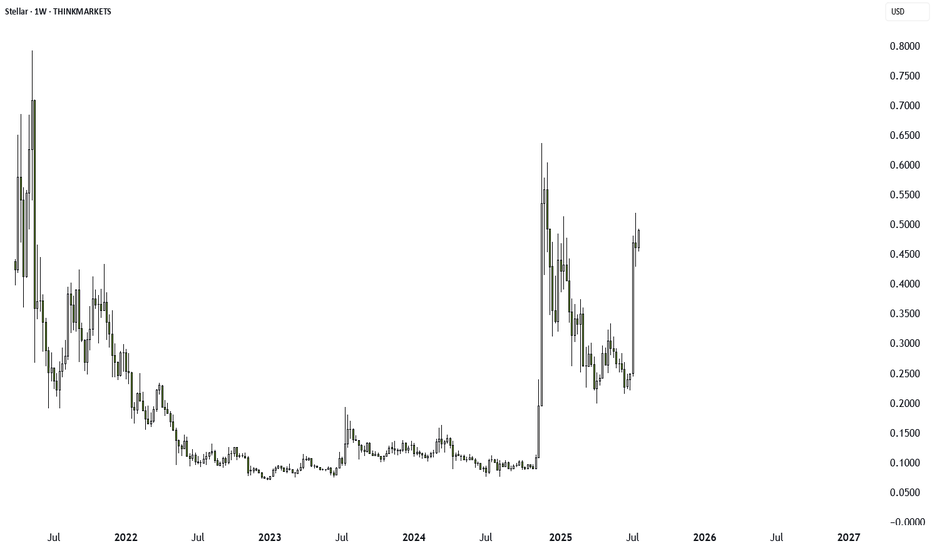
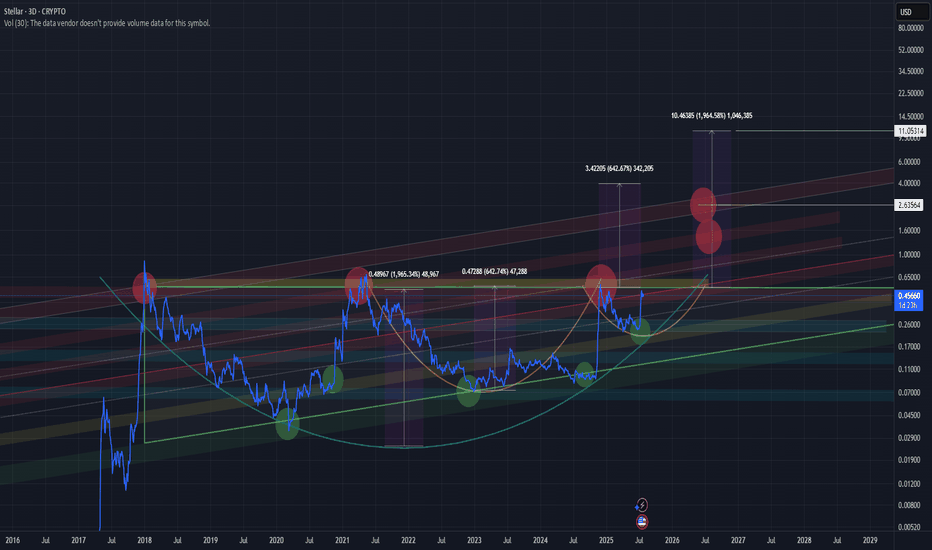
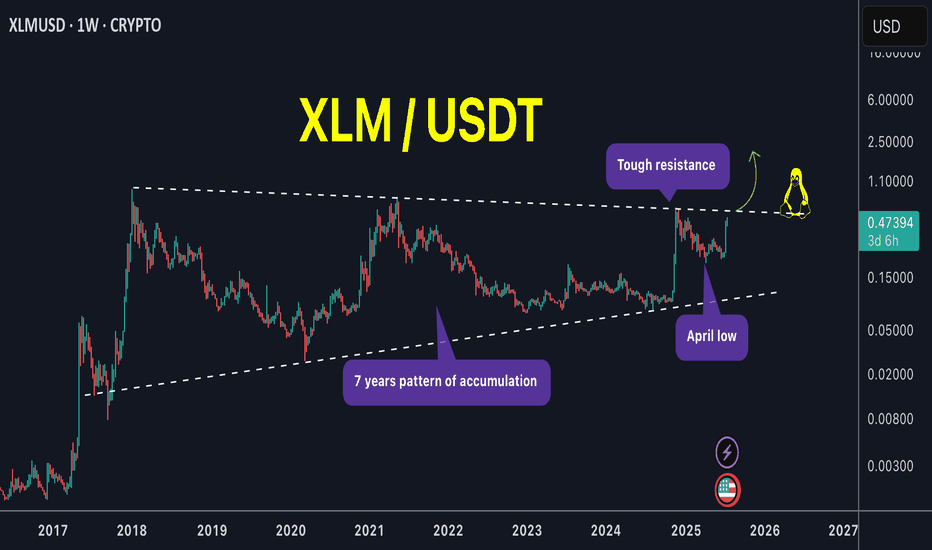
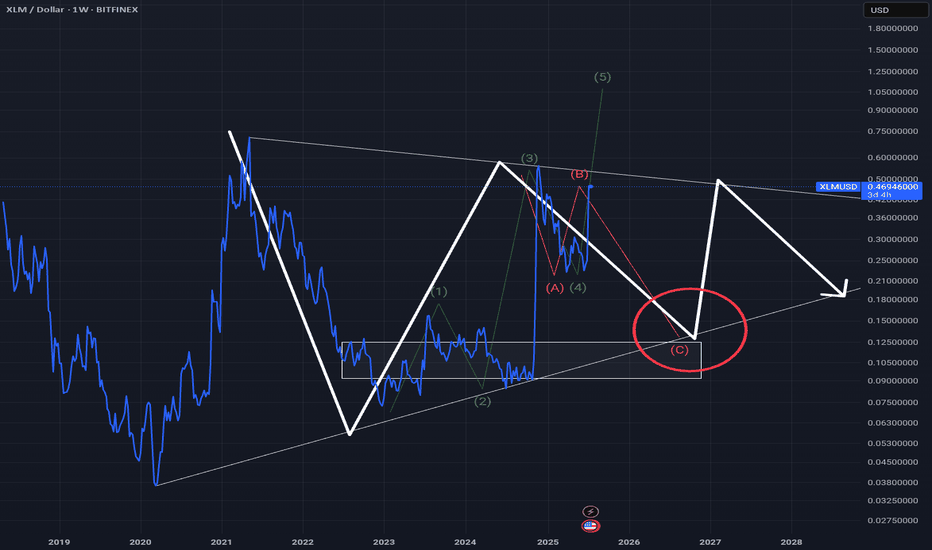
XLM - Getting Ready to go BerserkAfter a huge weekly candle, XLM still holds its ground at around 0.45 - 0.47, it's quite evident that it's getting ready to prime to its next target, Stoch RSI on daily is cooling down, and market is grinding slowly, when this blows past 0.53, it essentially breaks past it's all time high, a 7 year consolidation pattern would be breaking out and heading towards the moon, Targeting $4-$6
XLMUSD trade ideas
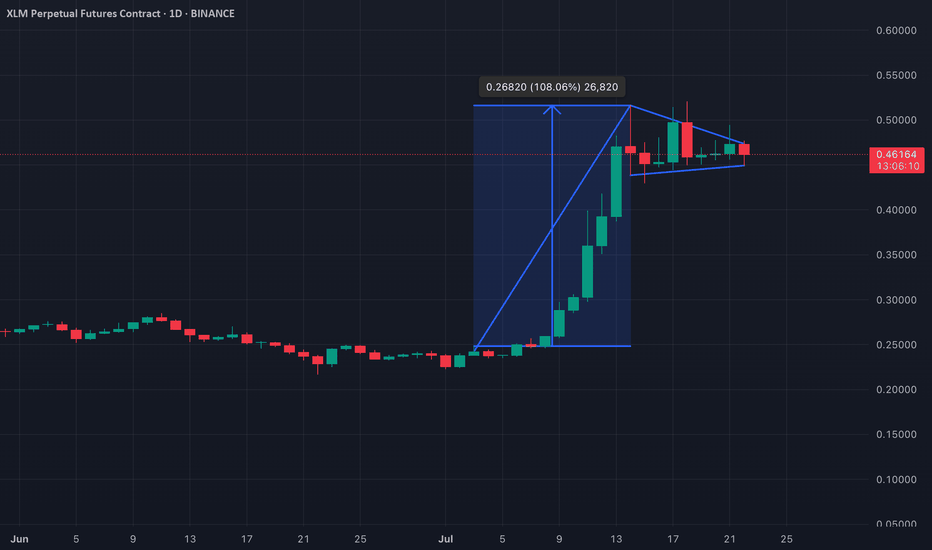
XLM: Bullish Pennant Signals Possible Breakout Rally IncomingXLM has formed a bullish pennant on the daily chart—a classic continuation pattern that typically follows a strong upward price surge. This formation, marked by a consolidation phase in the shape of a symmetrical triangle, suggests that buyers are briefly pausing before potentially resuming the uptrend.
A breakout above the pennant’s upper trendline would likely confirm bullish momentum, giving traders a clear signal to enter long positions. If this breakout occurs with strong volume, XLM could see an explosive move higher, potentially mirroring the size of the initial flagpole that led into the consolidation. Keep an eye on resistance levels as a break could spark the next leg up.
Solana Hits Target with 9x ROI, More Upside Ahead?Solana just smashed our target, delivering up to 9x returns for those who held on. In this video, we break down the current setup, where the next 40% move could come from, and what to watch in funding rates and BTC dominance. Altcoins are waking up. Are you ready?
This content is not directed to residents of the EU or UK. Any opinions, news, research, analyses, prices or other information contained on this website is provided as general market commentary and does not constitute investment advice. ThinkMarkets will not accept liability for any loss or damage including, without limitation, to any loss of profit which may arise directly or indirectly from use of or reliance on such information.
XLM/USD XLM is showing one of the strongest bullish setups right now.
A macro “Cup”, with a smaller “Cup with Handle” forming inside it — a powerful setup often leading to parabolic breakouts.
Before a true breakout, price may fake out to the downside, trapping longs.
This is classic market maker behavior — shakeouts followed by strong reversal and breakout. Stay focused on the reaction around yellow zone.
Currently in the final stages of the “handle” formation.
A breakout may confirm a move toward $4
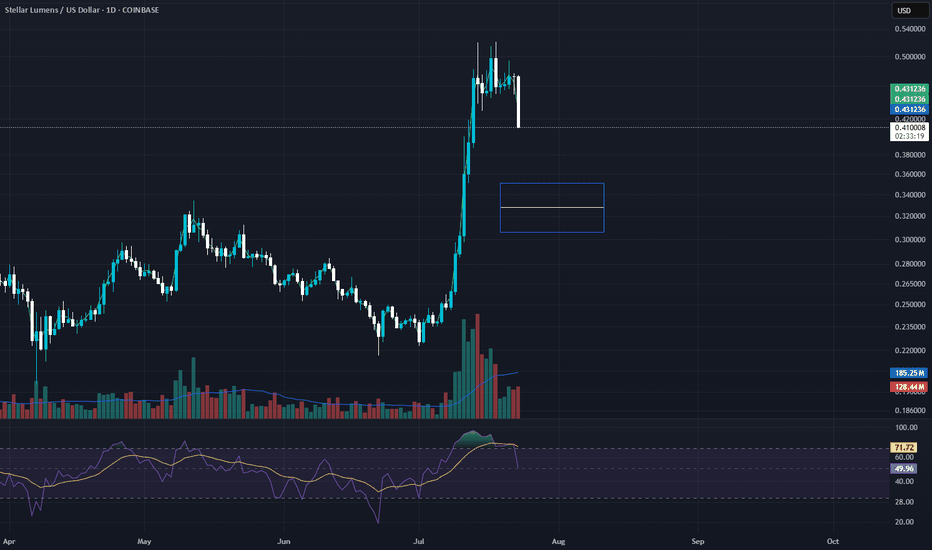
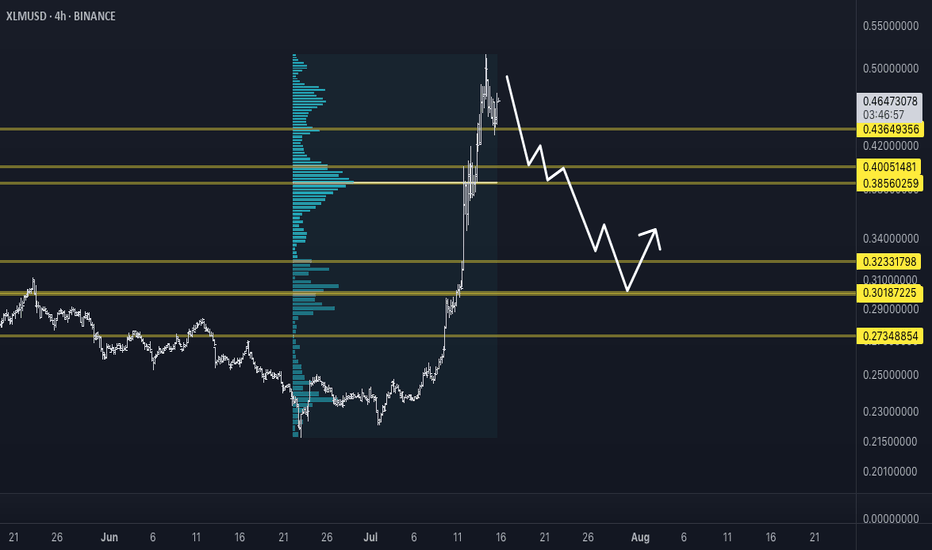
XLMUSD – Trying to Stand UpXLM fell aggressively from $0.4850 and broke below its SMA 200 for the third time in two sessions. RSI rebounded from oversold (~30), currently hovering near 42. The price is stabilizing near $0.4550 support — possible relief bounce brewing, but no higher highs yet. Caution advised.
XLM is the pump over or just getting started !XLM / USDT
What a huge weekly candle! We catched its strong move very early around 0.29$ a week ago (75% profits locked in spot)
With a zoom out chart we can see price is setting up nicely with several tests of pattern boundary. Next test of the upper boundary can lead to huge breakout of this mega pattern !
NOTE: Price must not close below april low and should close above upper boundary unless that its just a range
Keep an eye on it closely !
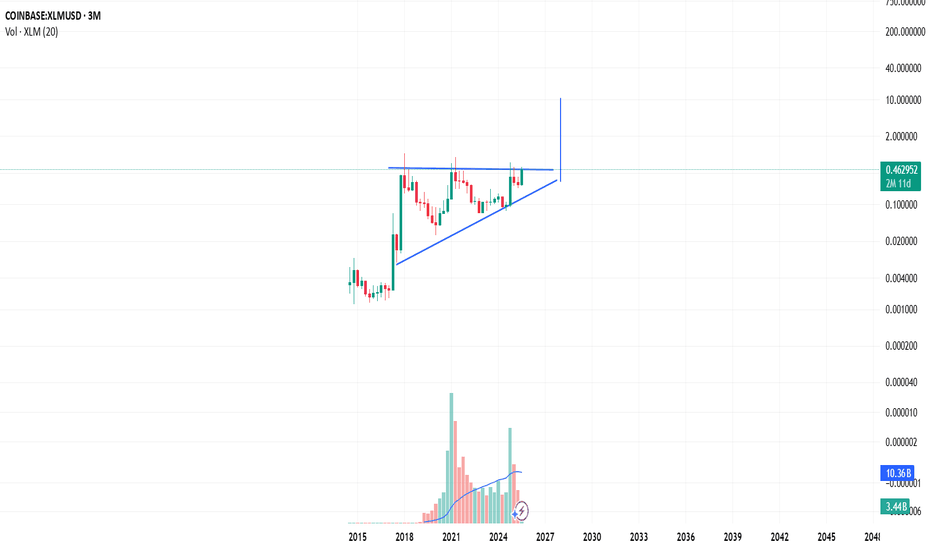
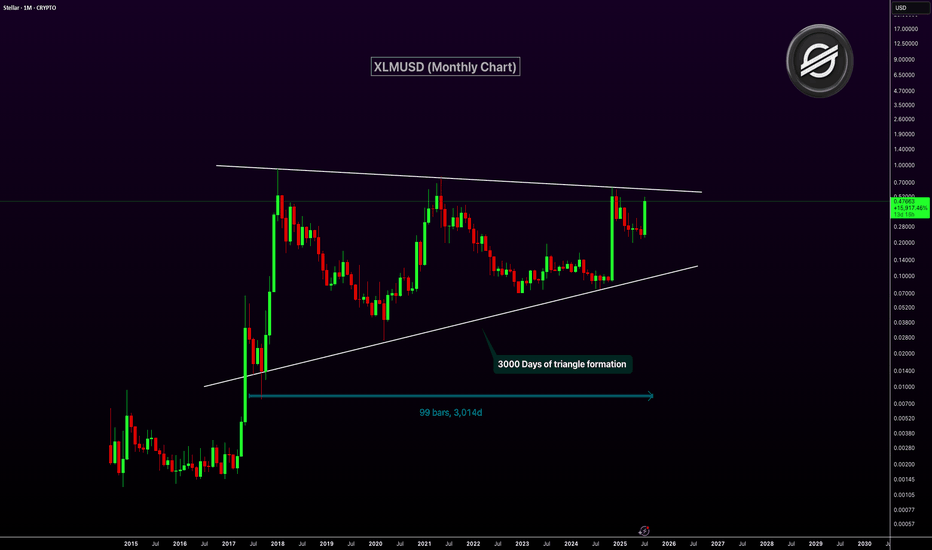
XLMUSD Nearing Breakout After 3,000-Day Triangle FormationXLM has been consolidating inside a massive symmetrical triangle for over 3,000 days. This long-term pattern on the monthly chart dates back to 2017. The price is now approaching the upper resistance trendline of the triangle. A breakout from this structure could ignite a major bullish rally.
The current monthly candle shows strong momentum with over 100% gains. A confirmed breakout above resistance could mark the start of a macro uptrend. This triangle is one of the most significant technical setups in XLM’s history.
Target 1: $1.00
Target 2: $2.50
Target 3: $5.00
WATCH OUT!!! RED ALERTStay vigilant. So many dummies out
there right now making all kinds of
ridiculous predictions. I've heard
several prophetic warnings about a
flash crash in the markets in August.
Maybe...maybe not. I will keep some
reserve USDC on the side and set my
limit orders accordingly. This is NOT
financial advice. Stay on alert here
just in case market makers try to
get everyone RRRRReKT. This would
be the 2nd candle on the weekly time
frame. Most bull cycles will produce
5 green candles on the weekly however,
I urge strong caution in the 67 cent area.
Oh...one more thang...
******* HAPPY XLM HUNTING ********
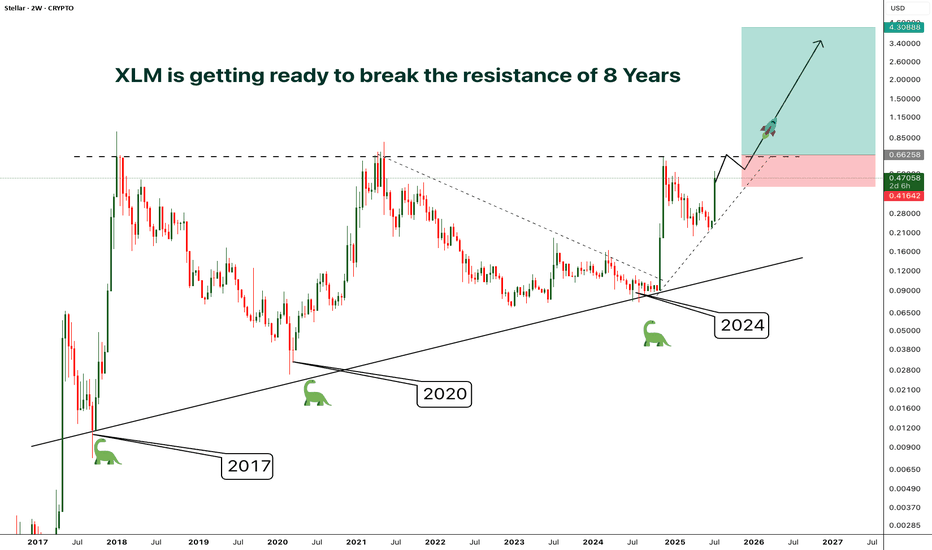
XLM - Resistance/Consolidation of 8 Years- Finally after 8 years of consolidation and getting rejected by the resistance at the same level around 0.65, XLM is preparing to break out from the almost decade old resistance
- A clear breakout from this resistance will phenomenal
- The price surge after the breakout will be unlike anything you've ever seen.
- I'm planning to enter after a confirmed breakout, entry before the breakout will be risky in case if the price gets rejected again.
Entry Price: Candle closeAbove 0.65
Stop Loss: Below 0.41
TP1: 0.88574
TP2: 1.21012
TP3: 1.92545
TP4: 2.68849
TP5: 4.27772
Don't forget to keep stoploss
Cheers
GreenCrypto
The one chart to rule them all - Stellar- the best looking setup in the crypto market
- the trade of the cycle
- as soon as monthly closes above resistance (red) XLM is likely to skyrocket higher, much higher
- with XLM recently acting as XRP beta, it is likely this move occurs once Ripple is comfortable above its 2017 high and heads to the triangle target of 10-12$
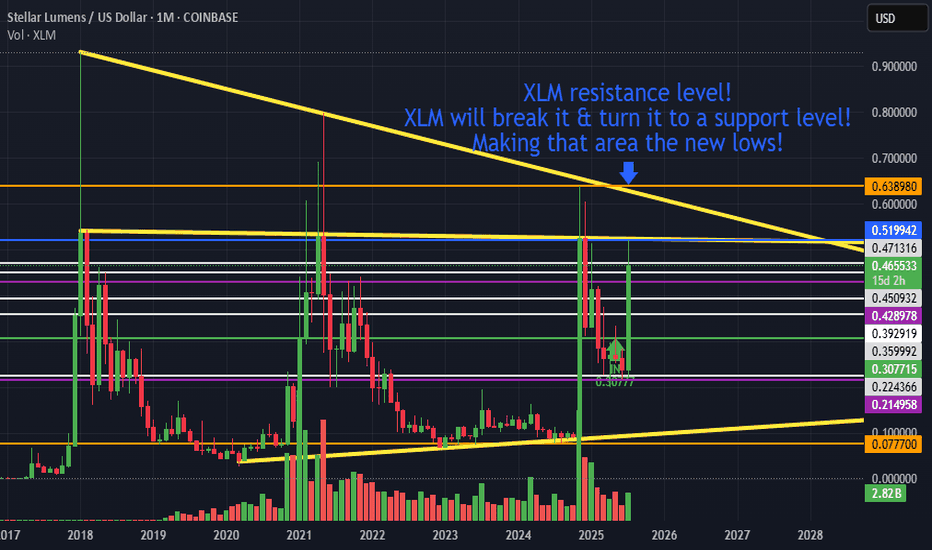
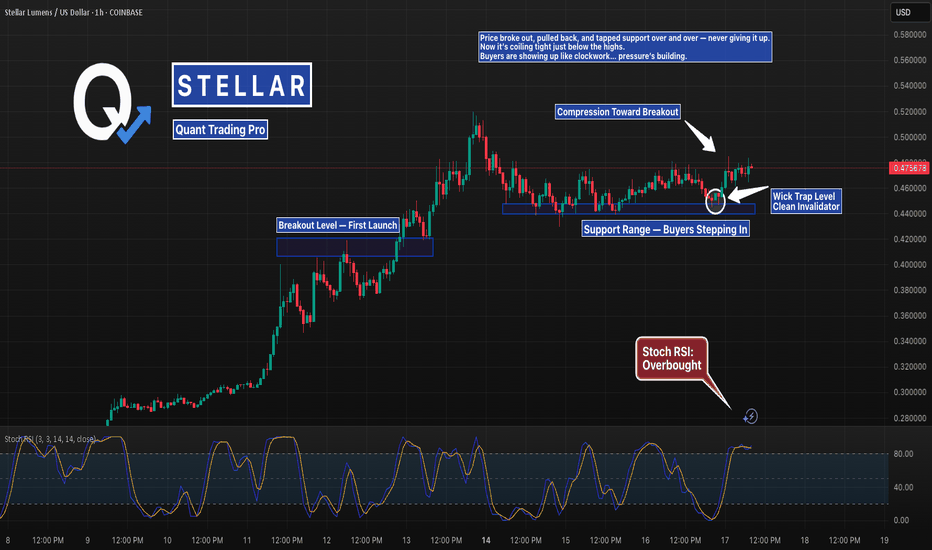
XLM Coiling at the Highs After Holding Support PerfectlyStellar broke out, then printed the cleanest support range you’ll find.
Wicks into demand, fast rejections, and now it’s compressing just under resistance.
If it breaks from here, there’s room to stretch.
But don’t forget — the longer it coils, the harder it snaps.
#XLM #StellarLumens #XLMUSD #SupportAndResistance #BreakoutSetup #CryptoCharts #TradingView #QuantTradingPro #BacktestEverything
