From Crypto Winter to Crypto Depression - Trouble for StellarStellar or XLM is in major trouble as it fights for its life in the crypto world.
If Bitcoin, Ethereum crashes - the alt market does tend to follow similar to major stock indices versus minor.
And there is no exception for this.
Now there are a few other reasons for Stallars downside to come including:
💥 1. Crypto Market Crash
A broader sell-off across crypto markets has dragged Stellar down with it.
📉 2. Lack of Developer Activity
Stellar is facing declining interest from developers compared to rival platforms.
💰 3. Investors Moving to Bigger Coins
Investors are shifting funds to Bitcoin and Ethereum for perceived stability.
🚫 4. Partnerships Falling Through
Several high-profile partnerships have quietly ended or stalled.
🧊 5. Low Community Engagement
Social media buzz and community activity around Stellar have hit new lows.
Here are basic technicals.
M Formation broke downn
Price below 20MA
First target to 200MA
Next to $0.135
Disclosure: I am part of Trade Nation's Influencer program and receive a monthly fee for using their TradingView charts in my analysis.
XLMUSD trade ideas

XLM charts with April 'flash crash' thesis zones.Here's my latest XLM chart, which includes potential levels that could be hit, along with an alternative path for the 5th wave, assuming the bottom is already in on the chart.
- If wave 4 is already complete, then the wave 6 "flash crash" low would likely be higher than the chart shows.
- If wave 4 isn't complete, then the wave 6 "flash crash" would likely sweep that low, prior moving into the real breakout beginning in the month of May.
- The real breakout, the 7th wave, would likely take out the previous pattern high making a run for what could potentially become a new all-time high in XLM.
Keep in mind that the "flash crash" in April is a theory and may not come to fruition or could be off in timing. However, I do believe that the breakout will begin in May, even if the "flash crash" does not occur in mid to late April as I've theorized.
Good luck, and always use a stop loss!

I wonder if XLMUSD will come down into the $0.06 - 0.13 Range Before taking off.....
Bullish.
Would love to see a pull back or retest into the $0.06 - $0.13 cent range maybe lower.
Great time to be a buyer.
Don't sleep on the opportunity.
Remember - If crypto projects don't blow up - they go up!!!!

XRPUSD and XLMUSD side by sideThe XRPUSD and XLMUSD pairs are showing divergent trends, with XRPUSD moving sideways and XLMUSD trending downward, which is considered bullish. however we know these pairs move together. XLMUSD has formed a triangle pattern that is nearing its apex, suggesting a potential breakout by the end of March or early April. This squeeze indicates an imminent move, either to the upside or downside, for both pairs despite their current differences. While the exact direction remains uncertain, historical patterns suggest significant potential for growth. If XLM were to replicate its performance from the previous bull run, it could potentially reach at least $4. However, it's important to note that market conditions and regulatory factors may influence the outcome.

bullish flag done ..xlm waiting for good news to push up pricescorrective waves done... xlm has to fly very high buyers are waiting explotion

XLM/USD "Stellar vs US Dollar" Crypto Market Heist Plan🌟Hi! Hola! Ola! Bonjour! Hallo! Marhaba!🌟
Dear Money Makers & Robbers, 🤑💰✈️
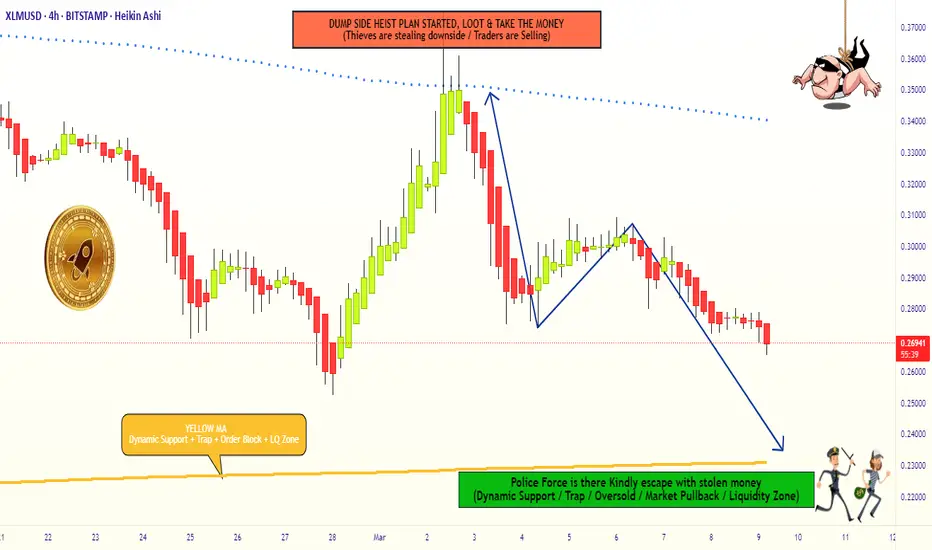
Based on 🔥Thief Trading style technical and fundamental analysis🔥, here is our master plan to heist the XLM/USD "Stellar vs US Dollar" Crypto market. Please adhere to the strategy I've outlined in the chart, which emphasizes short entry. Our aim is the high-risk Green Zone. Risky level, oversold market, consolidation, trend reversal, trap at the level where traders and bullish robbers are stronger. 🏆💸Book Profits Be wealthy and safe trade.💪🏆🎉
Entry 📈 : "The vault is wide open! Swipe the Bearish loot at any price - the heist is on!
however I advise to Place buy limit orders within a 15 or 30 minute timeframe most recent or swing, low or high level. I Highly recommended you to put alert in your chart.
Stop Loss 🛑:
Thief SL placed at the recent / swing low level Using the 4H timeframe (0.30000) swing trade basis.
SL is based on your risk of the trade, lot size and how many multiple orders you have to take.
Target 🎯: 0.23000 (or) Escape Before the Target
🧲Scalpers, take note 👀 : only scalp on the Short side. If you have a lot of money, you can go straight away; if not, you can join swing traders and carry out the robbery plan. Use trailing SL to safeguard your money 💰.
XLM/USD "Stellar vs US Dollar" Crypto market is currently experiencing a Bearish Trend,., driven by several key factors. 📰🗞️Read Fundamental, Macro, COT Report, On Chain Analysis, Sentimental Outlook, Intermarket Analysis, Future Prediction:
📌Keep in mind that these Fundamental factors can change rapidly, and it's essential to stay up-to-date with market developments and adjust your analysis accordingly.
⚠️Trading Alert : News Releases and Position Management 📰 🗞️ 🚫🚏
As a reminder, news releases can have a significant impact on market prices and volatility. To minimize potential losses and protect your running positions,
we recommend the following:
Avoid taking new trades during news releases
Use trailing stop-loss orders to protect your running positions and lock in profits
💖Supporting our robbery plan 💥Hit the Boost Button💥 will enable us to effortlessly make and steal money 💰💵. Boost the strength of our robbery team. Every day in this market make money with ease by using the Thief Trading Style.🏆💪🤝❤️🎉🚀
I'll see you soon with another heist plan, so stay tuned 🤑🐱👤🤗🤩
HUGE BULL FLAGDo NOT fall asleep on this BULL FLAG
formation on XLM. We could have one
more touch at the bottom of the flag
formation around .19 cents.. or it's possible
that we could just keep moving up and
break out without the last touch on the
line shown above. I believe we will get
the that last touch based on what I see
on ETH. ETH has been moving down since
Nov 2024...looks UGLY to. XLM has also moved
down since Nov 2024 however, it's developing
a BEAUTIFUL BULL FLAG that will break to the
upside soon! Spot buy here is smart. If we
do get that final touch I would go ALL IN...LOL
Good luck and...
********* HAPPY XLM HUNTING ********

XLM short termHello
this time I am posting a short term idea (few days to few weeks).
After explosion in Q4 of 2024 XLM has formed a downtrending channel which can potentially turn into a bull flag.
Currently XLM price is sitting at a bottom of this channel.
Short term traders can look to purchase some XLM now and wait till it comes towards the top of the channel to sell and get some profit. If it reaches top of the channel potential is 50% price increase.
If the market turns bullish in next few days to weeks XLM might even break upwards out of this bull flag but do not count on it just yet.
This idea is somewhat risky so proceed with extreme caution and with tight stop-loss below the channel.
Good luck.

Stellar: A Prime Opportunity Amid Market CorrectionsHello,
The Stellar network is an open-sourced, public blockchain powered by the Stellar Consensus protocol (SCP), a Proof-of-Agreement (PoA) consensus mechanism. Thanks to PoA, the Stellar network is faster, cheaper, and far more energy-efficient than many other blockchains.
Stellar (XLM) is currently undergoing a corrective phase, presenting a strategic opportunity for investors ahead of a potential market rebound. While short-term price action remains subdued, the broader outlook remains strong, especially as institutional adoption gains traction.
The recent push by the U.S. government to establish official cryptocurrency reserves has triggered market-wide volatility. However, this move could be the catalyst for a global shift, with other nations expected to follow suit. As governments begin accumulating digital assets, Stellar—known for its efficient cross-border transactions—stands to benefit significantly.
Once more countries establish their crypto reserves, demand for established cryptocurrencies like Stellar will increase, positioning it for long-term growth. The current correction serves as a healthy reset, setting the stage for a major breakout in the near future. Investors should watch closely for confirmation signals to capitalize on this emerging opportunity.
Disclosure: I am part of Trade Nation's Influencer program and receive a monthly fee for using their TradingView charts in my analysis.

(xlm) STELLAR "LOOP"This chart looks like there is no real volume and only someone very rich controlling the price of XLM. If I missed the top to sell and the price of XLM never went higher than previous ATH the price of most cryptocurrency is what would otherwise be stuck in a loop with very little interest from real investors. How is it possible for the chart to be like this?

XLM NEW IDEAI'm sharing a new idea that I think should be real because this pattern repeats the same thing as the previous one, this is just my opinion :) Good luck everyone.

Technical Analysis of XLM | Short-term Bearish Signal
Based on recent observations in the crypto market, XLM is showing signs of weakness in its price structure. Given the formation of a bearish pattern and the price’s reaction to key resistance levels, a downward move exceeding 10% is anticipated in the short term.
Support levels and bearish targets have been identified, and if a breakout is confirmed, the downward momentum could accelerate. Cautious traders may consider exit strategies or risk management plans.
⚠️ This analysis is for informational purposes only and does not constitute financial advice.

(XLM) stellarstellar headed towards the blackhole crossing. Will the price up and over or underneath is the question. Also shown in the graph is my standard parabolic look with varying colors for each side of the dots (bubbles).

(XLM) stellar "popular volume"The volume for XLM is trending up in recent weeks with major movement happening behind the scenes only visible through this indicator created to visualize the trend of volume.

$XLMTimeframe: W
Hit the golden ratio. Based on the final wave structure, I expect at least one more upward impulse. The most probable target is 1.00.
#XLM

XLM is going to put some smiles on people's faces very soon!The XLM chart appears to be showing some serious potential for growth. Currently trading within a descending wedge pattern and displaying a 5th wave internal wave count, XLM could outperform many people's expectations if the 5th wave plays out. Although many people tend to prefer XRP over XLM, I wouldn't count it out just yet, as—with recent price increases—it has potentially become more desirable compared to XRP due to its lower entry price range. As we know, many people don’t have a lot of extra cash just lying around nowadays.
Good luck, and always use a stop loss!

XLM super bullish pattern !#XLM has a real potential for a big rise ! i made a post on this coin before check it out
in lower time frame we have a nice pattern of a descending wedge so we can expect a rise but ITS A POSSIBLE MOVE THAT IT MADE ANOTHER DOWN BEFORE ITS RISE !

50 EMA Resistance good day team, please see how that value zone resistance crept back into the picture, we need a clean break from that resistance and possibly a retest, please be careful, please observe the falling wedge we are breaking free from, also notice how the 50 EMA is serving as a resistance

Is it my imagination or something more?Strangely XLM is still above 200 EMA, and it made a bullish hammer on the 200 EMA, if today's candle closes above the hammer candle, that may be a sign of some positive price action, also if we can get an upward break of the 10 EMA and the trendline that would be great confluences. Please see chart for details.

$3.00 + XLM by September is very likely! It's no mystery that XLM and XRP often trade like they are family. Much like an older brother, XRP generally paves the way for XLM—the younger sibling—and the two share a similar charting structure. However, since the "Trump election pump," although both have broken out, XLM has yet to break above the upper trendline of the current wedge pattern. This leads me to believe that we may soon see XLM surprise everyone. Instead of following, it may take the lead this time by breaking out of the wedge pattern, setting a new all-time high, and then entering price discovery along with its older brother, XRP. Together, they will likely lead the entire crypto market, as they are two of the ISO 20022-compliant tokens with the most potential for widespread adoption.
Keep an eye on XLM—I believe it will not only play catch-up but may even lead XRP and the broader crypto market in the next leg up.
Good luck, and always use a stop-loss!

XLM stellar Stellar down -60% since hitting a recent peak last November. The length of time following the mega candle in regards to the label and standing of XLM is a bit reductive when the price should be capable of doing better than losing so much. How is Stellar still this weak and lacking a great deal of support,. When is the $1.00 XLM coming,.

Will there be one more liquidation candle for XLM?XLM closely follows XRP's price action. Many investors, traders, and speculators understand that this relationship can provide distinct advantages at times, depending on market circumstances. However, it appears that XLM may have one more liquidation event in mind before the next leg up. Although there is no guarantee that this will occur, I believe it is very likely, as the weak doji candle—currently at the $0.23 cent level—would allow another liquidation event to clear the last remaining remnants of sell-side liquidity currently resting below the previous liquidation candle. I could be wrong, but this is an area to keep your eyes on in the event that the price continues to move downward.
Good luck, and always use a stop-loss!

(XLM) STELLARBefore large businesses finally consume the market of defi to become well established payment systems, small businesses can do so sooner than later. Even if large businesses are not using cryptocurrency to receive and transaction payments, there is no reason small businesses and freelancers cannot offer a way to receive and send payments through decentralized means. If most people used defi payment systems of some type (Preferred by the user) the need to care about whether the largest banks connected the two points as a bridge would not be necessary or important. In a way, it is as if society expects the banks, instead of the businesses (large, med, small) to make it possible to connect with payment crypto systems. If the business uses or even requires crypto payment transactions the bank is the one that will need to keep up and not the other way around. Why are we living in a world where we let the people that do the least amount of future thinking decisions control the way the future will be shaped. Banks have power through the people. Power to the people, not the banks. Banks collect all the money and use the collective bargaining chip to control people. From an individual standpoint people are more important than banks and as a network of individuals the movement of money is free flowing only if people choose to control their future and money. It is the end of the world, we're all going to die, this is the end, oh no. Investing in risky assets was never a safe bet as much as a risk worth taking. Keep that in mind. Using a feeless service like XLM for transactions that happen instantaneously would not be subject to issues of volatility in price. If there was a way to buy a crypto at the same time as transacting the cryptocurrency for the purpose of a transaction, now that would be revolutionary; so as to avoid the idea of holding the cryptocurrency to make the transaction.
