xlm shortin breaker area. I think its a good opportunity for sell short. I will try it from here. good luck.
Market insights

Ichimoku Analysis XLMWill long $XLM if we get a daily closing above 0.1192 as there is a bullish kumo crossover.

XLM LongLooking for the break above local resistance of .12
Once broken above, SL will be .118 and TP will be .127
Using 10x Leverage on Bybit

XLM/USD - Can XLM explode like XRP? YES! 😍XLM is lagging behind XRP in terms of price action. You can call it the little brother of XRP.
XRP consolidated in a similar channel and then broke out with a 50% pump.
I expect XLM to rally hard once it breaks this channel. The price action and volume show that buyers are interested.
My bias is bullish on this price action. Not sure why XRP and XLM are bullish in the current market conditions, but I am not here to judge, but rather to analyze the price action.
XLM looking quite decent here, but watch for a possible rejection again at the key resistance level.
Like and follow if you liked my idea!

XLM pumped 5%. What's next?Hello, dear TradingView members.
This is an XLM idea.
XLM moved 5% up and became one of today's top gainers.
The price now is on the local resistance level.
There are 3 support levels on the way down and only one solid resistance in the short-term scenario on the way up.
There are two scenarios in the current situation:
Scenario One:
The price will pass the local resistance and move to the solid resistance area and gets rejected and falls back on the local resistance and turns it into support.
Scenario Two:
The price will get rejected by local resistance and fall back to the half-shadow support levels.
RSI is in the overbought area, and the price has more room to go down.
Now let's see your ideas. Let's have a discussion.
Let me know if you guys have any questions;
I will be more than happy to help.
Good luck, and thank you.

XLMUSDT - Long with strong Up Volume- The Up volume > Average (20)
- Look back:
... The short key level was broken with a strong Up volume (x4).
... Corrective zone is with a down volume lower than Average 20 candles.

XLMUSDT - 4H - Bullish BatAfter a strong decline we can expect a bounce near 0.1050
Entry = 0.1050
Target 1= 0.1135
Target 2= 0.1209
Stop loss= 0.1007
Happy trading to all!
If you like this idea please like and share.
Best Regards.

XLM Moments Before Krypton | Need to Break 11-13 CentsXLM What a great project. Lots of consolidation done, very good girl stellar.

#XLM Projected TargetXRP have been having all the fun lately but what about Steller? In my view a positive outcome for XRP will also be positive for XLM. Both are competing for the same space at the moment.

Stellar (XLM) formed bullish Gartley for upto 12.50% moveHi dear members, hope you are well and welcome to the new trade setup of XLM .
Previously I shared a long-term trade setup for XLM , which is still in play:
Now on a 4-hr time frame, XLM has almost completed a bullish Gartley pattern. There is also a hidden bullish divergence, as the priceline is forming a higher low and Stochastic is setting a lower low.
Note: Above idea is for educational purpose only. It is advised to diversify and strictly follow the stop loss, and don't get stuck with trade

XLM Can Start to Increase soonXLM is in a Rounded Bottom Right now Which means the Price will Be Increasing Soon. The Price will be Increasing as much as the Measured Price Movement (AB=CD) That means the Price will Reach around 0.1600$. 27% Profit (at least !) Note that we should wait for a break out to happen.
-XLM is in a rounded Bottom
-No break out
-(AB=CD)
-0.16$ is the Target
-27% Profit
_ _ _ _ _ _ _ _ _ _ _ _ _ _ _ _ _ _ _ _ _ _ _ _ _ _ _ _ _ _ _ _ _
Thank you for seeing idea .
Have a nice day and Good luck

Stellar XLM Bearish SentimentFriday the S&P reached its 52 week low, $3636. There is a strong correlation between the S&P and the crypto world. Many stock investors diversified their portfolio into cryptos, especially in BTC Bitcoin and ETH Ethereum .
With a bearish stock market in the worst month for stocks and cryptos, i expect most of the cryptocurrencies to trade lower this week.
XLM/USDT short
Entry Range: $0.110 - 120
Price Target 1: $0.098
Price Target 2: $0.0.092
Price Target 3: $0.080
Stop Loss: $0.129

XLM Needs to Break 13 Cents USDA break back over yesterdays high will be the pump we've been waiting for. WHALES BUY

XLMUSDTHello Crypto Lovers,
Mars Signals team wishes you high profits.
This is a one-day-time frame analysis for XLMUSDT
In the current chart, there are R2 and R1 as our resistance areas which both contain the disability of the price to rise. And at the bottom, we have S1 that is a support area and the well support of price since the past is obvious in it. Thus, we have the fluctuation of price below R1 area and we believe it will have a decline toward S1 and there we should have some rising signs in order to make sure the price will rise to higher amounts. Clearly, the price has a neutral behavior at the present between R1 and S1 and we cannot define a precise position for it unless it leaves this area. Let's wait and see what future reveals.
Warning: This is just a suggestion and we do not guarantee profits. We advise you to analyze the chart before opening any positions.
Wish you luck


XLMUSDT - 4H - Potential Bearish BatPrice is ranging between a channel.
A potential bat is near completion.
Good R/R ratio
Please like and follow.
Happy Trading!!

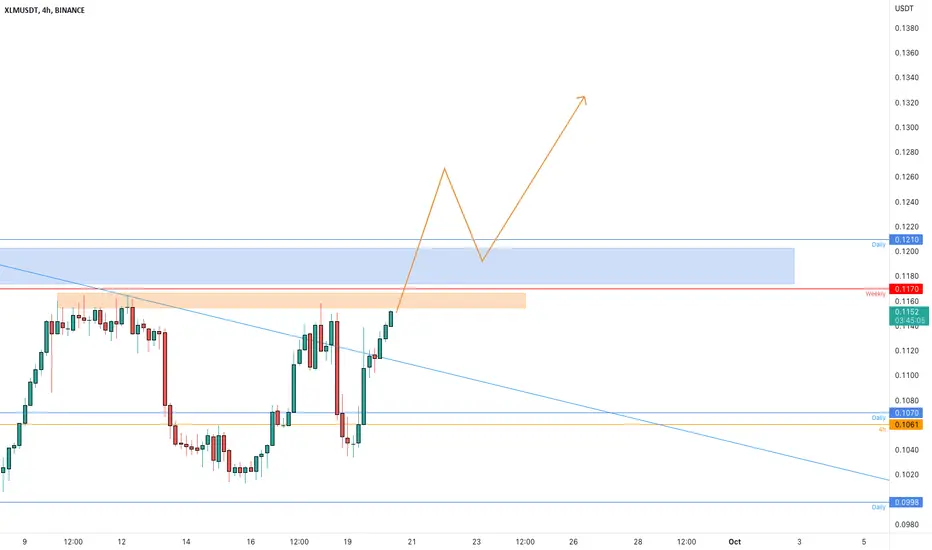
XLMUSDT needs to create the breakoutThe price is testing a strong area around 0.1170$ where the market got several rejections.
The price needs to create a Clear breakout with volume.
How to approach it?
IF the price is going to have a CLEAR breakout and retest the previous resistance area as new support, According to Plancton's strategy , we can set a nice order
–––––
Keep in mind.
🟣 Purple structure -> Monthly structure.
🔴 Red structure -> Weekly structure.
🔵 Blue structure -> Daily structure.
🟡 Yellow structure -> 4h structure.
⚫️ black structure -> >= 1h structure.
–––––
Follow the Shrimp 🦐
ExpectThe break of the 120-day moving average line to the top and the break of the downward trend line promises growth up to 0.4 $.

XLMUSDT 1D The global growth goal is $0.5 per XLMThe XLMUSDT price behaves almost as nicely as the price of "colleagues in the shop" - XRPUSDT
The XLMUSD price is approaching the critical level of $0.12.
Breaking this level up and fixing it above means the official start of a new growth trend.
If Stellar buyers fail to break through the price of $0.12, and the cryptocurrency market continues to be negative, the $0.075 level for buying XLM will be quite relevant
_______________________________
Since 2016 , we have been analyzing and trading the cryptocurrency market.
We transform our knowledge, trading moods and experience into ideas. Each "like under the idea" boosts the level of our happiness by 0.05%. If we help you to be calmer and richer — help us to be happier :)

#Stellar soars 14% in 3 Weeks, will XLM bulls Break $0.12?Past Performance of Stellar
There are flashes of strength in XLM. A notable development is that the coin is outperforming BTC and ETH. For instance, it is up 14 percent from September lows and tracking higher week-to-date versus the USDT. Despite rejections of higher prices on September 21, Stellar's uptrend is still valid. The immediate resistance is at $0.12; buyers may resume formation, targeting $0.135 in the short term.
#Stellar Technical Analysis
The expansion of Stellar prices on the past few trading days is with rising trading volumes. This development is overly bullish and signals buyers' participation. Since prices are firm and buyers appear to be in charge, traders can find loading opportunities on pullbacks above $0.105 and the middle BB. The immediate target, in that case, will be August 2022 highs at around $0.135, as mentioned earlier. On the reverse side, sharp losses confirming bears of September 21 may see XLM contract back to $0.098 in a retest.
What to Expect from #XLM?
XLM buyers are solid; the coin may tick higher with rising volumes as it bottoms up. The immediate support is at $0.105, while resistance lies at $0.12. Any surge above this week's highs may initiate demand, possibly lifting the coin to new multi-week highs at $0.135 or better in the medium term.
Resistance level to watch out for: $0.12
Support level to watch out for: $0.105
Disclaimer: Opinions expressed are not investment advice. Do your research.

XLM | Stellar | The Technical Outlook is Supporting GrowthXLM | Stellar | The Technical Outlook is Supporting Growth
Price is testing the bottom of the pattern for the third time
and thereby creating a potential megaphone pattern.
During the last days, the price increased by about 17%.
A good part of the movement was supported by XRP.
XRP is showing positive developments regarding the lawsuit they have.
This is one of my favorite projects and it should grow further.
Objectives:
🎯 0.15072
🎯 0.17021
🎯 0.23681
Thanks and Good Luck!


XLM Short @ .1175 10x leverageThis is wildly overvalued and have entered a position on this coin.
We are just atop the KC, I am going to scalp this position.
