Monero (XMR): Looking For Break of Neckline + Bounce From EMAXMR is still in a clean bullish structure and trading above the EMAs, with buyers keeping momentum overall. Right now price is consolidating just below the resistance zone, which also lines up with a previous liquidity area.
This kind of pause usually builds pressure. If buyers manage to push through and secure this zone, then a move into the upper liquidity sweep area becomes very likely. Until that happens, we’re simply watching how price behaves here and waiting for confirmation rather than forcing anything.
Swallow Academy
Market insights

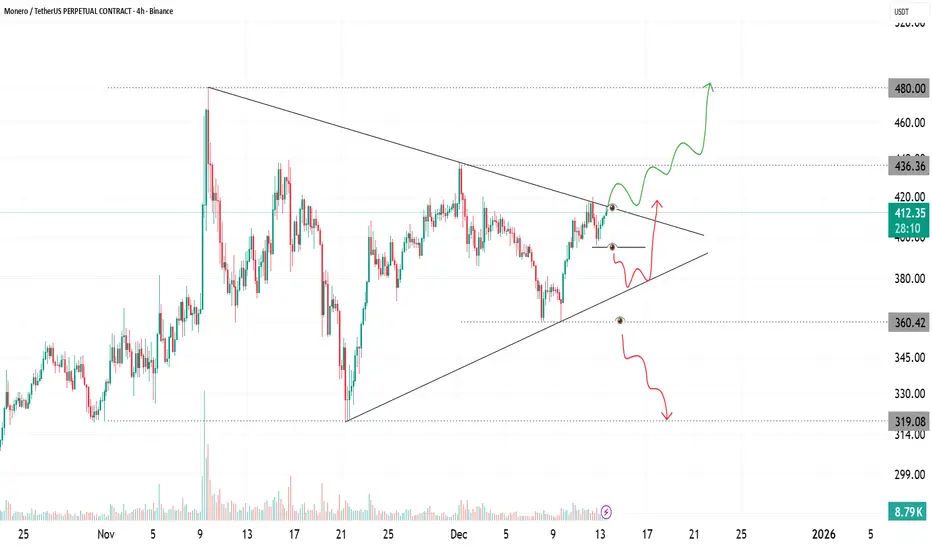
XMR Compressing Inside Symmetrical Triangle Near Breakout ZoneXMR is currently trading inside a well-defined symmetrical triangle, formed by a series of lower highs and higher lows after a strong impulse move. This structure reflects balanced pressure between buyers and sellers, signaling compression before a volatility expansion.
Price is now approaching the upper boundary of the triangle while holding above the rising support. A confirmed breakout above the descending resistance with acceptance can trigger a continuation move toward the 436 region, followed by the higher resistance near 480.
If price fails to break the upper boundary and loses the rising support, the triangle will resolve to the downside. In that scenario, the next demand areas are located near 360 and 319, where price previously reacted strongly.
This setup is driven by triangle compression, trendline interaction, and liquidity buildup. The breakout direction will define the next major move, making confirmation essential before bias selection.
XMR USDT SHORT SIGNAL---
📢 Official Trade Signal – XMR/USDT
📉 Position Type: SHORT
💰 Entry Price: 407.66
---
🎯 Take-Profit Targets (Partial Exits)
• TP1: 401
• TP2: 395
• TP3: 387.98
• TP4: 375.05
• TP5: —
• TP6: —
---
🛑 Stop-Loss: 421.65
📊 Timeframe: 15m
⚖️ Risk/Reward Ratio: 5.9
💥 Suggested Leverage: 5× – 10×
---
🧠 Technical Analysis Summary
XMR is currently displaying strong bearish momentum after rejecting the 410–420 supply zone.
Structure on the 15m chart is clearly shifting downward, forming lower highs and lower lows.
The downside liquidity map aligns cleanly with our TP targets:
401 → First liquidity pocket
395 → Deep imbalance zone
387.98 → Major liquidity pool
375.05 → Final demand zone target
A confirmed break below 401 is expected to accelerate the bearish continuation toward lower liquidity zones.
---
⚙️ Trade Management Rules
✔ Take partial profit at TP1
✔ Move SL → Break-Even after TP1
✔ Trail the stop as price reaches deeper targets
✔ Avoid re-entry if SL is hit
✔ Enter only with clear bearish confirmation
---
📌 TradingView Hashtags
#XMRUSDT #XMR #CryptoSignal #ShortSetup
#TradingView #FuturesTrading #CryptoAnalysis
---

XMR/USDT — Privacy Returns to the Spotlight 🔐📈 XMR/USDT — Privacy Returns to the Spotlight as Structure Turns Fully Bullish
Hey there how's your day?
December 18, 2025
Monero, the original privacy coin, is showing a strong technical revival after years of consolidation.
At the same time, global attention around financial privacy, censorship resistance, and on-chain anonymity is steadily increasing — a perfect narrative backdrop for XMR.
Technically and conceptually, this is one of the cleanest bullish structures XMR has printed in a long time.
🔍 Technical Overview
Current price: ~$433
4EMA cluster: ~$386 / $295 / $260 / $193
→ Price is decisively above all EMAs, confirming a full trend reversal.
Volume has expanded during impulsive moves, showing real demand, not just speculative spikes.
📊 Market Structure Breakdown
1. Multi-year accumulation (2022 → early 2025)
XMR spent several years ranging between:
Support: ~$120–180
Resistance: ~$280–300
This long, flat structure represents deep accumulation — the kind that usually precedes macro expansion, not short-term moves.
2. Structural breakout above $290–300
Once XMR reclaimed the $290–300 zone:
Price never lost it again
The level flipped cleanly from resistance to support
Momentum accelerated quickly
This confirmed the end of the accumulation phase.
3. Higher highs and higher lows above key support
After the breakout, price formed:
A clear higher low above ~$290
A continuation push toward ~$430
A shallow pullback, immediately bought
This behavior confirms strong hands accumulation rather than distribution.
🧱 Key Levels
Major Support Zones
$290–300 → critical structural support (must hold)
$385–400 → local demand zone
EMAs cluster → dynamic support on any retracement
As long as XMR stays above $300, the macro bullish structure remains intact.
Resistance / Targets Ahead
$500 → psychological resistance
$557–595 → mid-range supply zone
$670 → major historical level
$860 → long-term macro target
These are the same zones that capped price during previous cycles.
🔐 Why XMR Matters: The Privacy Narrative
Monero is not just another altcoin.
Fully private by default
Untraceable transactions
Fungible digital cash
In an environment of:
increasing surveillance,
stricter KYC regulations,
and declining on-chain privacy,
XMR stands alone as the last true privacy-first cryptocurrency still widely used.
Historically, when privacy becomes a public concern, XMR reacts with delayed but powerful moves — often stronger than the rest of the market.
🎯 Outlook
This is a classic transition from long-term accumulation to expansion, supported by both:
technical structure, and
a powerful narrative tailwind (privacy).
Bullish if:
price holds above $300,
pullbacks remain shallow,
and volume confirms continuation.
If this holds, the path toward $500 → $670 → $860 becomes structurally valid.
Bearish only if:
price loses the $290–300 support zone,
which would signal a deeper consolidation instead of expansion.
Until then, Monero remains one of the strongest privacy-driven setups in the entire crypto market.
Good trading week!

XMR Rejected the $424 high-time-frame resistanceXMR rejected the $424 high-time-frame resistance and has now slipped back below the $408 level, showing early signs of a deeper corrective move.
As long as price holds beneath $408, downside continuation remains the higher-probability path toward the broader $290 support zone.
Key Points:
- Rejection at $424 resistance
- Price back under $408, confirming weakness
- Support target sits near $290
What to Expect:
If sellers maintain control below $408, XMR likely trends lower. A reclaim of $408 would be needed to shift bias back toward short-term bullishness.

Monero Wave Analysis – 1 December 2025
- Monero reversed from strong resistance zone
- Likely to fall to support level 375.00
Monero cryptocurrency recently reversed down from the strong resistance zone located between the resistance levels 416.00 (former multi-month high from May) and 435.00 (top of earlier wave b).
This resistance zone was further strengthened by the upper daily Bollinger Band.
Given the strength of the aforementioned resistance zone and the overbought daily Stochastic, Monero cryptocurrency can be expected to fall to the next round support level 375.00 (low of earlier wave a).

xmr usdt short signa---
📢 Official Trade Signal – XMR/USDT
📉 Position Type: SHORT
💰 Entry Price: Market Entry
---
🎯 Take-Profit Targets (Partial Exits):
• TP1: 402.27
• TP2: 392.48
• TP3: 378.76
• TP4: —
• TP5: —
• TP6: —
---
🛑 Stop-Loss: 422.33
📊 Timeframe: 15m
⚖️ Risk/Reward Ratio: 7.15
💥 Suggested Leverage: 3× – 5×
---
🧠 Technical Analysis Summary
XMR shows strong bearish momentum following rejection from the 418–425 supply zone.
Market structure on the 15m chart is shifting downward with clear lower-high formation.
Selling pressure is increasing, and liquidity gaps align perfectly with our TP levels.
The critical downside targets:
402.27 → 392.48 → 378.76
A break below 402.27 (TP1) should accelerate momentum toward deeper liquidity at 392.48 and 378.76.
---
⚙️ Trade Management Rules
✔ Partial profit at TP1
✔ SL → Break-Even once TP1 hits
✔ Trail SL as price moves toward lower targets
✔ No re-entry if SL (422.33) is hit
✔ Confirm bearish structure before entering
---
📌 TradingView Hashtags
#XMRUSDT #XMR #CryptoSignal #ShortSetup
#TradingView #FuturesTrading #TechnicalAnalysis
---
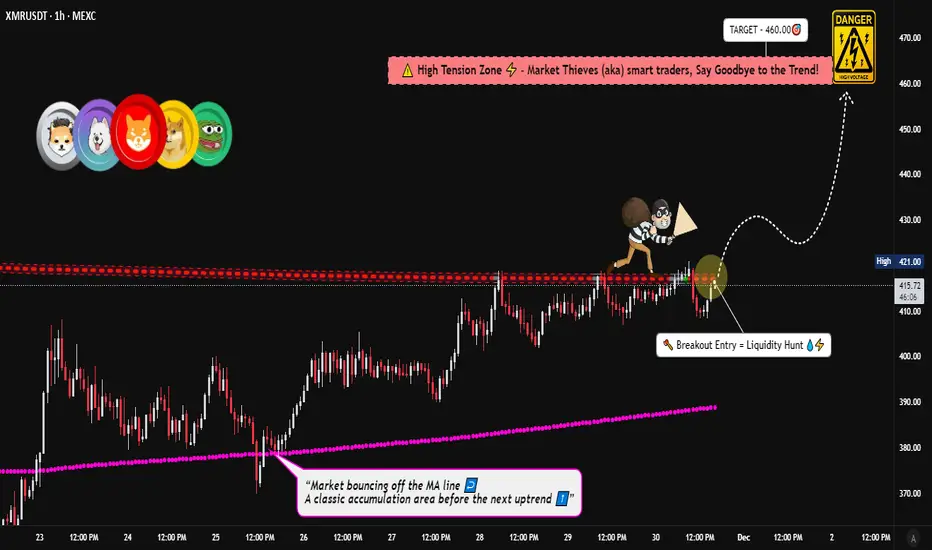
Monero Price Action Report — Breakout Strength and Target ZoneXMR/USDT Bullish Breakout Blueprint! 🚀📈 (Swing & Day Trade Plan)
Description:
Monero is awakening! 🦋 A dynamic breakout is in play, offering a clear technical setup for both swing and day traders. Here’s your professional blueprint to navigate this opportunity.
📊 Trading Thesis: Bullish Breakout
The setup is confirmed by a breakout above the key Weighted Moving Average (WMA) dynamic resistance near 420.00. This signals a potential shift in momentum and opens the door for a bullish move.
🎯 Execution Plan
🟢 Entry Zone: Any price AFTER a confirmed breakout & close above 420.00. Look for a retest of the WMA as support for an optimal risk-reward entry.
⛔ Stop Loss (Risk Management): A logical stop loss can be placed below 390.00, which is under the recent support and WMA structure.
⚠️ Disclaimer: This is my suggested SL based on my strategy. You MUST adjust your position size and stop loss based on your own risk tolerance and capital. Always wait for breakout confirmation before placing your SL.
🎯 Profit Target (Take Profit): Our primary target is the 460.00 zone. This area represents a strong historical resistance level and could coincide with overbought conditions. Secure your profits proactively!
💡 Professional Note: This is my initial target. You are free to take partial profits earlier or trail your stop. "Make money, then take money" – manage your trade actively!
🔍 Key Levels & Rationale
Bullish Trigger: WMA Breakout > 420.00
Invalidation Level: < 390.00 (Bullish structure broken)
Target Zone: 460.00 (Major Resistance & Profit-Taking Zone)
🌐 Related Pairs & Market Correlations
Diversify your watchlist! The crypto market is highly correlated. Movements in XMR often relate to these assets:
CRYPTOCAP:BTC.D (Bitcoin Dominance): 📉 A decrease in BTC.D often fuels altcoin rallies, which is bullish for XMR.
BTC/USDT: 👑 The King leads, alts follow. A strong, stable, or rising Bitcoin is generally positive for the entire crypto market, including Monero.
Privacy Coin Sector:
CRYPTOCAP:ZEC (Zcash) & NASDAQ:DASH 📊
Key Point: Watch these for sector-wide momentum. A bullish move in XMR is often mirrored in other major privacy coins, confirming a sector trend.
Major Alts:
ETH/USDT 💙 & XRP/USDT ⚡
Key Point: Strength in large-cap alts like ETH and XRP creates a risk-on environment, which is beneficial for mid-cap coins like Monero.
✅ Final Checklist Before Entering:
✅ Breakout & close above WMA (420) confirmed?
✅ Volume supporting the move?
✅ SL set according to MY risk management?
✅ Related pairs (BTC, ETH) showing strength?
Let me know your thoughts in the comments! 💬 Are you bullish or bearish on XMR?
Like & Follow 👍 for more high-quality, actionable trade ideas!
#TradingView #XMR #Monero #Crypto #SwingTrading #DayTrading #TechnicalAnalysis #Breakout #WMA #BTC #Altcoins #DeFi
Short squeeze on Monerochart pattern is looking very like silver / gold 4hr breakout on Friday
as with every trade use your own leverage and size
XMR/USDT SHORTSELLXmr leverage short
Entry: 410-418
SL: Very tight
Price is currently sitting in its previous high. I expect the rally to end now (TP 285)
Suggested leverage: X10- X20

XMR ready to jump again 16% gain toward 465$Hi the support and resistances on the chart are based on the previous data and weekly candlesticks if KUCOIN:XMRUSDT holds this last support the potential of 16% gain is logical toward 465$

XMRUSDT 1D#XMR has formed a rounding bottom pattern on the daily chart. The neckline of the pattern is acting as a resistance zone, while the Ichimoku cloud, the daily SMA50, and the structural support line of the rounding bottom form a strong support cluster. You can buy here and on the support cluster. If price breaks above the neckline/resistance zone, the potential upside targets are:
🎯 $438.99
🎯 $467.25
🎯 $507.48
🎯 $558.72
🎯 $623.85
🎯 $657.86
🎯 $706.71
⚠️ Always remember to use a tight stop-loss and maintain proper risk management.

XMR USDT SHORT SIGNAL---
📢 Official Trade Signal – XMR/USDT
📉 Position Type: SHORT
💰 Entry: Market Entry
---
🎯 Take-Profit Targets (Managed Exits):
• TP1 = 392.23
• TP2 = 378.67
• TP3 = 361.17
• TP4 = 345.76
• TP5 = —
• TP6 = —
---
🛑 Stop-Loss: 410.22
📊 Timeframe: 15m
⚖️ Risk/Reward Ratio: 2.8
💥 Suggested Leverage: 5× – 10×
---
🧠 Technical Overview
XMR has broken below short-term market structure and is showing bearish continuation on the 15m timeframe. Strong rejection near 405–410 resistance pushed price downward, confirming seller dominance. Liquidity pools beneath 392.75 and 385.10 align with our TP levels.
A clean continuation is expected if momentum remains below 400 psychological resistance.
---
⚙️ Trade Management Guidelines
✔️ Partial profit at TP1
✔️ Move SL to Break-Even after TP1 hit
✔️ Trail SL as price progresses
✔️ No re-entry if SL is hit
✔️ Confirm bearish structure before entering
---
⚠️ Risk Notice
Capital preservation first. Market entries require strict risk control.
---
📌 TradingView Hashtags
#XMRUSDT #Monero #CryptoSignal #ShortSignal
#FuturesTrading #Altcoins #TechnicalAnalysis
---

XMR in ascending channel can hit upper targets 14% gain to 400$Hi the support and resistances on the chart are based on the previous data and weekly candlesticks if KUCOIN:XMRUSDT holds this last support the potential of 14% gain is logical toward 400$

XMR Sell/Short Signal (4H)XMR has turned bearish after the change of character (CH) and, following the break of the short-term trendline, has now pulled back to a resistance zone while also sweeping a liquidity pool above the pivots.
With proper risk management and adherence to the stop-loss, this setup can be entered.
Targets are marked on the chart.
A daily candle closing above the invalidation level will negate this analysis.
Do not enter the position without capital management and stop setting
Comment if you have any questions
thank you

XMR USDT SHORT SIGNAL📢 Official Trade Signal – XMR/USDT
📉 Position Type: SHORT
💰 Entry Price: 346.41
---
🎯 Take-Profit Targets (Partial Exits)
TP1 = 330.30
TP2 = 320.75
TP3 = 306.20
TP4 = 294.96
TP5 = —
TP6 = —
---
🛑 Stop-Loss: 355.50
📊 Timeframe: —
⚖️ Risk/Reward Ratio: 6.53
💥 Suggested Leverage: 5× – 10×
---
🧠 Technical Analysis Summary
Monero (XMR) has reached a key supply zone near 345–355, where sellers historically showed strong control.
Price is showing clear bearish reaction, with weakening bullish momentum and a shift toward lower-high structure.
A short setup is supported by:
Bearish rejection wicks near major resistance
Breakdown of intraday support zones
Momentum loss on higher timeframes
Formation of bearish divergence indicating potential reversal
Liquidity resting below 330 – ideal magnet zone
Targets are placed on major liquidity pools and untested demand zones, matching institutional flow behavior.
---
⚙️ Trade Management Rules
✔️ Take partial profit at TP1
✔️ Move Stop-Loss to Break-Even after TP1 hits
✔️ Trail SL downward as price approaches TP2 → TP4
✔️ Do NOT re-enter if SL at 355.50 is hit
✔️ Avoid emotional trading if price consolidates around entry
---
⚠️ Important Risk-Management Note
After TP1 is reached, ALWAYS move SL to Entry Price (346.41).
This turns the trade into a risk-free setup.
❗ If price hits TP1 then reverses and closes at Break-Even → this is NOT a loss.
Capital preservation is the foundation of professional trading.
---
📌 TradingView Hashtags
#XMRUSDT #Monero #CryptoSignal #ShortSetup #TechnicalAnalysis
#TradingView #FuturesTrading #ALTCOINS #ScalpTrade #ProSignal
--

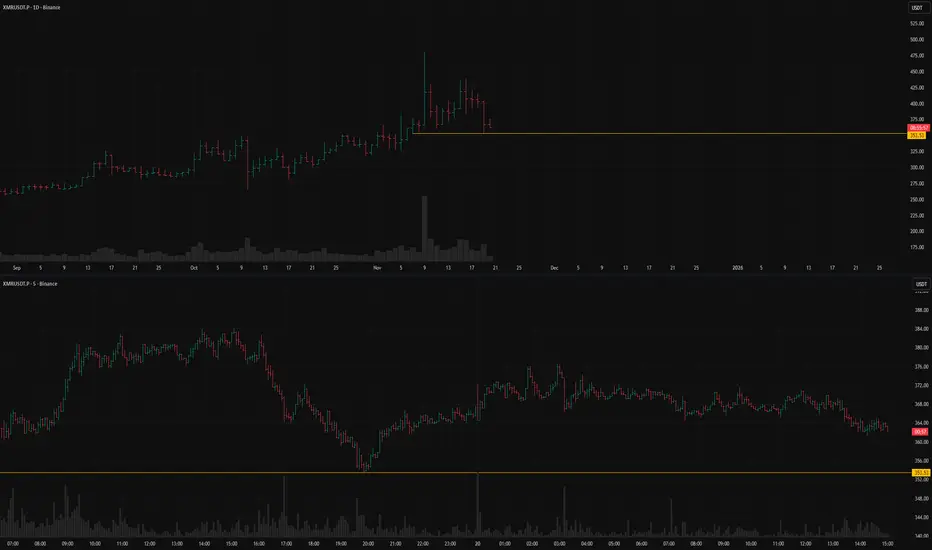
XMRUSDT: short setup from daily support at 353.53BINANCE:XMRUSDT.P is respecting the 353.53 level very well. Yesterday we saw two bounces, with the correction getting smaller each time. Throughout today, we've seen consolidation above the level with a gradual drift lower. This is a good signal: it suggests the seller is confidently and calmly moving the price in their direction, absorbing the buyers' limit orders along the way. If this type of price action continues right up to the level — that’s ideal. If volatility spikes, it spoils the picture a bit, and we’ll have to watch how the price behaves after the volatility settles.
Key factors for this scenario:
Volatility contraction on approach
Momentum stall at the level
Immediate retest
Repeated precise tests of the level
Consolidation with price compression
Closing near the level
Closing near the bar's extreme
Factors that contradict this scenario:
Heavy congestion zone ahead
Was this analysis helpful? Leave your thoughts in the comments and follow to see more.
Monero Wave Analysis – 20 November 2025
- Monero broke pivotal support level 350.00
- Likely to fall to support level 316.00
Monero cryptocurrency recently broke the pivotal support level 350.00 intersecting with the 61.8% Fibonacci correction of the upward impulse from the start of October.
The breakout of the support level 350.00 accelerated the active impulse wave c – which started earlier from the powerful resistance level 425.00.
Monero can be expected to fall further to the next support level 316.00, former low of wave iv from the start of November.

XMR USDT LONG SIGNAL---
📢 Trade Signal – XMR/USDT
📈 Position Type: Long
💰 Entry Price: 360.75
---
🎯 Take-Profit Targets (Partial Exits)
TP1 = 366.00
TP2 = 376.20
TP3 = 387.95
TP4 = —
TP5 = —
TP6 = —
---
🛑 Stop-Loss: 350.40
📊 Timeframe: —
⚖️ Risk/Reward Ratio: 2.64
💥 Suggested Leverage: 5× – 10×
---
🧠 Technical Analysis Summary
XMR is bouncing strongly from the 350–355 support range, forming a clean bullish short-term structure.
The 360.75 entry sits inside an optimal demand zone, with bullish momentum building on lower timeframes.
A confirmed break above 366 opens the path toward 376 and 388, where liquidity clusters and major resistance levels sit.
Momentum indicators show improving buyer strength.
---
⚙️ Trade Management
Take partial profit at TP1
Move Stop-Loss to Break Even after TP1 hits
Trail SL as price approaches TP2–TP3
Avoid re-entry if price closes below 350.40
---
⚠️ Disclaimer
This signal is for educational purposes only. Always apply proper risk management.
---
📌 Hashtags for TradingView
#XMR #XMRUSDT #CryptoSignal #TradingView #LongSetup #Altcoins #TechnicalAnalysis #FuturesTrading
---

XMR USDT LONG SIGNAL---
📢 Trade Idea: XMR/USDT
Type: Long
Entry Zone: 399.84 – 409.38
---
🎯 Take-Profit Targets (Partial Exits):
• TP1 = 425.79
• TP2 = 438.22
• TP3 = 452.33
• TP4 = 467.97
• TP5 = 487.50
• TP6 = —
---
🛑 Stop-Loss: 389.85
⏱ Timeframe: 15m
⚖️ R/R Ratio: 4.12
💥 Suggested Leverage: 5×–10×
---
🧠 Technical Analysis Summary:
XMR is holding strong support inside the 399–409 demand zone, showing bullish reaction and accumulation.
Break above 425.7 may trigger momentum toward 438 → 452 → 468, with extended targets near 487.
RSI is rising from oversold conditions and the price is reclaiming EMA20/EMA50 — confirming a potential bullish continuation wave.
---
⚙️ Trade Management Tips:
• Take partial profit at TP1 and move SL to entry.
• From TP2–TP5, use a trailing stop for safety.
• Avoid entry if price closes below 389.8.
---
⚠️ Disclaimer:
For educational purposes only — manage your capital responsibly.
---
📌 Hashtags for TradingView:
#XMRUSDT #Monero #CryptoSignal #TechnicalAnalysis
#TradingView #FuturesTrading #Altcoins #CryptoSetup
---

Monero swept major liquidity, correction next?Monero swept major liquidity above the previous highs before breaking back under the $424 region. This signals rejection and shifts structure toward a corrective phase.
Acceptance below $424 opens the door for a deeper move toward $291, where the 0.618 Fib and daily support meet in strong confluence.
Key Points:
Liquidity sweep above highs then rejection
Breakdown below $424 signals weakness
Next support at $291 with 0.618 Fib
What to Expect:
A corrective move toward $291 is probable unless XMR reclaims $424 quickly.

$XMR (DAILY): HIDDEN BULL RSI divergence, PRICE DISCOVERYDay 8 in this CRYPTOCAP:XMR long position ($374) and obviously this is my only leveraged LONG. My first TP was placed 1% below the INVERTED HEAD&SHOULDERS target ($475) and missed by $5, literally - so unlucky, as the new ATH was established at $470.
The DAILY chart is still in WAVE 5 and we've seen yet another HIDDEN BULL RSI divergence (horizontal lines; 5 out of the previous 6 of these divergences led to rallies and RSI crossing above 90). Currently RSI = 75, a bit overbought but with enough room for a solid rally.
The 4-HOUR and 8-HOUR charts also show the active WAVE 5 with two most probable targets: $477 and $549.
So, my 3 partial TAKE PROFIT levels remain: $475, $544, and a moonbag.
STOP LOSS strategy has been adjusted a bit: I'm going to manually close in 3 parts below the 50 MA ($333 atm and rising = a superb dynamic SUPPORT).
#Monero is an asset I'm currently the most bullish on - and have been for weeks, as you know. Nothing has changed.
👽💙

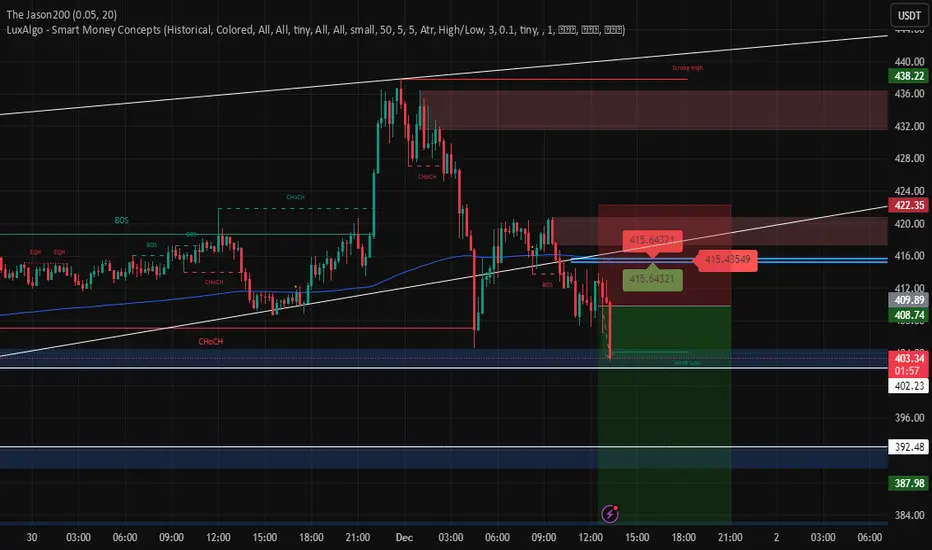
XMRUSDT – Clean SMC + Price Action AnalysisXMRUSDT is clearly in an uptrend, and we already witnessed a strong Break of Structure (BOS). After the BOS, price pulled back into the imbalance (IDM) region, which gives us a high-probability setup in the direction of the trend.
The trendline support is holding well, and the market continues to respect higher highs and higher lows. As long as the IDM zone is protected, buyers remain in control.
Trade Setup
Entry: 391.17
Stop Loss: 483.60
Take Profit 1: 400.87 (1:1 RR)
Take Profit 2: 430.99 (4.5 RR)
I used Smart Money Concepts (SMC) combined with pure price action, and this setup has a higher probability of playing out in our direction if the entry gets triggered.
The overall structure, trendline support, and IDM sweep all align perfectly for a continuation move.
