Extended Scinario to Fall Zone from 8.5This scenario appears more plausible to me personally, and confirmation of it should emerge in March 2026 if the critical buying zone is reached. The period from March to April could represent a very strong buying opportunity, potentially serving as the final upward move toward the 8.5 area.
This reflects a personal opinion and general market perspective only. It is not investment, trading, or financial advice, and should not be interpreted as a recommendation to buy or sell any asset.
Market insights

Natural Gas Market Signaling a Fresh Bullish Opportunity?🔥 XNG/USD – Natural Gas Bullish Swing Trade Play | Energy Momentum Setup 🔥
📌 Asset
XNG/USD – NATURAL GAS
Energies & Commodities Market
⏳ Trade Type: Swing Trade
🧭 Market Plan
📈 Bullish Bias Active
Natural Gas is showing upside continuation potential, supported by energy-sector momentum and price acceptance above key demand zones. Bulls are currently in control while volatility expands.
🎯 Entry Strategy
🟢 Flexible Entry Allowed
You may enter from any favorable price level, aligned with your own execution model.
This setup supports scaling or single-entry styles, depending on risk preference.
🛑 Stop Loss
🔻 Reference SL: 3.500
⚠️ Risk Note:
Dear Ladies & Gentlemen (Thief OG’s),
This is not a mandatory stop loss. Always adjust your SL based on:
Position size
Volatility
Personal risk management rules
💡 Capital protection comes first.
🏆 Profit Targets
🎯 Target 1: 4.500
🎯 Target 2: 5.200
📊 Why Take Profits Here?
Strong historical resistance zones
Overbought conditions likely near targets
Liquidity traps often appear at these levels
➡️ Book profits smartly and don’t get greedy.
⚠️ TP Disclaimer:
This is a guideline, not a command. Secure profits based on your own strategy.
👀 Related Assets to Watch (Correlation Check)
⛽ WTI Crude Oil (USOIL / WTI)
Positive sentiment in energy markets often supports Natural Gas
Rising oil prices can lift overall energy demand expectations
🛢️ Brent Crude (UKOIL)
Global energy benchmark
Strength in Brent usually confirms broad energy-sector bullishness
🇺🇸 DXY – U.S. Dollar Index
Natural Gas is USD-denominated
Weak USD = tailwind for commodities
Strong USD may slow upside momentum
📊 Energy Sector Index / Energy Stocks
Institutional flows into energy equities often precede commodity strength
Watch for sector-wide risk-on behavior
🧠 Final Notes
✅ Trade with confirmation
✅ Respect volatility
✅ Manage risk aggressively
✅ Profits > Ego
If this idea adds value, hit 👍 Like, 💬 Comment, and ⭐ Follow to stay ahead of smart money moves.
Trade safe & trade sharp. 🚀💰

Is Natural Gas Bull Market Back? Natural gas saw an epic bounce today as 3 major weekly moving averages were defended.
Price action rallied sharply higher off the weekly 20, 50 & 200 MA.
This could be a massive bullish back test before we bounce back to new highs.
Resource stocks showed impressive strength during a day when markets were under pressure.
We have been nibbling on resource stock like we have said in our videos.
Inventories are tomorrow which could set the tone for the next bull rally.

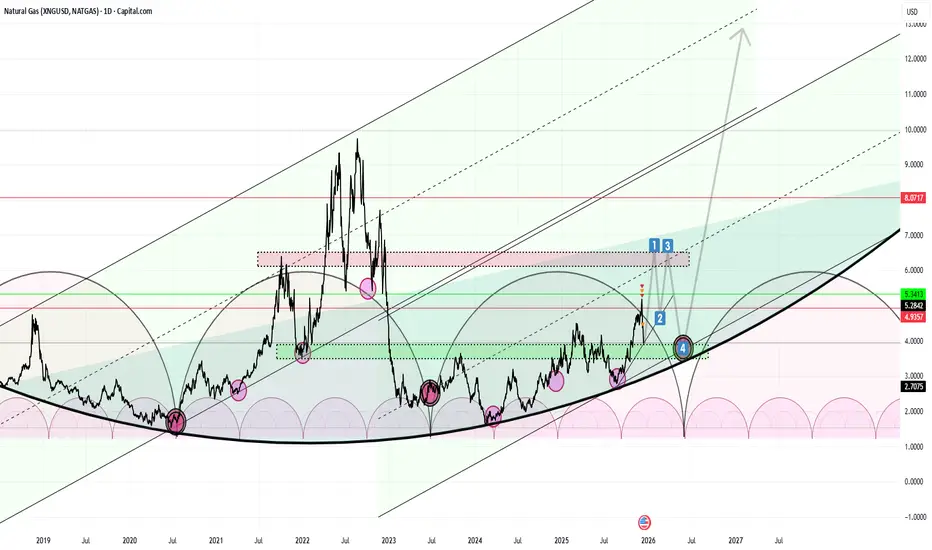
Long-Cycle Market Observation-4 steps all we needThis discussion is intended as a personal analytical framework rather than financial or trading advice. Its purpose is to highlight rare, high-impact market opportunities and to avoid unnecessary conflicts between competing scenarios, particularly around the potential double-top region near 6 to 6.4.
The focus is on four specific, numbered time windows:
1-January
2-February
3-March
4-June
These four periods alone are considered sufficient, from a purely hypothetical and educational perspective, to capture major market movements through 2026, without the need for frequent activity.
The underlying idea emphasizes restraint rather than constant engagement. Overexposure and excessive activity are viewed as the primary risks, while patience is regarded as the key factor. Upon reaching the fourth phase, the concept shifts away from short-term realization and toward a long-term, multi-year approach, allowing positions to evolve across multiple cycles instead of being closed prematurely.
This framework reflects a personal market philosophy focused on discipline, timing, and long-term perspective, and should be understood solely as a conceptual discussion.
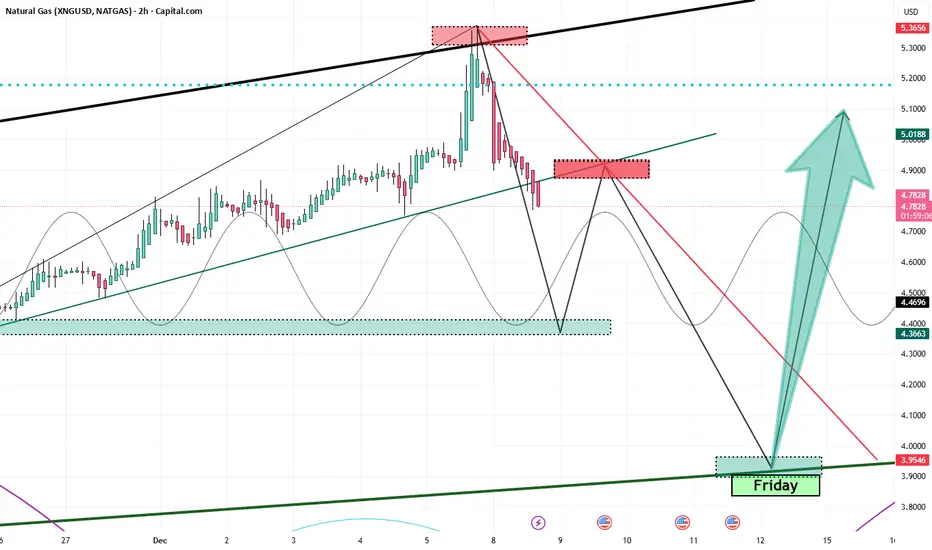
Wild Friday and the Weekly HammerFrom a technical-geometric standpoint, Natural Gas is approaching a high-confidence inflection zone. The weekly hammer forming into Friday’s close (12.12.2025) signals potential exhaustion of the recent downside leg and early signs of demand stepping back in.
Descending from 5.33 as expected, the move has unfolded cleanly, and the red candle opening on Monday—exactly in line with the anticipated flow—reinforces the directional bias of the current retracement phase
The end-goal for this corrective leg is anchored at 3.90, which stands out as the dominant liquidity objective. The structure shows a high—if not near-certain—probability of a retracement into that zone, consistent with the broader technical roadmap already outlined.
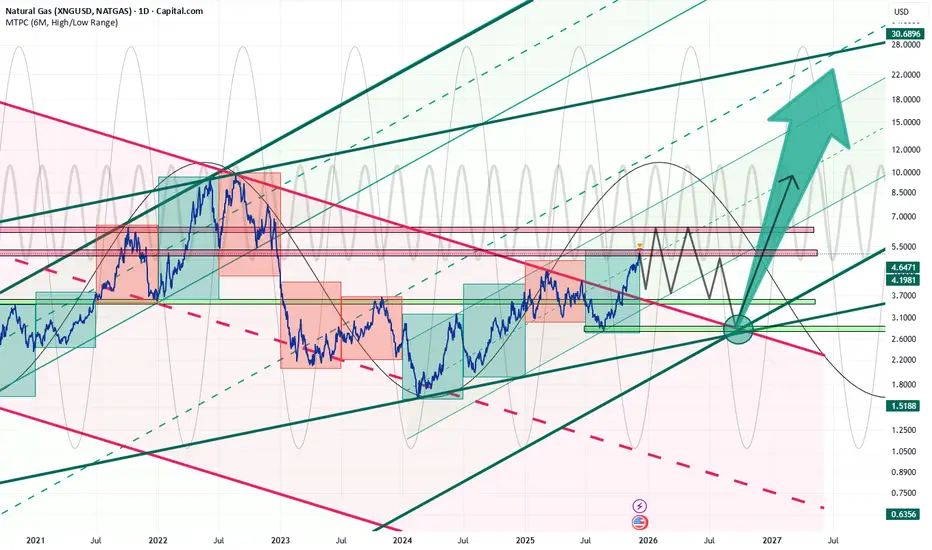
The Undeniable Chart of EverythingJune 2026 – A New Era: $3.2, the Price of No Return
This chart speaks for itself. Based on my experience and a clear reading of market dynamics, the rapidly accelerating demand for natural gas represents a structural shift rather than a temporary cycle. Natural gas is no longer merely a bridge fuel; it is becoming a foundational pillar of future energy systems, technological expansion, and global economic stability.
Natural gas is essential for powering next-generation data centers and AI infrastructure, where uninterrupted, high-density energy supply is non-negotiable. It plays a critical role in stabilizing renewable energy grids, providing rapid-load backup for wind and solar as electrification accelerates worldwide. In hydrogen production, natural gas remains the primary feedstock for blue hydrogen, enabling large-scale decarbonization of heavy industry long before green hydrogen reaches economic viability.
Beyond electricity, natural gas is indispensable in advanced manufacturing, petrochemicals, fertilizer production, and clean steel technologies. LNG continues to reshape global energy security, particularly in Europe and Asia, where long-term supply contracts are locking in demand well into the next decade.
Against this backdrop, a price level of $3.2 is not just undervalued — it represents a historical inflection point. As supply constraints tighten and demand growth becomes embedded, this is a price the market is unlikely to revisit. The era ahead is defined by scarcity, strategic relevance, and repricing.
The three highlighted danger zones mark areas where multiple sell cycles converge. These zones are historically risky for initiating long positions and instead represent optimal regions for identifying potential short or sell setups. A reversal from the darkest zone can unfold rapidly, often materializing as a single large bearish candle or two consecutive bearish candles on the weekly timeframe.
This reflects a personal opinion and general market perspective only. It is not investment, trading, or financial advice, and should not be interpreted as a recommendation to buy or sell any asset.

NAT-GAS World Cup 2027. ist Possible ??The chart was created purely out of curiosity to determine whether it might be possible. An idea that may seem unusual or unprecedented does not, in itself, invalidate its potential.
First time i have sugested the idea was in 2024 was also so crazy. but is it ?

Natural Gas Bullish Shift OutlookDetailed View
Natural Gas has completed its corrective downtrend phase.
Price has decisively broken the falling trendline, signaling loss of seller control.
The demand zone near 3.69 held firmly and created a higher low.
This zone now acts as a structural base.
The Micro Flip Zone marked the intent shift area where selling pressure got absorbed.
Acceptance above this zone confirms a change in market behavior.
Momentum is gradually turning positive as buyers step in earlier on pullbacks.
As long as price holds above 3.69, the structure remains bullish.
Immediate resistance lies near 3.90 followed by the 4.00 psychological zone.
A sustained move above 4.00 can accelerate upside momentum.
If price slips below 3.69, bullish structure fails and the market may turn neutral again.
Until then, the old downtrend outlook is invalid.
#HMO #HappeningMarketOfficial

Natural Gas (NG): The Freestyle Framework Natural Gas: The Freestyle Landscape
This is not a forecast. It is a dynamic structural map.
Designed for the discretionary trader, this "Freestyle" framework deconstructs Natural Gas into its core technical components: cyclical rhythms, evolving Elliott Wave structures, adaptive price channels, and multi-layered zones of confluence.
We provide the architecture; you dictate the strategy.
Within This Framework, You Will Identify:
- Cyclical Turning Nodes: Time-based projections where trend exhaustion or acceleration is statistically heightened.
- Price Channel Evolution: Visualizing the market's breathing pattern through expanding and contracting volatility corridors.
- Confluence Zones: High-Probability regions where support/resistance, Fibonacci projections, and channel boundaries cluster, defining the market's true decision points.
- Momentum & Risk Gradients: Areas shaded for potential trend acceleration or reversal, framing asymmetric risk/reward opportunities.
The Core Philosophy: Trade Context, Not Clarity.
This map eliminates the noise of directional bias. Instead, it provides a professional-grade canvas to:
Plan high-probability setups within predefined zones.
Anticipate volatility shifts before they occur.
Objectively manage risk by highlighting invalidation levels.
Align your unique strategy (swing, position) with the market's inherent structure.
Disclaimer: This analysis is for informational and educational purposes only. It is a framework for context, not a substitute for independent analysis. All trading decisions and risk management are solely the responsibility of the individual. Past performance is not indicative of future results.
Trade The Reaction. Navigate The Structure.

Natural Gas: Bullish Draw, Bearish RealityThe EIA surprise was bullish (−177 vs −170), yet no rally materialized. Traders are placing stronger faith in the weather driver.
CPC hints at substantial warming across key regions. The market has chosen to price in an anomalously warm end to December and a probable warm start to January. The anticipated gas deficit failed to materialize. High production and warm weather are outweighing the strong withdrawal.
Now that the price is approaching the round number of 4.00, many will begin profit-taking on shorts, which will trigger a local upward bounce.
Do not buy now; trying to catch the bottom runs the risk of receiving a 'second bottom' as a gift.
WAIT for a pullback to the 4.200 — 4.30 zone.
This zone represents the middle of the descending channel + a Mirror Level (former support turned resistance) + EMA50.
If the price breaks 4.350 with a sharp impulse and consolidates above it, this breaks the H2 descending channel structure. In that case, the short is cancelled. Switch to 'wait-and-see' mode. Re-evaluate fundamentals; news regarding a polar vortex or freeze-offs may have emerged.
Support 1: ~4.00–4.05 — the lower edge of the current sell-off and a zone of past local highs/consolidations. Support 2: ~3.75–3.80
Resistance 1: ~4.20–4.30 — recent local high zones prior to the drop. Resistance 2: ~4.45–4.60"

#NATURALGAS Not staying below 4.250, we could see more blast!!4.250 is the 1.618 level of wave 3, as far as this level could hold, we see the instrument retesting fridays high. We are buying with this condition as SL,Let see!! CAPITALCOM:NATURALGAS

2026 retirement plan.The broader market structure suggests that 2026 could mark the lowest price level ever observed in natural gas, driven not by weakness, but by extraordinary global demand—particularly the explosive energy requirements of large-scale AI data infrastructures.
A double-top formation appears increasingly inevitable, supported by highly precise geometric alignment across multiple resistance and support zones.
This is not a trading call, but the result of a multifaceted, rigorously detailed market analysis viewed from several technical and structural angles.

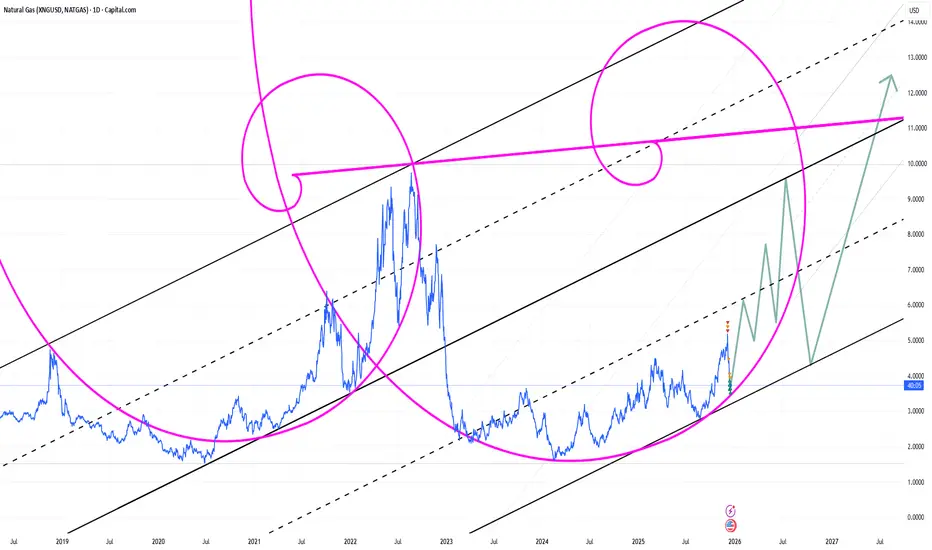
What Fibonacci trying to tell us !!!!!!In the markets, the Fibonacci spiral isn't just a pattern—it's an engine of momentum. It reveals where price action compresses, aligns, and ultimately explodes.
Think of a consolidation near a key Fibonacci level (like the 61.8% or 38.2% retracement) as the spiral winding tighter. This isn't random noise; it's energy being stored, a structural reformation where the market's natural growth geometry reasserts itself.
The moment price breaks decisively from this zone, it triggers the spiral's accelerating phase. This is why Fibonacci structures are powerful tools for identifying the launch point of sharp, impulsive moves—not for forecasting slow, grinding trends. They pinpoint where potential energy converts to kinetic momentum, offering a high-probability entry for capturing rapid expansion.
Are we in a Big Channel ?Curiosity chart: By clearly identifying all major abrasion events, this chart reveals the most favorable buying opportunities within the channel, assesses whether the channel is likely to hold, and, if so, indicates the probable next direction and overall market trajectory.
Natural Gas Week 50: -183 BCF Draw – Coldest Start in Years*Due to the platform's features, the charts are arranged in sequence from left to right, from the first to the ninth chart. The charts were created by our team and based on an analysis from Bloomberg and the EIA data. This analysis was conducted in cooperation with Anastasia Volkova, analyst of LSE.
Natural gas entered Week 50 with a historic shift, as the EIA reports a record 183 BCF storage withdrawal for Week 49 (December 5), crushing the 5-year average draw of -72 BCF and leaving inventories at 3,740 BCF-34 BCF below 2024 but still 56 BCF above the median. Cold weather and peak LNG exports earlier drove January futures above $5/MMBtu, but softening forecasts for mid-December have triggered profit-taking, easing near-term prices while 2026-27 contracts hold above the interquartile range.
Current prices compared to price dispersion 10 days before expiration by month since 2010
Last week, cold weather and record LNG flows provided strong support for prices. The situation has now evolved, with signs of a correction due to profit-taking and a softening of weather forecasts for the second half of December. However, fundamental drivers (a prolonged cold spell in key regions, peak LNG exports, and growing demand from the energy sector) remain in place and are keeping 2026 and 2027 contract prices above the interquartile range.
Forward curve compared to 2020-2025
The shape of the 2025 forward curve on nearby contracts is once again approaching the 2023–2024 ranges. Despite high volatility on nearby contracts, contracts with delivery in two years and beyond continue to show clear price stabilization at historically stable levels.
Current stocks and forecast for next week compared to 2020-2024
According to the forecast for week 49 (EIA report dated December 5), gas reserves in underground storage facilities will decrease by a record 183 BCF, which is 111 BCF below the average for the past five years. At the same time, reserves will reach 3,740 BCF, which is 34 BCF lower than in 2024, but 56 BCF higher than the five-year average.
HDD+CDD based on current NOAA data and forecast for the next two weeks compared to 1994-2024
Currently, the total HDD + CDD (heating and cooling degree days) indicators for all climatic regions of the United States are within the moderate range relative to the 30-year climate norm. According to meteorological model forecasts, degree days are expected to increase after December 11, reaching maximum levels by December 14-15, after which they will begin to decline, and by December 17-19, values may fall below seasonal norms.
HDD+CDD based on current NOAA data and forecast compared to 1994-2024 by region
As of December 10, another peak in degree days is expected in the coming week, with values exceeding the upper interquartile range in the central regions of EN, ES, WN, WS, and South Atlantic. After December 18, the weather is expected to stabilize and return to average levels and below.
Daily supply/demand difference compared to 2014-2024
On December 10, the difference between supply and demand in 2025 declines after abnormal growth and approaches the upper interquartile range for 2014–2024.
Number of days for delivery from warehouses
The graph shows the number of days of supply based solely on storage reserves, at current consumption levels. As of December 10, reserves are sufficient for approximately 27 days, which is three days less than in 2024, seven days below the average, and at the lower end of the 10-year range. With this level of reserves and consumption, even minor disruptions in production or spikes in demand could cause sharp price reactions, especially in late winter and early spring.
Filling level of European storage facilities
The overall fill rate of European gas storage facilities as of December 10 continues to decline and stands at 71.5% (-4.4% over the week), which is 10.5% below the average fill rate and 10% lower than last year.
Electricity generation by source
Compared to last week, gas generation in the US48 energy balance fell to 38.4% of the total (-5% over the week) on December 10, 2025. The share of nuclear generation remains around 18-19% and is below the 5-year low. The share of coal generation has grown and remains at an average of 19-20%. The share of wind (11.3%) and solar (4.0%) has increased slightly compared to last week.

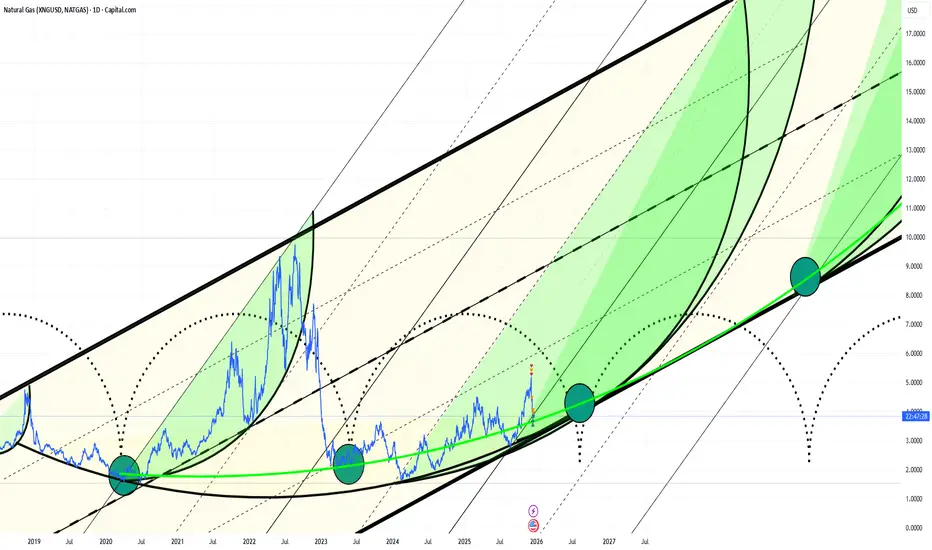
THE SETUP: 2026 CUP and Handel Formation (most realistic)This observation has crossed a threshold.
It is no longer merely "trading ideas" or speculative commentary.
We are witnessing the most structurally significant formation of the cycle a multi-stage Handle and Channel Convergence setting the stage for a historic move.
The alignment of a historic Cup & Handle replication, within a 10-year Fibonacci framework, at the meeting point of macro channels, creates a scenario that demands a higher level of consideration. It presents a probability that is now too significant to ignore.
Phase 1: The Final Exhaustion Drop
Price is rejected from the massive 8.0 resistance wall. This isn't just a normal pullback.
Why it drops fast: This sell-off represents the final liquidation wave of the previous bear cycle. Weak hands capitulate, and late sellers scramble for the exit, creating a sharp, high-volume descent into the formation. This rapid drop is necessary to flush out the last remnants of selling pressure.
Phase 2: The Energy Channel (The "No-Return" Zone)
The price enters the Handle channel, a defined equilibrium zone where the final sell orders are absorbed.
This is where the major trend channels converge. Once price consolidates here and breaks north, there is no logical support left to retest—it becomes a one-way trajectory. The "no-return point."
Phase 3: The Launchpad
This entire structure acts as a rocket launch base, compressing energy for the next macro leg up confirming a bogger Fibonacci. The completion of this base targets a powerful ignition in January 2027.
This is not trading advice or signal at all
This is the identification of a mathematical and structural precedent that now stands, clear and present, on the chart. The responsibility for any action taken—or not taken—rests solely with the individual.
The market is a mechanism.
This is how its gears are aligning.

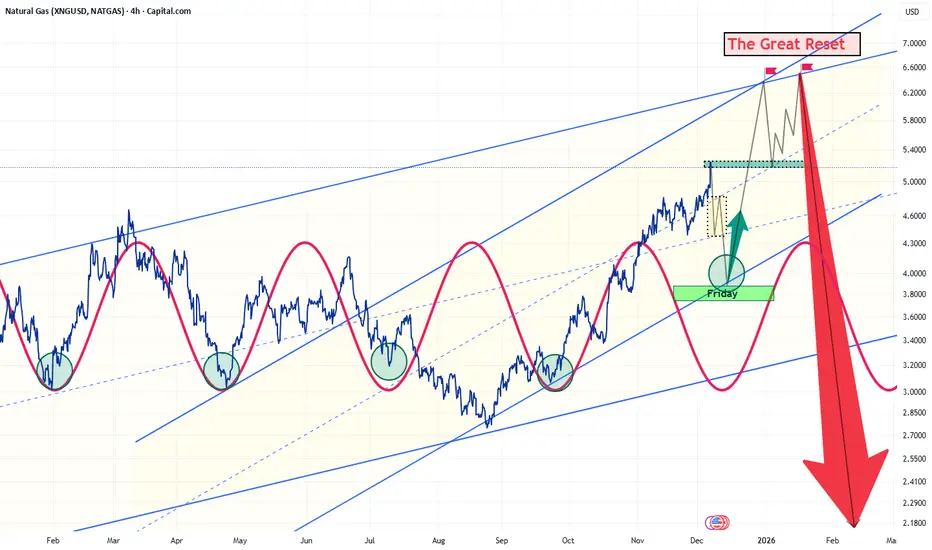
The Great Channel: The Great Reset from 9.5A Once-in-a-Decade Market Opportunity
The Great Channel thesis presents a compelling long-term market structure that is becoming increasingly difficult to ignore. From a macro-technical perspective, current price action suggests we may be trading at, or extremely close to, the lowest valuation level we are likely to witness over the next decade. Even the next cyclical low, should it occur, may still print at levels higher than today’s price.
This outcome is not guaranteed, but it represents one of the most probable scenarios on the table and one that now carries more conviction than ever before. The concept of the Great Channel first emerged in 2024 as a theoretical framework; however, evolving market behavior indicates that it may now be transitioning from hypothesis into structural reality. If confirmed, this channel has the potential to reprice the market into entirely new regimes.
Importantly, this structure does not conflict with the broader cup-and-handle formation that many long-term participants are tracking. On the contrary, the two patterns may be complementary, with the cup-and-handle reaching full maturity only after a potential Great Reset event. Such a reset could occur near the extreme boundaries of the Great Channel, precisely where asymmetric risk-to-reward conditions are most favorable.
From this vantage point, current levels may represent the most attractive strategic accumulation zone we are likely to see for many years to come. For patient, long-term traders and investors, this region offers a rare alignment of macro structure, technical positioning, and cyclical timing—an opportunity that may not present itself again for a very long time.

Remember the Septembers (( SEP.2026 and SEP 2027 ))SEP.2026 and SEP 2027 two no turning points in the most timely correct virsion of the Cub and Handel formation till now.
This observation has crossed a threshold.
It is no longer merely "trading ideas" or speculative commentary.
We are witnessing the most structurally significant formation of the cycle a multi-stage Handle and Channel Convergence setting the stage for a historic move.
The alignment of a historic Cup & Handle replication, within a 10-year Fibonacci framework, at the meeting point of macro channels, creates a scenario that demands a higher level of consideration. It presents a probability that is now too significant to ignore.
Phase 1: The Final Exhaustion Drop
Price is rejected from the massive 7.5-8.0 resistance wall. This isn't just a normal pullback.
Why it drops fast: This sell-off represents the final liquidation wave of the previous bear cycle. Weak hands capitulate, and late sellers scramble for the exit, creating a sharp, high-volume descent into the formation. This rapid drop is necessary to flush out the last remnants of selling pressure.
Phase 2: The Energy Channel (The "No-Return" Zone)
The price enters the Handle channel, a defined equilibrium zone where the final sell orders are absorbed.
This is where the major trend channels converge. Once price consolidates here and breaks north, there is no logical support left to retest—it becomes a one-way trajectory. The "no-return point."
Phase 3: The Launchpad
This entire structure acts as a rocket launch base, compressing energy for the next macro leg up confirming a bogger Fibonacci. The completion of this base targets a powerful ignition in SEP. 2027 with a total confirmation of the Channel.
This is not trading advice or signal at all
This is the identification of a mathematical and structural precedent that now stands, clear and present, on the chart. The responsibility for any action taken—or not taken—rests solely with the individual.
The market is a mechanism.
This is how its gears are aligning.

Natural Gas Strong Downtrend OutlookNatural Gas continues in a strong downtrend with price respecting the falling trendline on the thirty minute chart. Every move toward the trendline and supply zones faces selling pressure, confirming control remains with the sellers.
Price is currently consolidating above the 4.04 to 4.05 support zone, but the bounce still looks weak and lacks strong volume. This shows that buyers are not taking aggressive control yet.
The first major resistance remains at the 4.20 zone and the trendline. A clean breakout above this area is needed to shift momentum. Until then the structure stays bearish.
If price breaks below 4.04, the next support sits at 3.90 to 3.91. Further weakness can take price toward the deeper green zone at 3.76 to 3.80.
Key Resistance Zones: 4.20, 4.36, 4.50
Key Support Zones: 4.04, 3.90, 3.76
Overall bias remains bearish unless price breaks and sustains above the falling trendline.

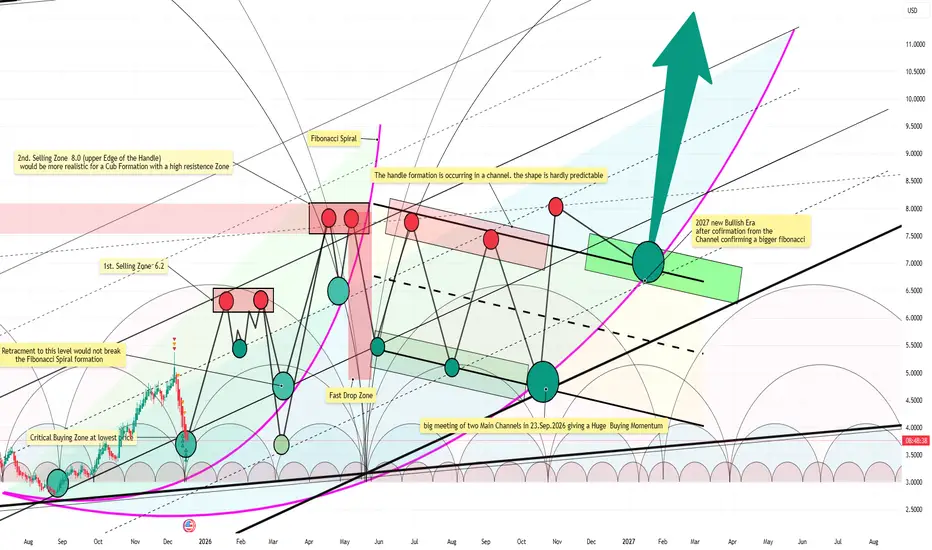
Geometrical Projection 2026: a New Bullish Era Sep.2026By early 2026, we anticipate the emergence of a new six-month green candle. Following this, a downward correction is expected, with the possibility—though not certainty—of forming a second peak in May. Ultimately, the projection points toward a retest of the bottom of the current six-month candle, signaling an exit from the five-year descending channel and defining the lower boundary of a new ascending channel. By September 2026, geometric patterns and buyer alignment suggest the potential onset of a new bullish era.
the Big Picture, and the next Friday weekly HammerFrom a technical perspective, Natural Gas is nearing a high-conviction inflection point. The weekly hammer that will be formed into Friday’s close (12.12.2025) indicates a potential shift in market structure following the optimal accumulation zone around 4.9. This configuration favors a sharp, impulsive rally over the next 2–3 weeks, with a likely target at the long-term channel resistance near 6.4. The emerging double-top formation suggests a setup for a notable momentum reversal.
On the macroeconomic side, the ongoing “Great Reset” is expected to exert downward pressure across major risk assets over the next six months. Volatility is rising, and global markets are entering a corrective phase.
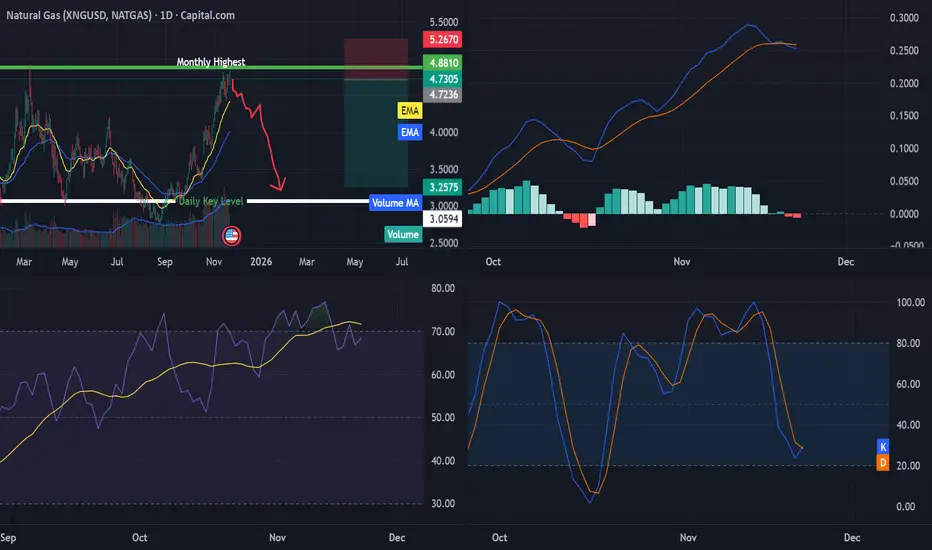
Natural Gas (NG) – Multi-Timeframe Technical AnalysisNatural Gas (NG) – Multi-Timeframe Technical Analysis
Monthly (1M)
Price has pushed into the 4.80 zone, which corresponds to the previous major monthly high. The last three monthly candles are bullish, showing strong upward momentum, but NG is now entering a significant historical resistance area.
Weekly (1W)
Volume is rising, indicating strong participation. Price bounced cleanly from the retest zone, and the current candle remains green, but buyers are now encountering notable resistance at the top of the range.
Daily (1D)
Clear wick rejection around 4.85, showing that sellers are defending this level.
MACD is showing mild crossovers and losing momentum.
RSI is overbought and making a bearish crossover — often a sign of short-term exhaustion.
4-Hour (4H)
A potential double-top pattern is forming at the 4.85 resistance, which supports the idea of weakening bullish momentum on the lower timeframes.
Natural Gas remains bullish on higher timeframes, but the 4.80–4.88 zone is acting as a strong resistance cluster. Lower timeframes are already showing signs of momentum fading.
If bulls fail to break above 4.88, a short-term correction is likely.
A clean breakout above this area would invalidate bearish signals and could open the next leg toward higher Fibonacci levels.