INSIDE BAR Strategy Short on PalladiumStill short on my XPDUSD position, trailing the stop above prior days high.
Entry for the short was the break below a inside day bar below 18 moving average on a daily bar...
XPDUSD trade ideas

#palladium : support buy levelwe hit support and partial rebound today , despite low cars activity, it could be good entry for palladium 2200 level , my entry

PALLADIUM, SHORTIt seems that PALLADIUM has started mega downtrend as the falling wedge shows. And the downtrend should continue until the price reaches sun-golden line.


Palladium SHORT looking for exits18 SMA Entry on Palladium worked out this time.
On this market there is usually a rally on new lows so looking forward to exit above prior days high...

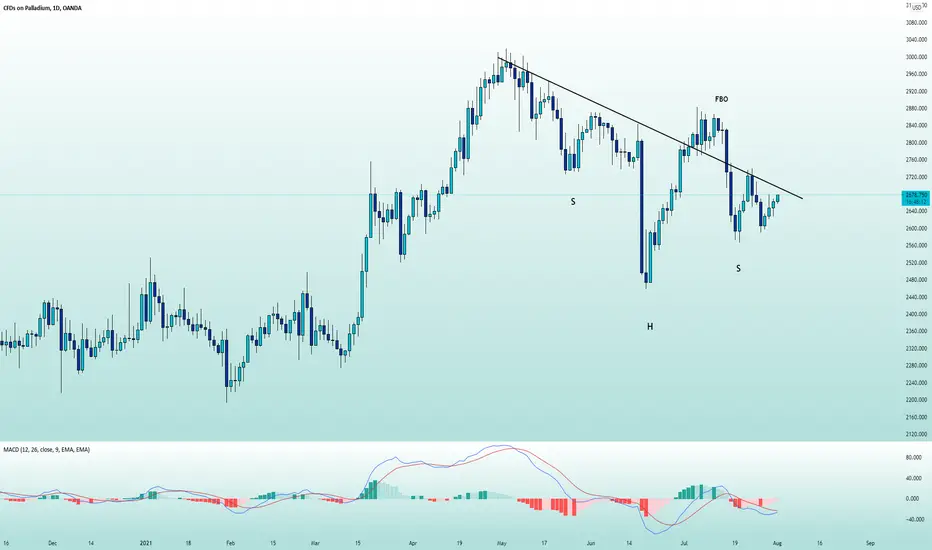
Palladium: aiming for its 200-day?A price action above 2400 supports a bullish trend.
Further support from the bullish MACD crossover, confirming a change in trend direction to bullish.
Trend strength suggests a strong trend gaining strength.
Upside price momentum supports the bullish trend.
RSI leaves enough room for upside potential.

Palladium look for 2345 areaAs for Palladium, lower TF, I will go short to 2345 area (161.8) then look for LONG to 2463.82 (161.8) & extension 2537 (261.8) area.
TAYOR

PalladiumWednesday, 25 August 2021
3:39 AM (WIB)
Technical Analysis
I’ve been watching and trading Palladium in short time trading session. I was curious with Weekly and Monthly trading session, and found some very important clues about Palladium dynamic movement.
Strangely, since 2016 Palladium MACD lines always running and fly high above 0. And hard to see the Lines fall below 0. of MACD lines. This indicating Palladium have very strong of Bullish movement since 2016, or $524. Until it crashed from $2884 into $1500 area. From the crashed, Palladium developing Ascending Parallel Channel with top of resistance at $3000 area. And then fall again into $2258, which is the lowest support of ascending channel. Meanwhile, the Fibonacci Retracement show about 0.5 or 50% was the target from the Traders and Investors.
Although Palladium is trading inside the ascending channel, there was a sign of downtrend lines that could lead the price into the 2nd very strong support at $1500 again. While Monthly trading session show Palladium is on downtrend with Bears control in Weekly and Monthly frames. The downtrend resistance seems hard to breaks up by Bulls. This because the top of resistance is near $2565 area, or near below 0.236 F / 0.786 F.
For the continuation of downtrend, it has to breaks down the lowest support lines of ascending channel. So, in my view Palladium now trading from 0.236 F – 0.382 F into 0.5 F. With more possibility downtrend continuation.
Keep watch and keep notes.
Best regards,
RyodaBrainless
“Live to Ride and Ride to Live”

PalladiumWednesday, 18 August 2021
22:10 PM (WIB)
Palladium broke the support lines of ascending channel, and broke the lowest point at $2444.
I'm expecting the price continue to fall into the 1 F ($2200), according Oversold in daily trading session, and weekly trading session.
Keep watch intense and notes.
Best regards,
RyodaBrainless
"Live to Ride and Ride to Live"


Palladium weekly view...Green zone around 2450... is immediate support level... below this... sizeable pullback coming..😉 for atlist 15-20%.... no new investment buy at this level...


XPD/USD 4h analysis possible buy Hello everyone , as we all know the market action discounts everything :)
The XPD/USD seem to continue its movement in an upward channel, there are 3 different scenarios that am seeing the right now :
1_The price will drop down to the old resistance line which is the support line now at 2712.474 and then bounce back up and maybe breaking the new resistance line at 2747.800 which if that happen thats a great bullish mark , where we could use it to trade breakouts.
if you dont know what is a breakout then watch this
2_The price would continue the bullish movement and reaching the resistance line at 2747.800 and breaking out which could be a great buy opportunity
3_The price will reached the support line at 2712.474 and if the price breakout that support line it would be a confirmation that the price will drop down and it a possible sell signal
Using different indicators showing that the market is bullish so scenarios 1 or 2 is more possible then the 3 :
1_The market price is moving above the MA and EMA (bullish sign)
2_The RSI is at 64,99 showing strength is the market and could be reaching overbought zone at 70 (bullish sign)
3_The MACD seems to be gaining more momentum with the trend going through a positive crossover for now (bullish sign)
Support & Resistance points :
support Resistance
1_ 2719.46 1_2738.34
2_ 2710.04 2_2747.80
3_ 2700.58 3_2757.22
Fundamental point of view :
One-month risk reversal on Palladium (XPD/USD), a measure of the spread between call and put prices, not only snaps a two-day uptrend but also marks the heaviest fall since last Thursday, according to data source Reuters.
A call option gives the holder the right but not obligation to buy the underlying asset at a predetermined price on or before a specific date. A put option represents a right to sell. That said, the daily difference between them slumps to -0.012 by the end of Wednesday’s trading session, per Reuters.
The moves could be linked to the XPD/USD price performance that prints a three-day uptrend of around $2,650 by the press time of early Thursday.
As the options market signal favors the palladium bears, sluggish momentum amid the pre-ECB caution and a light calendar tests the commodity traders. according to fxstreet
_____________________________________________Make sure to Follow and Like for more content_____________________________________________
This is my personal opinion done with technical analysis of the market price and research online from fundamental analysts for The Fundamental point of view , not financial advice.
If you have any questions please ask and have a great day !!!
Thank you for reading.

Palladium Hits Strong Resistance! What Next?Since our last post, palladium has made good progress, moving up $90 to meet the resistance
from February 2020. Price is at an interesting point, because a clean break above and we
should see price move towards the all-time high at $3017.
The weekly 50 simple moving average has aided this gradual upwards move. The first break of
$2875 was short-lived as price came tumbling down and reentered consolidation in April/May.
Price is still in consolidation, and the longer it does so, the bigger the move we can expect
in the direction of the breakout.
So should we see a breakout to the upside, which is the bias as the prior trend was bullish,
we can expect a solid long-term uptrend to unfold.
This is why we want to position ourselves to take advantage of any breakouts that may occur.
It will require some patience while price sets itself up, but the reward will more than make
up for the time sitting on the sidelines.
We will continue to follow the journey of this commodity.
See below for more information on our trading techniques.
As always, keep it simple, keep it Sublime.


Palladium Ready For A Breakout?Palladium looks set to make another attempt at breaking out of the 16 month period
of consolidation, which began in February 2020.
A break above the consolidation high at $2875 was made in April this year, but that
was short-lived as price returned back into the consolidation zone after being forced
down by the $300 round number psychological resistance level.
During the sideways market movement, price has still respected the 50 simple moving
average, which has acted as support, helping price create higher lows.
Last week we had a reversal just around the 50 simple moving average, which was shown
in a recent post, and this week price is gaining momentum and heading towards
resistance at $2875.
If this level is broken then we still have the $3000 round number and the all-time high
at $3017 in the way.
The long-term movement has been bullish prior to the consolidation period, so the bias
is for a break out to the upside.
Should we finally have a breakout, then we should see a linear trend unfold as this
commodity has trended really well in the past.
See below for more information on our trading techniques.
As always, keep it simple, keep it Sublime.

Palladium: further upside potential?The 200-day recently acted as major support and the price action remains above this key level.
Upside price momentum supports the bullish trend.
Above 2650 supports a bullish bias.
RSI leaves enough room for further upside price potential.
Pre-empting trade - adjust risk accordingly.
Profit target: 2900
Stop-loss: 2600

PALLADIUM Excellent long-term buy opportunityPattern: Channel Up on 1D.
Signal: Buy as the price is rebounding after hitting the 1D MA200 (orange trend-line) and the 1 year RSI Support. You can wait for the MACD Bullish Cross to confirm that.
Target: 2950 (top/ Higher High of the Channel Up) and 3300 in extension (1.5 Fibonacci extension as with previous Highs).
** Please support this idea with your likes and comments, it is the best way to keep it relevant and support me. **
--------------------------------------------------------------------------------------------------------
!! Donations via TradingView coins also help me a great deal at posting more free trading content and signals here !!
🎉 👍 Shout-out to TradingShot's 💰 top TradingView Coin donor 💰 this week ==> StockSwinger
--------------------------------------------------------------------------------------------------------

palladium over gold is sending a message of gloom and doompalladium over gold is looking heavy with selling pressure. palladium is positively correlated to risk markets like stocks and crypto while gold is more of a safety asset.

Palladium Bounces After Free FallFollowing the free fall we witnessed in Palladium last week, price has appeared to have
found some form of support just above the 50 simple moving average.
Price does tend to hit the 50 simple moving average, so if we see further declines, we may
see price tag this indicator before seeing a continuation to the upside.
In April this year, price had finally broken out of the 14 month-long period of consolidation
but then struggled to remain above the consolidation resistance level at $2875.
With price back inside the consolidation zone, we need to see another breakout but this
time above the new all-time high at $3017. This would also mean a breakout above the
$3000 round number.
Overall, price is creating higher lows, but as price is still in the consolidation zone, its
behaviour may be unpredictable, which is why we wait for breakouts to confirm trend continuations.
See below for more information on our trading techniques.
As always, keep it simple, keep it Sublime.

Same scallop formation as 2001Palladium is doing a very similar pattern to the asset bubble for palladium going into 2021. Palladium prices are extremely lofty right now and today's price action confirms it.
I've been long on palladium for a long time (see below) but its feeling like a ripe time to close
