Potential BUYSEC case has closed and with news from china over the last two days we've managed to see a big DIP causing the markets to go down, with the new bills that has passed as well in this closing XRP will do a massive break out and go Bullish.
XRP trade ideas

Bitcoin Primed for Growth, Says Advanzia GroupBitcoin has once again ignited bullish expectations among institutional and retail investors alike, following a strong weekly close above key technical resistance levels. Market strategists and on-chain analysts now forecast significant upside potential for the world’s largest digital asset, with several signals pointing to a renewed leg higher in the ongoing crypto market cycle.
According to data from TradingView and Glassnode, Bitcoin closed the week above $117,000, confirming a bullish engulfing pattern on the weekly chart—typically viewed by traders as a strong sign of trend continuation. Momentum indicators such as the Relative Strength Index (RSI) and Moving Average Convergence Divergence (MACD) also suggest that buy-side pressure is building, with limited resistance until the $130,000 zone.
“Bitcoin just posted one of the strongest technical closes of the year,” says Alex Dornfeld, Senior Market Analyst at Advanzia Group, a digital wealth advisory firm. “The macro setup, institutional flows, and price structure all suggest that we may be entering the next wave of strategic accumulation.”
Institutional Capital Re-Emerges
Recent filings with the U.S. Securities and Exchange Commission (SEC) indicate that several hedge funds, family offices, and sovereign wealth vehicles are reactivating exposure to spot Bitcoin ETFs, especially after the June dip created what some viewed as an “institutional buying window.”
The resurgence in capital inflows has been supported by robust derivatives activity. Open interest on CME Bitcoin futures hit a 9-month high this week, reflecting renewed appetite for directional positions among professional traders.
"Liquidity has returned faster than expected," Dornfeld notes. "That alone is an incredibly strong signal that this rally is being built on more than retail enthusiasm."
On-Chain Metrics Confirm Accumulation
Blockchain analytics also support the bullish narrative. Glassnode data shows a surge in long-term holder supply, meaning more BTC is being transferred to cold storage wallets and held for longer durations. Historically, this behavior precedes major price increases, as reduced circulating supply squeezes market availability.
Additionally, net exchange outflows have exceeded $1.3 billion in the past two weeks, a clear sign that investors are positioning for medium- to long-term appreciation.
Advanzia Group: Helping Investors Capture the Upside
In this rapidly evolving digital asset landscape, Advanzia Group is helping investors navigate volatility and capitalize on the upside of the Bitcoin cycle. Through a mix of algorithmic risk management, macro trend analysis, and tailored portfolio strategies, the firm supports both institutional clients and high-net-worth individuals seeking measured exposure to digital assets.
“We believe in disciplined positioning,” says Dornfeld. “Our job is not to chase the market, but to help clients capture asymmetric opportunities like the one currently forming in Bitcoin—without taking on unmanaged risk.”
Advanzia’s latest research bulletin, released to private clients on Monday, outlines an expected range of $130,000–$145,000 for Bitcoin by late Q3 2025, assuming stable macro conditions and continued ETF inflows.
Outlook: The Momentum is Real
While risks remain—including macroeconomic shifts, regulatory unpredictability, and potential sell-offs—many analysts agree that the recent weekly close provides a strong technical foundation for further upside.
Whether Bitcoin reaches new all-time highs in the next few months or experiences interim corrections, the direction of travel appears increasingly tilted to the upside.
And for investors seeking to participate strategically, partners like Advanzia Group are proving essential—turning volatility into opportunity, and market signals into long-term performance.

XRP Eyes $4? Analyst Says ‘Most Profitable Phase’ May Have BegunAs the broader crypto market shows signs of recovery, XRP is once again capturing investor attention—this time with bold forecasts of a surge toward $4.00, driven by technical momentum, market sentiment, and expanding real-world utility.
According to crypto analyst Darren Chu, CFA, founder of Tradable Patterns, XRP may be entering its “most profitable phase” since its 2021 rally. The token has posted a 20% gain over the last three weeks, breaking key resistance levels and displaying stronger correlation with broader altcoin inflows.
“XRP has the ideal confluence of legal clarity, technical breakout, and network traction,” Chu explained in a recent research note. “The conditions now resemble the early stages of major cyclical surges we’ve seen in past bull runs.”
Legal and Regulatory Tailwinds
Since Ripple Labs’ partial legal victory against the U.S. SEC in 2023—where a federal judge ruled that XRP is not a security when traded on exchanges—the asset has regained credibility among institutional players. Multiple crypto funds and ETFs have added exposure, and on-chain wallet growth has accelerated.
This legal clarity has paved the way for Ripple to resume aggressive expansion of its payment corridors, especially in Latin America and Asia-Pacific.
Real-World Utility as a Demand Catalyst
Unlike many Layer 1 tokens with purely speculative value, XRP benefits from real-world utility as a bridge asset for global payments. RippleNet, the enterprise-grade payment network built on XRP, now boasts over 300 financial institutions using or piloting XRP-based settlement infrastructure.
In July, Ripple announced its latest partnership with Banco Bradesco, one of Brazil’s largest banks, to streamline USD/BRL remittances—a deal expected to drive significant volume on-chain.
Analysts note that real-world utility may now be priced into XRP’s valuation at a discount, creating room for catch-up as adoption increases.
Technical Analysis Points Toward Breakout
From a technical standpoint, XRP has breached its multi-month descending channel, with daily trading volume rising 35% over the past two weeks. Analysts are watching the $0.92–$1.00 range as a short-term hurdle. If broken, momentum could accelerate quickly toward $1.50, and potentially as high as $3.80–$4.20, according to Fibonacci-based projections.
“The breakout setup is textbook,” says Chu. “We’re seeing volume confirmation, RSI divergence, and a broader macro narrative—all aligning.”
Risk and Reward: A Balanced View
Of course, XRP is not without risks. Pending SEC appeals, macro volatility, and delays in Ripple’s expansion plans could temper the pace of gains. Still, many investors are betting that the risk-reward profile is increasingly asymmetric in XRP’s favor.
In the eyes of analysts and asset managers alike, XRP is now more than a litigation story—it’s a comeback story.
For those seeking exposure to a large-cap crypto with strong fundamentals, legal clarity, and real-world traction, the message from the market is clear: XRP’s most profitable phase may have just begun.

$300M Bitcoin Options Play by Trump Media Sparks DebateIn a surprising and bold move, Trump Media & Technology Group (TMTG), the company behind the social media platform Truth Social, has announced a $300 million investment in Bitcoin options. The decision has stirred strong market reactions and raised concerns among analysts and regulators about potential conflicts of interest.
According to sources close to the company, the investment is structured through derivatives contracts, focusing on long-term option positions, signaling TMTG’s confidence in Bitcoin’s future price appreciation. The move comes amid growing institutional interest in digital assets and reflects the company’s broader vision of “financial decentralization” and independence from traditional platforms.
However, critics are pointing to a potential conflict of interest. Donald Trump, the face of the company and a highly visible political figure, has previously voiced strong opposition to cryptocurrencies, calling them “fraudulent” and “dangerous.” Now, the very company in which he holds a substantial stake is investing heavily in the asset he once condemned. This contradiction has raised questions about transparency, underlying motives, and the possible use of corporate decisions for political or personal gain.
Financial analysts are split on the matter. Some view the investment as a diversification strategy and a hedge against market uncertainty. Others argue it adds unnecessary risk to a company with an already volatile business model, especially considering its recent public listing via a SPAC merger. The impact on the firm’s financial statements remains to be seen, particularly as the valuation of crypto assets fluctuates rapidly.
From a regulatory perspective, the situation may escalate. The U.S. Securities and Exchange Commission (SEC) has already shown interest in TMTG’s activities, and further scrutiny could follow if political influence over investment strategies becomes evident.
Despite the risks, markets initially reacted positively. Shares of Digital World Acquisition Corp — the SPAC partner of TMTG — saw a short-term spike following the investment news. This suggests that investors, while aware of the uncertainties, remain intrigued by the company’s aggressive posture toward emerging financial technologies.
Ultimately, Trump Media’s Bitcoin investment could be seen as a pivot toward the digital economy. However, given Donald Trump’s increasing political activity and his central role in the 2024 election cycle, this move requires close monitoring by investors and regulators alike. Whether it represents visionary strategy or political entanglement remains to be seen.

Market Dip or Bullish Pause Why These 4 Crypto Still Have StrongAs the crypto market retraced modestly in late July, shedding roughly 5% in total market cap, investors were left wondering: is this a signal of deeper correction—or merely a bullish pause before the next leg up?
According to analysts across leading funds and research firms, the recent dip may be healthy consolidation—and several assets continue to show strong structural momentum, even as prices pull back.
Here are four cryptocurrencies still demonstrating resilience and upside potential:
1. Bitcoin (BTC): Strong Hands, Strong Signals
Despite falling from $131,000 to $115,000, Bitcoin’s long-term holder supply reached an all-time high, with over 70% of BTC unmoved in over 12 months. Derivatives data shows rising open interest and neutral funding rates—suggesting professional positioning, not panic.
“If this is a pullback, it’s one with strong underpinnings,” said Felix Grayson, portfolio manager at Helix Funds.
2. Ethereum (ETH): ETF Flows and Ecosystem Growth
Ethereum continues to benefit from spot ETF inflows and Layer 2 expansion. Gas fees remain low, and total value locked (TVL) on Ethereum-based chains has grown by 9% in July alone.
“ETH’s on-chain activity is diverging from price,” said Melinda Zhou, research lead at TitanAlpha. “That’s usually a leading indicator.”
3. Chainlink (LINK): Real-World Integration Boom
LINK is quietly gaining institutional traction. The token surged 14% month-to-date on the back of Oracle partnerships with global banks exploring tokenized bonds and CBDCs.
Chainlink’s Cross-Chain Interoperability Protocol (CCIP) is also seeing adoption by multiple Layer 1s, strengthening its role as the data layer of Web3.
4. StarkNet (STRK): Layer 2 With Institutional Backing
A newer entrant, StarkNet, is positioning itself as the “ZK-powered” Ethereum scalability solution of choice. With backers like Sequoia and Paradigm, and growing traction among DeFi protocols, STRK has outperformed peers in July with a 27% gain.
“The zero-knowledge narrative is just beginning,” noted Zhou. “StarkNet could lead the next phase of Layer 2 expansion.”
Conclusion
Not all dips are created equal. While short-term price action may test investor nerves, fundamentals across major Layer 1 and Layer 2 networks remain robust and improving. For seasoned investors, these moments offer not panic—but perspective.
As capital returns and development accelerates, expect these four projects to remain at the forefront of the next bullish wave.

Tron Sets Nasdaq Debut After SRM Merger as TRX Overtakes ADATron Inc., the company behind the Tron blockchain and its native TRX token, is preparing for a landmark public listing on the Nasdaq, following its surprise merger with decentralized finance protocol Serum (SRM). The announcement sent shockwaves through the market, immediately catapulting TRX ahead of ADA to become the ninth-largest cryptocurrency by market capitalization.
The newly combined entity, operating under the name Tron Integrated Technologies, has filed its Form S-1 with the SEC, and aims to go public in Q4 2025—marking one of the first blockchain-native firms to emerge from a DeFi merger and enter public markets.
A Strategic DeFi Alliance
The deal with Serum is not just symbolic. It gives Tron deep liquidity infrastructure and decentralized exchange capabilities via Serum’s smart order routing and Solana-based engine. While the Solana connection raised eyebrows, Tron confirmed that a multi-chain expansion plan is in motion, with bridges being built across Ethereum, Solana, and BNB Chain.
“The merger with SRM accelerates our roadmap by three years,” said Tron CEO Marcus Lee. “This IPO isn’t just about capital—it's about positioning TRX as the digital fuel of a multi-chain financial internet.”
TRX Surges Amid Strategic Narrative
Following the merger news, TRX surged 22% over a five-day period, pushing its market cap to over $15.6 billion, surpassing Cardano (ADA) for the first time in over 18 months. Trading volume on centralized and decentralized exchanges spiked by over 60%, fueled by both retail speculation and whale accumulation.
According to data from Glassnode, over 84% of TRX supply is now held in long-term wallets, indicating a strong conviction among holders that the Nasdaq debut could further institutionalize the token.
Regulatory Spotlight and Market Implications
Tron’s Nasdaq listing is likely to put the project under closer regulatory scrutiny, especially given its ties to Asia-based user flows and complex tokenomics. However, sources within the SEC noted that the hybrid model—combining open-source protocol governance with a publicly traded corporate entity—could set a new precedent.
“This may be the template for the next generation of compliant crypto firms,” said Leah Thomason, regulatory analyst at Beacon Partners. “It’s essentially DeFi meets Wall Street.”
Conclusion
With the Nasdaq listing on the horizon, an ecosystem-level merger with SRM, and a strategic push toward interoperability, Tron is rewriting the playbook for token-backed companies. TRX’s leap into the top 10 is more than just a chart movement—it signals that capital markets may finally be ready for integrated blockchain operators.

Titanwhale: XRP as a Bridge Currency Ushers in a New EraAs global financial markets rapidly digitize, the need for instant, low-cost, and scalable cross-border payments is becoming more urgent. One of the key contenders redefining the cross-border payments landscape is XRP, the digital asset developed by Ripple Labs. It is increasingly recognized as a bridge currency capable of transforming international settlements.
According to analysts at Titanwhale, XRP offers a fundamentally different liquidity model—allowing institutions to bypass legacy correspondent banking networks and eliminate the inefficiencies of currency conversion and settlement delays.
XRP as Financial Infrastructure
Instead of converting fiat currencies directly—which requires liquidity and multiple intermediaries—banks and payment providers can leverage XRP as a neutral bridge asset. This model, known as On-Demand Liquidity (ODL), is already live in several key corridors, including the U.S.–Mexico, Japan–Philippines, and Europe–Southeast Asia.
Internal research from Titanwhale shows ODL volumes grew 57% year-over-year, with over $2.8 billion in XRP processed through RippleNet in Q2 alone.
“XRP is solving a real-world liquidity problem that traditional banking has struggled with for decades,” said Mia Chen, Head of Payments Analysis at Titanwhale. “And it’s doing so in real time—without intermediaries.”
Regulatory Clarity Boosts Adoption
The XRP ecosystem also benefited from a major legal milestone in 2023, when a U.S. federal court ruled that XRP is not a security when traded on public exchanges. This ruling lifted a significant cloud of regulatory uncertainty and paved the way for wider institutional participation.
Since the ruling, Ripple has announced CBDC partnerships with central banks, positioning the XRP Ledger as a politically neutral and interoperable infrastructure for next-generation digital currencies.
Titanwhale’s Strategic View
At Titanwhale, XRP is not viewed as a speculative asset, but as a cornerstone of the emerging global payment architecture. Its decentralized structure, instant settlement capability, and scalability make it uniquely suited to serve as a universal bridge asset in a fragmented currency landscape.
With growing institutional engagement and technical maturity, Titanwhale considers XRP a strategic allocation within diversified crypto portfolios over a 3–5 year horizon.

XPRXRP has been gaining strong upward momentum recently, overcoming key resistance levels with confidence. The buying pressure looks steady, and the market sentiment around XRP is increasingly positive. If this trend continues, XRP is well-positioned for further gains in the short to medium term.

XRP TV IDEA WENT PERFECT! now we rest a lil I'm aiming for XRP to actually take a break aswell as all other crypto assets this weekend. Check my calls on trading view as all of them have been spot on so far. Even webull! Thanks for following. Stay tuned and bitteach members are cooking!
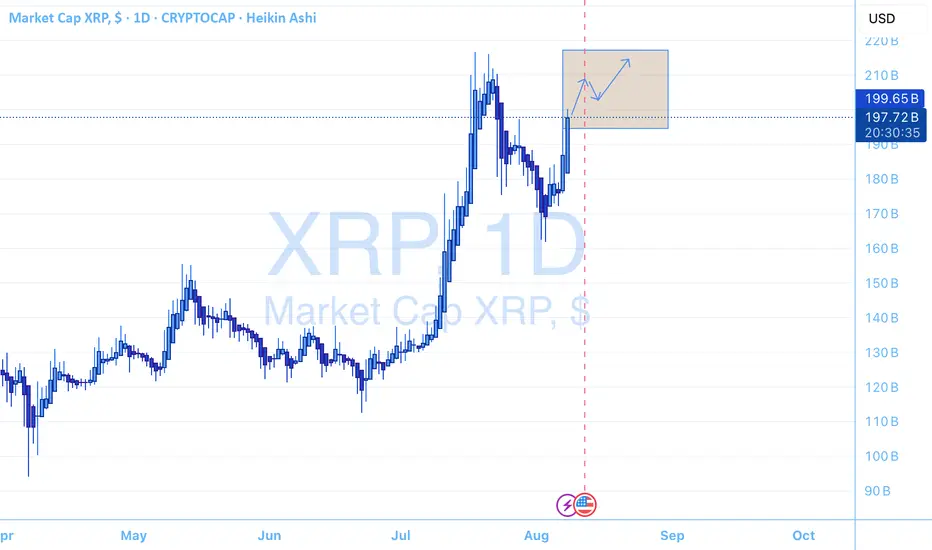
XRP Market Cap – Technical Breakdown (4H TF)XRP Market Cap – Technical Breakdown (4H TF)
Bullish momentum continues to dominate as XRP’s market cap pushes through key Fibonacci levels, maintaining its position inside a well-defined ascending channel.
Ichimoku Cloud confirms bullish sentiment — price holds above Kumo with Tenkan-Kijun crossover and strong volume support.
📈 Key Levels:
Resistance: $193.67B (Fibo 0 – local top)
Supports: $188.71B, $185.64B, $183.16B
Channel Target: $198–200B (if breakout confirmed)
🟢 Bias: Bullish
📍 Strategy: Wait for breakout + retest above $193.6B for next leg up.
🔁 Pullbacks to Fibo 0.382–0.5 zones offer high-probability long setups.
#XRP #CryptoAnalysis #TradingView #Ichimoku #Fibonacci #TechnicalAnalysis #Altcoins #BullishTrend

DAY 4 of the XRP long finally unbanned on trading view for posting too much heat. here is my nice trade on XRP. now i will release the other calls aswell here on my TRADING VIEW.
stay tuned for more to come !
excited to share my skills to the public.

$XRP trade. PERFECTION the call i made on XRP following perfectly to a T. this and its daily trading volume rising is bullish. i can see us retesting and going back up from here with the recent tariff news upon this.
keep an eye out on alt coins as we move only forward in bullish measures in the crypto market. Stocks opened lower today aswell which indicates crypto is running its course with stocks as it sometimes does but eventually always will.
bagdaddy out!
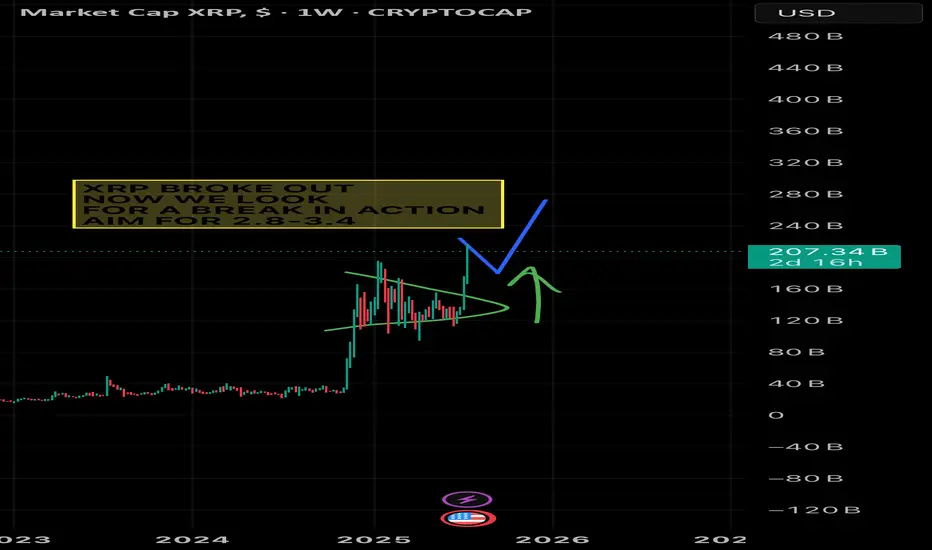
XRP call out JULY 4thXRP looks very good here and on a longer time frame showing a accendig triangle. im confident we will see a nice long into 5$ mid august or later in the year. until then we keep building on our longs here. have a hard time seeing it under 2 dollars again for a minute.
first position i will close at 2.40 as a partial to the full entry
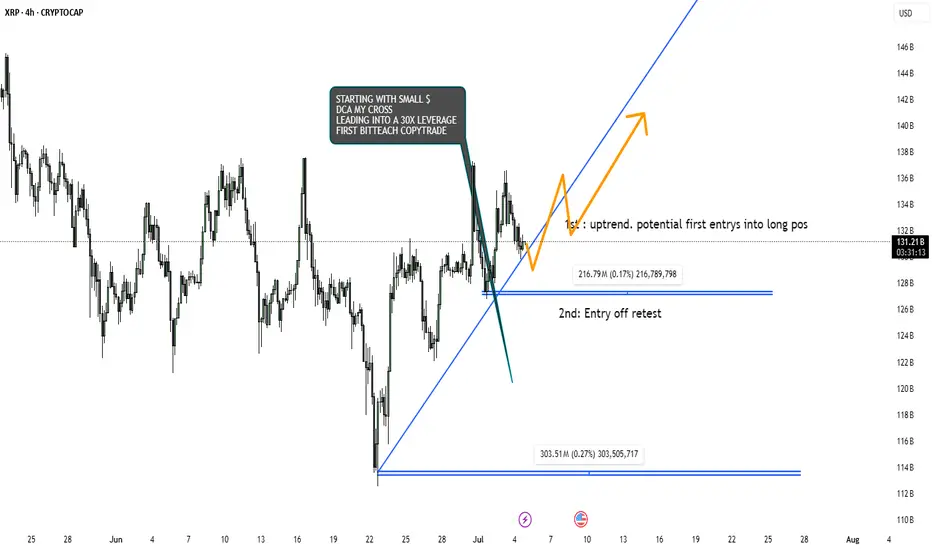
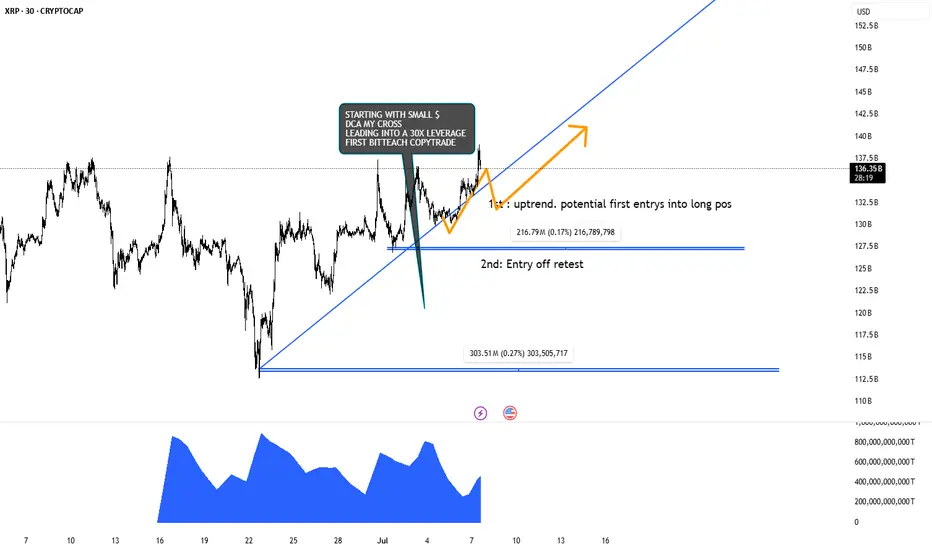
$ETH and $XRP simple kindergarten teaching! im the father. and this is class day 1. showing you eth and xrp simple future play that will occur for the bull. my students should be using there imagination and common sense to chart just like this already. the first videos i will explain in very simple ways. and as we move on. more indication for my higher up students will come out !
bag dad

XRP Price Finds Some Relief — But Headwinds Remain,Says ArtavionAfter slipping below $0.50 last week, XRP has rebounded modestly, now trading above $0.52. While this short-term recovery provides relief for holders, fundamental and structural challenges still limit the token’s upside potential, according to analysts at Artavion.
The recent bounce appears largely technical. Support held near $0.48, and with Bitcoin regaining strength above $66,000, sentiment across altcoins briefly improved. XRP’s Relative Strength Index (RSI) has moved out of oversold territory, suggesting some room for additional upside — but resistance between $0.56 and $0.60 remains firm. Low trading volume suggests the rally lacks conviction.
A major ongoing concern remains XRP’s legal battle with the U.S. Securities and Exchange Commission (SEC). Although Ripple Labs scored partial wins, the case is unresolved. Until a final judgment or settlement is reached, institutional investors will likely remain cautious, and U.S.-based platforms will continue restricting XRP exposure.
🗨️ “The legal cloud hasn’t lifted — and that limits capital inflows,” says a regulatory analyst at Artavion.
From a network perspective, XRP Ledger remains functional and Ripple’s payment infrastructure is active, particularly in select cross-border corridors. However, XRP still lacks integration with key crypto sectors like DeFi, NFTs, and gaming, which restricts organic demand and developer activity.
Externally, macro conditions are neutral to negative for altcoins. The Federal Reserve’s rate outlook and rising bond yields continue to pressure speculative assets. Stablecoin inflows into XRP trading pairs have slowed — another signal of fading short-term appetite.
Outlook
At Artavion, we believe XRP is currently locked in a range-bound pattern. A breakout above $0.60 is unlikely without:
Full legal clarity in the U.S.;
Stronger altcoin sentiment market-wide;
Renewed ecosystem development and integrations.
🗨️ “XRP isn’t broken — it’s waiting,” says the Artavion market desk. “But without a catalyst, it stays reactive — not directional.”

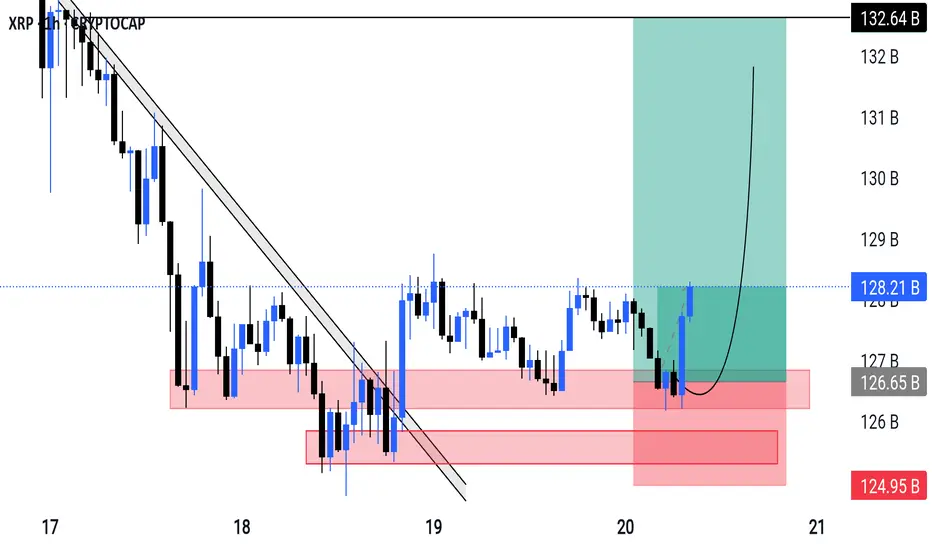
XRP M30 Chart Analysis "XRP Short.
Target: 123.01B. Stop: 127.09B.
Let's see if this plays out. 👀
#XRP #CryptoTrading"

DXY: Bearish Breakout from Consolidation RangeTechnical Analysis / Setup:
* Trendline Break: "We can observe a clear break below the ascending trendline, indicating a shift in momentum."
* Resistance Rejection: "The price also failed to sustain above the upper resistance zone (red box), showing a strong rejection at the 99.129 and 99.092 levels."
* Consolidation Breakout: "The break of the lower boundary of the consolidation range confirms the bearish sentiment."
Hold on, here is the real deal.District court ruling on the joint motion (June12) still pending—no update yet.
Judge Torres’ ruling – could come any day; depends on district court docket.
Appeals proceedings remain on hold until at least August 15, 2025.
XRP spot ETF decisions delayed:
SEC ETF decisions, comment periods suggest
Franklin Templeton: very likely by late July
ProShares: by June 25
Grayscale: likely October
Bitwise: through June to October
CPI must fall under 2.0%
Oil must retrace to the $70s
Fed must signal a real cut, not conditional pause
DXY must fall below 103
Current War that we all are focused is going to be ended swiftly.
Until then, Hold Your Horses!

XRPUSD SCALPING XRPUSD – Scalp Setup: Buy Into Sell (AUTH Liquidity Framework)
XRPUSD is presenting a two-phase scalp opportunity based on liquidity behavior — first a buy-side reaction, followed by a sell-off from premium liquidity.
🔹 Buy Phase – Liquidity Rebound Setup
Price has swept a key sell-side liquidity pocket below recent equal lows, triggering a reactive move.
• Buy Entry: After lower timeframe confirmation (M5–M15 bullish shift)
• Target: Short-term rally toward internal highs where buy-side liquidity rests
• Exit Zone: Prior to major resistance or supply zone to secure profits
🔹 Sell Phase – Reversal From Overhead Liquidity
Once internal highs are cleared and liquidity is taken, a reversal setup forms.
• Sell Entry: Upon rejection from premium zone or after liquidity sweep above key highs
• Confirmation: Bearish structure shift or strong rejection wick
• Target: Value area retrace or inefficiency fill toward lower structure
📌 Follow for a free intro class on the AUTH Masterpiece System — learn how to spot precision setups like this using liquidity, structure, and value alignment.
Disclaimer: This idea is for educational purposes only and does not constitute financial advice. Trade at your own risk.

#XRP MARKET STRUCTURE | DAILY OUTLOOK | MAY 2025📊 *XRP - Strong Support & Breakout Watch | Daily Timeframe*
XRP is currently holding above a major support zone around the 102B market cap level. Price has shown multiple rejections from this zone, indicating strong buying interest.
🔹 *Key Levels:*
- *Support Zone:* 102B (Strong Demand Area)
- *Resistance Zone:* 147B (Breakout Level)
📈 *Market Structure:*
Price is forming a potential accumulation pattern. If this structure holds, we might see a bullish reversal towards the resistance, followed by a possible breakout.
📌 *Bullish Scenario:*
- Bounce from support
- Retest of previous high
- Breakout above resistance
📌 *Invalidation:*
- If price closes below 102B support zone, setup may fail and a deeper drop could follow.
🧠 *Note:* This is not financial advice. Always do your own analysis before trading.
#XRP #CryptoAnalysis #TechnicalAnalysis #Breakout #SupportResistance

AI Trade Signal IndicatorAn intelligent trading tool that uses AI to analyze market data and generate precise buy and sell signals, helping you trade smarter and faster.

Futures on CME and Launch of XpFinance DeFi PlatformOn May 7, 2025, the XRP ecosystem received two major developments that signal a new chapter in its evolution. First, the Chicago Mercantile Exchange (CME) announced the launch of futures contracts for XRP. Shortly thereafter, developers behind the XRP Ledger unveiled XpFinance — the first non-custodial lending platform built on the network. These two events are poised to reshape XRP's market perception and could attract a wave of new investment.
XRP Futures on CME: A Leap Toward Institutional Adoption
Set to go live on May 19, the new CME product will enable investors to trade XRP through regulated futures contracts. This is a major milestone. With similar contracts already in place for Bitcoin and Ethereum, XRP becomes the third digital asset to gain such legitimacy in institutional markets.
The introduction of futures means greater liquidity, risk management tools, and a clear path for hedge funds, pension managers, and banks to engage with XRP — without needing to custody the underlying token directly. Analysts anticipate that this added market structure could drive up demand, especially if the rollout is smooth and met with trading interest.
XpFinance and the XPF Token: DeFi Comes to XRP Ledger
The second big announcement came from XpFinance, a new decentralized lending protocol. What sets it apart is its non-custodial model — users can lend assets and earn interest while retaining full control of their private keys. At a time when centralized platforms are under scrutiny, this approach appeals to security-conscious users.
XpFinance is powered by a new token, XPF, which will be used for staking rewards, fee payments, and governance. The pre-sale of XPF has already begun and is generating buzz, especially among XRP community members eager to participate in the first major DeFi initiative on the ledger.
Market Outlook and Analyst Forecasts
Reactions from analysts have been positive. According to a report from DigitalMetrics, if both the CME futures and XpFinance platforms gain traction, XRP could see a sharp upward move — potentially reaching $10 by summer 2025. That would represent a fourfold increase from its current price.
However, risks remain. Ripple Labs continues to face regulatory pressure in the U.S., and crypto markets overall remain volatile. Still, the general tone has shifted. With increasing institutional interest and expanding utility, XRP appears to be entering a new phase of growth.
Conclusion
The combination of institutional infrastructure and decentralized finance innovation makes May 2025 a pivotal moment for XRP. If these initiatives succeed, XRP could transition from a mid-cap altcoin to a primary digital asset in the eyes of both institutional investors and the broader crypto community. Whether this momentum will translate into long-term market dominance remains to be seen — but the foundation is clearly being laid.
