Long XRP.xrp 5+8+9 = 22
xrp always moves in patterns… december has been the month where the charts line up and the cycles flip.
if it made the same type of move it did in december 2017, the math lines up around 22.
that’s why people link 22 ↔ 589… not as a guarantee, but as a hint buried in the structure,

XRP/USDT Is Begging for Alt SeasonHello traders,
I’ve been watching XRP structure, and it’s hard to ignore how aggressively price is defending the $1.95–$2.17 support zone.
With each touch into this area price just rejects upwards. That shows buyers are in control.
As long as this zone holds, XRP is practically begging for ALT sea

XRP Technical Outlook: Channel Break Could Signal New Highs !!The price is currently moving within a bullish channel and may reach the upper boundary of this channel. If the channel is broken to the upside, we can expect a new all-time high (ATH) for Ripple.

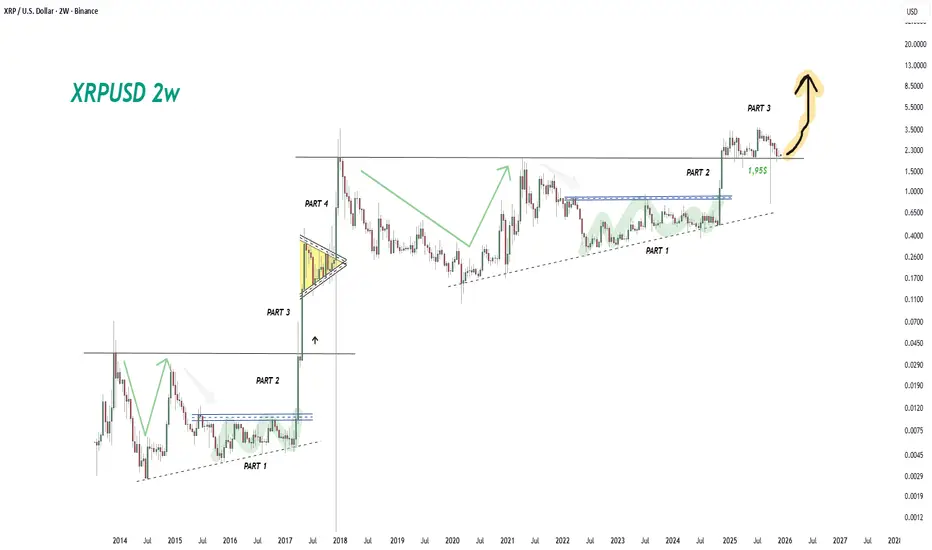
XRP/USD 2-Week Chart Analysis: Is History Repeating Itself? 1. Overall Structure: The Fractal Recurrence (2017 vs. 2025)
The chart’s main hypothesis is that the cycle experienced by XRP between 2014 and 2017 is almost an identical copy of the current cycle spanning 2021 to 2025.
Left Side (2014-2017): Depicts the "dead" period, accumulation, and subsequent
XRP TESTING SUPPORT QUICK POST🌊 Hey hey, here with a quick post, nothing crazy, just wanted to get a quick post out with everything going on and our price action this week.
🌊 The broad crypto market has seen a dip in general with price action as more liquidations and some retail panic pushes things further. Our technical also

XRP To 1.34? Is that Even Possible It appears we heading South via Price Action on XRP to the zones showcased in the image. Any questions send me a DM more than happy to help you wherever I can
Mindbloome Exchange / Trade What You See
Kris

XRPUSD; Heikin Ashi Trade Idea📈 Hey Traders!
Here’s a fresh outlook from my trading desk. If you’ve been following me for a while, you already know my approach:
🧩 I trade Supply & Demand zones using Heikin Ashi chart on the 4H timeframe.
🧠 I keep it mechanical and clean — no messy charts, no guessing games.
❌ No trendlines, no

I think the only one Liking my post is me!This is my last hope for RIPPLE. If this support is lost and the descending triangle pattern proves valid and the price follows it, Dogecoin will fall below 1.8 cents for a long time. But since the crypto market often breaks rules and patterns, maybe this time it will reverse again and, after breaki

Chart keeps me up at night.One thing for sure this thing has not fallen. like it normally would.
I can't make heads or tails which way we are going. my only hunch is if we don't blast from here soon we face a real chance of getting below our previous ATH(Orange Line) ..then ill be full bear but as of now we holding on by a st

XRP Can't Wake Up: $2.05 Is the Line Between Dump or PumpXRP remains in a muted down-to-sideways pattern with no clean structure flip. Price is under the key overhead zones (~2.8–3.0).
Indicators:
RSI: ~40–43 (weak)
MACD: slightly negative, no strong bullish momentum
Structure:
No clear bullish MSB; lower highs still intact. Weak range chop.
Positio

See all ideas
Summarizing what the indicators are suggesting.
Oscillators
Neutral
SellBuy
Strong sellStrong buy
Strong sellSellNeutralBuyStrong buy
Oscillators
Neutral
SellBuy
Strong sellStrong buy
Strong sellSellNeutralBuyStrong buy
Summary
Neutral
SellBuy
Strong sellStrong buy
Strong sellSellNeutralBuyStrong buy
Summary
Neutral
SellBuy
Strong sellStrong buy
Strong sellSellNeutralBuyStrong buy
Summary
Neutral
SellBuy
Strong sellStrong buy
Strong sellSellNeutralBuyStrong buy
Moving Averages
Neutral
SellBuy
Strong sellStrong buy
Strong sellSellNeutralBuyStrong buy
Moving Averages
Neutral
SellBuy
Strong sellStrong buy
Strong sellSellNeutralBuyStrong buy
Displays a symbol's price movements over previous years to identify recurring trends.
Curated watchlists where XRPUSD.P is featured.

Eco-friendly crypto tokens: Green cryptocurrencies
14 No. of Symbols

Gen 1 crypto: from little acorns grow
15 No. of Symbols

Top altcoins: Choose your alternatives carefully
28 No. of Symbols
See all sparks