Long XRP.xrp 5+8+9 = 22
xrp always moves in patterns… december has been the month where the charts line up and the cycles flip.
if it made the same type of move it did in december 2017, the math lines up around 22.
that’s why people link 22 ↔ 589… not as a guarantee, but as a hint buried in the structure, in the algos, in the way liquidity rotates.
nothing’s confirmed, but the numbers rhyme. and markets love to rhyme.
Market insights

XRP/USDT Is Begging for Alt SeasonHello traders,
I’ve been watching XRP structure, and it’s hard to ignore how aggressively price is defending the $1.95–$2.17 support zone.
With each touch into this area price just rejects upwards. That shows buyers are in control.
As long as this zone holds, XRP is practically begging for ALT season at this point. This accumulation area will project the price for the $3 price range any might even break $3.6
Good Luck!
Please drop a like and share your thoughts traders.

XRP Technical Outlook: Channel Break Could Signal New Highs !!The price is currently moving within a bullish channel and may reach the upper boundary of this channel. If the channel is broken to the upside, we can expect a new all-time high (ATH) for Ripple.

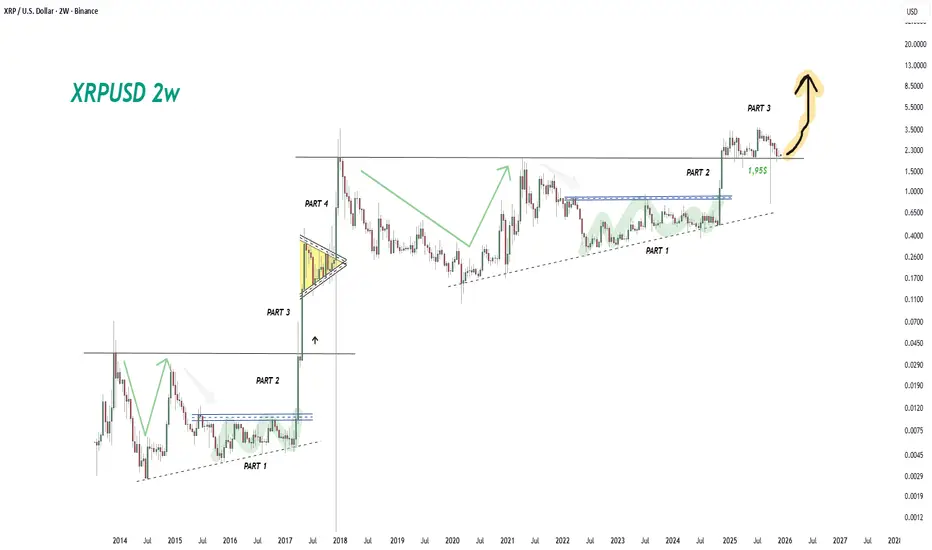
XRP/USD 2-Week Chart Analysis: Is History Repeating Itself? 1. Overall Structure: The Fractal Recurrence (2017 vs. 2025)
The chart’s main hypothesis is that the cycle experienced by XRP between 2014 and 2017 is almost an identical copy of the current cycle spanning 2021 to 2025.
Left Side (2014-2017): Depicts the "dead" period, accumulation, and subsequent vertical surge that preceded XRP’s legendary 2017 rally.
Right Side (Current Situation): Shows a similar "rounding bottom" formation, consolidation, and the recent breakout.
2. Segment-by-Segment Technical Breakdown
Let's evaluate the labeled "PART" segments on the chart individually:
PART 1 (Accumulation Phase):
In both cycles, this was a period where investor patience was tested, and the price was suppressed within a specific range (below the dashed blue lines) for an extended time.
In the current cycle, this process (2022-2024) lasted significantly longer. A fundamental rule in technical analysis states: "The bigger the base, the higher in space." This prolonged sideways movement indicates a massive build-up of energy that could intensify the magnitude of the eventual surge.
PART 2 (Breakout and Retest):
The moment the blue resistance area is broken to the upside.
The chart suggests we are currently at the tail end of, or have just completed, this phase. Price consolidation and sustained movement above the blue box confirms the official end of the downtrend and the start of a bull market.
PART 3 (Parabolic Rise - Discovery Phase):
This is the most critical juncture of the chart. In 2017, following "Part 2," the price rose in a near-vertical line, seemingly defying gravity.
The analysis contends that we are standing right on the precipice of this "vertical lift-off" in the current cycle. The large yellow arrow indicates an expectation for the price to accelerate rapidly on the logarithmic scale.
Critical Level: The $1.95 Support:
The $1.95 level, marked in green, is of vital importance. This was the previous major resistance. According to technical analysis, "Once resistance is broken, it turns into support."
The price currently holding above this level (performing a successful retest) is the most crucial confirmation point for the continuation of the uptrend.
3. Targets and Expectations
Considering the yellow arrow and the scaling on the right side of the chart:
Short-to-Medium Term: The first primary target is the range around XRP's All-Time High (ATH) of $3.30 – $3.84.
The Chart's Implied Target: If the 2017 fractal plays out precisely, the chart suggests a peak target between $9.00 and $13.00 (or potentially even higher).
4. Risks and Commentary from an Experienced Analyst
While the chart is visually compelling, as an experienced broker, I must add these nuances:
Market Cap Reality: The crypto market was much smaller in 2017. For XRP to hit $10+ now implies reaching a colossal market capitalization. While not impossible (logic often takes a backseat in crypto mania), expecting the exact "x100" moves of 2017 is mathematically more challenging.
Fundamental Catalysts (SEC and ETF): The success of this chart relies not just on technical data but on fundamental factors. SEC lawsuit closure, rumors of an XRP ETF, and Ripple’s stablecoin moves are the core elements that will fuel this "Part 3."
Volatility Warning: Parabolic rises (Part 3) are accompanied by very severe corrections (sudden drops of 30-40%). This is the most dangerous territory for leveraged trading.
Conclusion
Outlook: Extremely Positive (Bullish). Strategy:
If you currently hold XRP: A "Hold" strategy seems prudent as long as the $1.95 level is maintained. The trend momentum is extremely strong.
For New Entries: Retracements (retests) into the $1.95 - $2.10 range could be viewed as secure buying opportunities.
In summary: The chart indicates that XRP is at the moment of "breaking its chains" that has been long-awaited. If Bitcoin does not derail the broader market, double-digit targets ($10+) for XRP are technically on the table.
BONUS CHART:
XRP/DXY 1w
XRP TESTING SUPPORT QUICK POST🌊 Hey hey, here with a quick post, nothing crazy, just wanted to get a quick post out with everything going on and our price action this week.
🌊 The broad crypto market has seen a dip in general with price action as more liquidations and some retail panic pushes things further. Our technical also gives further insight for us with that our indicator's showing us that we've lost some momentum here and we're still getting dragged by this current down.
🌊 The descending channel is still hitting hard as ever, when above and within, it'll play that support but from below it's a hard resistance to break. As I write this we've come up on that support and are retesting $1.87-1.90 after having fallen down and out of our horizontal channel and our descending channel.
🌊 It's been a bit tough the last couple of days for the market and XRP but here we'll see if our support can keep us above $1.85 else we risk losing a lot more ground if we can't keep above that. Whales continue to slowly accumulate and a lot of what we're seeing right now is retail panic and price action that's been drive by some technical factors.
🌊 I'll be watching to see whether or not we regain our footing and can climb back into our descending channel or if we'll continue this 'tug of war'. I've attached a 15 minute chart below for reference showing how we've slipped once we lost the channel so it's simply a matter of regaining that and establishing support with this retest here above $1.85.
🌊 Next couple of hours, days should give us a lot more and we're almost upon January, the market may be more optimistic with the new year so we've got a lot more in store but for now let's keep our eyes peeled and focus on what lies ahead. Thanks for tuning in as always, wishing well and appreciate everyone as always.
🌊 Many thanks and best regards till next!
~ Rock'

XRP To 1.34? Is that Even Possible It appears we heading South via Price Action on XRP to the zones showcased in the image. Any questions send me a DM more than happy to help you wherever I can
Mindbloome Exchange / Trade What You See
Kris

XRPUSD; Heikin Ashi Trade Idea📈 Hey Traders!
Here’s a fresh outlook from my trading desk. If you’ve been following me for a while, you already know my approach:
🧩 I trade Supply & Demand zones using Heikin Ashi chart on the 4H timeframe.
🧠 I keep it mechanical and clean — no messy charts, no guessing games.
❌ No trendlines, no fixed sessions, no patterns, no indicator overload.
❌ No overanalyzing the market; use only two time frames.
❌ No scalping, and no need to be glued to the screen.
✅ I trade exclusively with limit orders, so it’s more of a set-and-forget style.
✅ This means more freedom, less screen time, and a focus on quality setups.
✅ Just a simplified, structured plan and a calm mindset.
💬 Let’s Talk:
💡Do you trade supply & demand too ?
💡What’s your go-to timeframe ?
💡Ever tried Heikin Ashi ?
📩 Got questions about my strategy or setup? Drop them below — ask me anything, I’m here to share.
Let’s grow together and keep it simple. 👊

I think the only one Liking my post is me!This is my last hope for RIPPLE. If this support is lost and the descending triangle pattern proves valid and the price follows it, Dogecoin will fall below 1.8 cents for a long time. But since the crypto market often breaks rules and patterns, maybe this time it will reverse again and, after breaking the triangle, push the price back above 2.3 cents.
What do you think will happen? Leave a comment !

Chart keeps me up at night.One thing for sure this thing has not fallen. like it normally would.
I can't make heads or tails which way we are going. my only hunch is if we don't blast from here soon we face a real chance of getting below our previous ATH(Orange Line) ..then ill be full bear but as of now we holding on by a string.

XRP Can't Wake Up: $2.05 Is the Line Between Dump or PumpXRP remains in a muted down-to-sideways pattern with no clean structure flip. Price is under the key overhead zones (~2.8–3.0).
Indicators:
RSI: ~40–43 (weak)
MACD: slightly negative, no strong bullish momentum
Structure:
No clear bullish MSB; lower highs still intact. Weak range chop.
Position: Short bias (range)
Entry Idea: Short below $2.05
Stop: Above $2.20
Targets: $1.85 → $1.70
Reasoning: Returns into the downside range until breakout confirms new trend.

XRP/USD LONG & SHORT SET UP TRADETitle: XRP/USD (RIPPLE) BUY
Asset: Crypto
Symbol: XRP/USD
Market Entry Price 1: $2.06
Limit entry 2: $2.00
Stop Loss: $1.94
Take Profit 1: $2.18
Take Profit 2: $2.30
Take Profit 3: $2.36
Take profit 4: $2.48
Status: ACTIVE

XRP NEWS AND HIGHLIGHTS FOR THE WEEK TO KNOW!🔥 Hey, hope everyone's been well, here with a quick follow up on things and some highlights and insights for the week to consider and give a quick read. As always, thanks for tuning in.
🔥 ETF Inflows: U.S. spot XRP ETFs have seen significant inflows. Total assets under management across funds like Canary's XRPC and REX-Osprey's XRPR are approaching $1 billion. This shows strong institutional demand following regulatory clarity.
🔥 Price and Market Activity: XRP is consolidating within the $2.00-$2.30 range, with a current price around $2.11. Whales have been accumulating tokens while retail investors sell, a pattern seen in previous recovery phases.
🔥 Regulatory Clarity: Regulatory support in Europe, particularly under the MiCA framework, has boosted confidence in XRP. This has accelerated adoption among financial firms. The August 2025 U.S. SEC settlement provides a clear legal foundation for institutional participation.
🔥 Ripple's Strategy: Ripple continues to expand its global infrastructure. The focus is on real-world asset tokenization, CBDC collaborations, and expanding its On-Demand Liquidity (ODL) corridors using its RLUSD stablecoin.
🔥With this and XRP consolidating at a monthly support above that $2.00 we can see whales accumulating while retail has been panicking a bit the last few months of which price action has been pretty influenced, driven by sharp price drops followed by aggressive liquidations and our technical which still has us within this descending channel as marked by the blue.
🔥 Main thing I'm keeping watch for is when we break out of the current horizontal channel 'in yellow' and if we can break that $2.20 which would help us regain our 200 EMA and could ultimately lead to a breakout if we exit the main descending channel. Basically we want to get out of the blue channel dragging us down. Think of it as a river, once we get out of the river we can climb up.
🔥 As I said, quick and short highlights there with some important things to consider as we face the next couple of days. Market sentiment may be mixed but whales know more than we do and if their stockpiling I doubt it's for no reason, we already understand the market as a whole is recovering, consolidating, or testing support. At the end of the day the next few months look optimistic as ever.
🔥 Thanks for joining as always, happy to share some quick highlights for the week and let's keep posted, excited to see what the next few months hold for us, especially as XRP continues to grow it's presence and support by the day continuing to build towards the vision we believe in. Everything works out.
🔥 Best regards as usual, stay rocking,
~ Rock'

XRP: Likely to Move Lower Ripple’s XRP is expected to retrace further into the green Target Zone ranging from $1.03 to $0.38 as part of a blue downward impulse, which would complete the higher-level turquoise wave B. Afterward, wave C should drive price sharply higher, ultimately setting a new high for the larger wave (Y) above the resistance at $4.09. However, if bulls manage to push the altcoin above the $3.19 resistance and the $4.09 level in the near term—a scenario we estimate has a 30% probability—it would suggest that the turquoise alt.B wave has already been completed, and our Target Zone would no longer be reached.

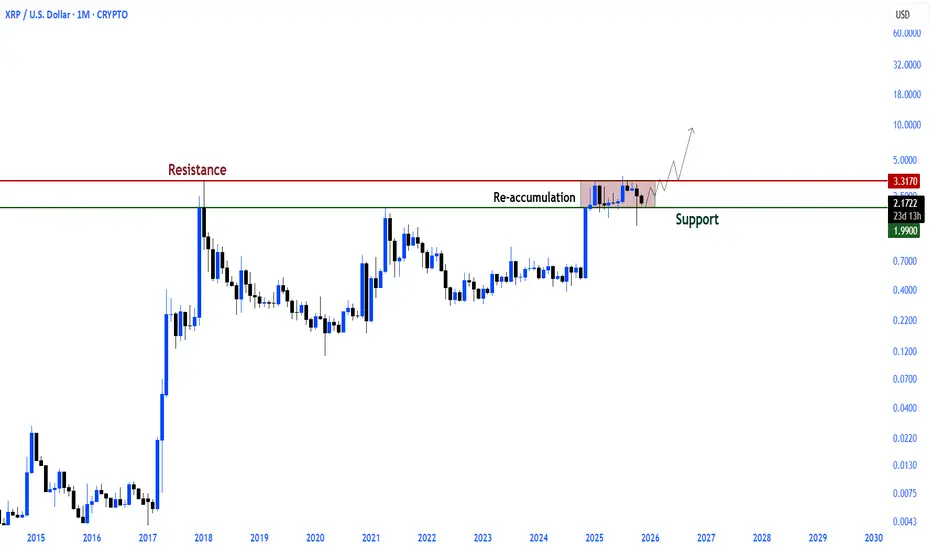
The table is clear in $XRP
Ripple is still in a clear re-accumulation phase between the $3.3 major resistance and the $1.99 support.
Unless the structure is broken, this silence will trigger a new leg.
XRP | Wk 51T.A explained -
BackSide (BS)
FrontSide (FS)
Inverse BS (Inv.BS)
Inverse FS (Inv.FS)
BS & FS levels are expected support when dashed lines, tested when dotted and resistance when solid lines.
The inverse is true for the Inv. BS Inv. FS levels, they are resistance as dashed lines, tested as dotted and support as solid lines.
Monthly timeframe is color pink
weekly grey
daily is red
4hr is orange
1hr is yellow
15min is blue
5min is green if they are shown.
strength favors the higher timeframe.
2x dotted levels are origin levels where trends have or will originate. When trends break, price will target the origin of the trend. its math, when the trend breaks, the vertex breaks too so the higher timeframe level/trend that breaks, the more volatility there could be as strength in the orders flow in to fuel the move.

XRP Coiling Under Resistance – No MSB YetXRP is consolidating sideways with low volatility. MACD remains below zero, and RSI is stuck under 46 — no momentum or trend confirmation.
The last MSB flipped bearish, and OBs between 2.9–3.2 continue to cap upside. Until we break 2.3+, the bias remains neutral to bearish.
No real strength on either side — but time is running out.
Bias: Neutral
Pair: XRP/USDT
Timeframe: 12H

XRPUSD Strong Support Reversal AnalysisXRP is forming a higher-low structure above the key support zone at 2.00 – 2.03. Buyers are consistently defending this region, showing strong demand. A bullish continuation is expected as long as the market stays above 1.9900.
A breakout above 2.1500 could trigger momentum buying, pushing price toward 2.3000 and then 2.4000.
KEY LEVELS
Entry 2.1000
Target 2.4000
Stop Lose 1.9900

XRP is Bullish Until Proven OtherwiseHolding the 2021 highs has been the saving grace for XRP. In my opinion this negates the negative price action we have seen as of late, especially with taking the positive macro environment.

XRPUSD – The December Accumulation Play | Smart Money Blueprint Market Context – The Perfect Storm for XRP |
XRP is sitting at one of the most compelling risk/reward setups in crypto right now. After a historic 430% rally from early November that took XRP from $0.50 to a local peak of $2.87 on December 2, 2024, the asset has entered a healthy consolidation phase inside a rising channel between $1.95-$2.00 support and $2.62-$2.80 resistance.
But here's what makes this different from your typical alt pump: the fundamentals are actually there.
The surge followed Donald Trump's election victory in November 2024, which triggered expectations of more favorable US crypto policies. The SEC, under new pro crypto leadership, is nearing a final resolution with Ripple, with the SEC keeping $50 million from the previous $125 million fine and returning the rest. This removes years of regulatory overhang.
Then came the game changer: Ripple launched its RLUSD stable coin globally on December 17, 2024 Business Wire, which is fully backed by U.S. dollar deposits, U.S. government bonds, and cash equivalents Business Wire. This isn't just another stable coin it's enterprise grade infrastructure designed for cross border payments for Ripple's customers starting early next year FXStreet.
Translation? XRP isn't speculation anymore. It's becoming institutional grade infrastructure.
🔎 Technical Framework – Smart Money Channeling Higher
Current State:
Rising channel accumulation phase with whale conviction
Key Liquidity Zones:
🔴 Premium Liquidity Zone (Sell Opportunity):
$2.62 - $2.80 (upper channel resistance + FVG cluster)
This is where retail gets greedy and smart money distributes
Historically, significant spikes in whale to exchange transactions align closely with XRP price peaks.
🟢 Discount Liquidity Zone (BUY ORIGIN):
$1.90 - $2.00 (lower channel support + whale accumulation cluster)
This support zone has consistently triggered rebounds since December 2024
In the last 24 hours alone, large holders accumulated an additional 110 million XRP.
⚖️ Equilibrium / Chop Zone:
$2.20 - $2.40 (mid channel consolidation)
Avoid blind entries here—wait for structural confirmation
🐋 WHALE ACTIVITY – The Real Story
This is where it gets JUICY . While retail panicked during the recent pullback, whales went on an absolute buying spree:
Ripple whales accumulated 160 million XRP worth around $380 million as of December 10, 2024
Large XRP investors added 590 million XRP worth $1.29 billion over a seven day period
Between December 25 and December 28, XRP whales accumulated tokens worth $2.17 billion
Let me repeat that: $2.17 BILLION in THREE DAYS .
CryptoQuant data indicates whale activity over the past month reached unprecedented levels, multiples higher than any other period. This isn't retail FOMO—this is institutional positioning.
Now here's the kicker: Whale order clusters near $1.80-$2.00 USD during 2025 show persistent large holder activity. Every time XRP dips to this zone, whales defend it aggressively. That's your signal.
🚨 Recent Developments – Catalyst Stack
SEC Settlement (MASSIVE)
Ripple will retain $75 million from the SEC settlement, and most importantly, be able to offer XRP tokens to institutional investors. This was the missing piece preventing institutional adoption. Now? Game on.
RLUSD Stablecoin Launch
Ripple announced the launch of RLUSD on December 17, 2024, calling it an "enterprise grade stablecoin built on trust, utility, and compliance". Ripple plans to use both RLUSD and XRP in its cross border payments solution, creating direct utility demand for XRP in institutional payment flows.
Regulatory Tailwinds
With Trump's pro crypto administration and Gary Gensler stepping down, the regulatory environment has flipped 180 degrees. Former CFTC Chair Christopher Giancarlo stated the SEC should drop the Ripple case.
ETF Momentum Building
Franklin Templeton and Canary Capital have filed for XRP ETFs. If approved, we're talking about billions in potential institutional inflows.
🎯 Trade Plans – Precision Entry & Exits
🟢 BUY XRPUSD: $1.90 - $2.00 | SL $1.82
Thesis: Discount origin tap at proven whale accumulation zone + rising channel support = institutional buy zone
Entry Rules (WAIT FOR CONFIRMATION):
Price dips into $1.90-$2.00 zone
Bullish CHoCH (Change of Character) + BOS (Break of Structure) on M15-H1
Strong bullish wick rejection + volume spike
Ideally on FVG fill or after Order Block retest
Targets:
$2.40 - $2.50 (mid-channel retest, quick 20-25% gain)
$2.70 - $2.85 (upper channel resistance, 35-42% gain)
$3.50 - $3.75 (1:1 Fibonacci extension + previous ATH retest, 75-87% gain)
Moonshot: $4.75+ (if RLUSD adoption + ETF approval coincide)
🔴 SELL XRPUSD: $2.65 - $2.80 | SL $2.92
Thesis: Premium liquidity grab at channel top followed by engineered bearish displacement—smart money distribution before reaccumulation
Entry Rules (WAIT FOR CONFIRMATION) :
Price touches $2.65-$2.80 zone
Bearish CHoCH + MSS (Market Structure Shift) + BOS down on M15-H1
Heavy volume spike on exchange inflows (use CryptoQuant whale inflow data)
Entry after FVG fill or Order Block retest post BOS
Targets:
$2.35 - $2.40 (first reaction, mid channel)
$2.10 - $2.15 (deeper retracement)
$1.90 - $2.00 (full channel retest—BUY zone reactivates)
⚠️ Risk Management & Critical Notes
Do NOT trade inside the mid channel chop zone ($2.20-$2.40) without structural confirmation—this is where retail gets chopped to pieces
Sweeps ≠ Trend Entries: If XRP wicks to $2.80 or down to $1.85, that's likely a liquidity grab, NOT a breakout/breakdown
Use tight SL based on structure invalidation—never average down in consolidation
Monitor whale to exchange inflow data (CryptoQuant): Rising whale to exchange flow indicates selling pressure
Given macro volatility (Fed policy, crypto regulation news), consider scaling position size down by 30-50%
📊 The Bottom Line – December's Hidden Gem
XRP is trading at a critical juncture. On one hand, you have:
✅ Record whale accumulation ($3.8B+ since November)
✅ SEC settlement removing regulatory overhang
✅ RLUSD launch creating institutional utility demand
✅ Pro Crypto political environment
✅ Rising channel structure with clear support/resistance
On the other hand:
⚠️ Consolidation phase means volatility is coiling
⚠️ Whales could distribute at channel top ($2.65-$2.80)
⚠️ Bitcoin weakness could drag XRP lower short-term
My Take? This is classic Smart Money accumulation. The $1.75-$2.16 support zone has been defended relentlessly by whales. Every dip gets bought. That's institutional positioning for a leg higher.
Strategy:
If you're not in yet wait for $1.90-$2.00 pullback (high probability long setup)
If you're already in take partial profits at $2.65-$2.80, let the rest ride with a trailing stop
If we break $2.80 with volume add to position, target $3.50-$4.75
This isn't financial advice this is technical + fundamental confluence at its finest.
🔥 Final Word – Why This Time Is Different
XRP has had false starts before. But this time, the stars are actually aligning:
Regulatory clarity ✅
Institutional utility (RLUSD) ✅
Whale conviction ✅
Political tailwinds ✅
Technical setup ✅
The question isn't if XRP moves it's when and how violently.
Position accordingly. Trade the structure. Follow the whales.
Drop a 🚀 if you're accumulating XRP at these levels. Let's ride this wave together.

XRP Still Stuck in a Range – No Break, No TrendXRP continues chopping sideways under the 2.5–3.0 bearish OB zone. RSI is flat near 50, and MACD is barely positive — there’s no conviction from bulls or bears.
No MSB yet. As long as 2.40 holds as resistance, structure remains bearish with limited upside potential.
This is a wait-and-see zone until a clean break confirms direction.
Bias: Neutral to Bearish
Pair: XRP/USDT
Timeframe: 12H
This is not financial advice, only data analysis. Please consult a qualified financial professional for personalized guidance.

XRP is readyXRP is flashing bullish signals across the board. Price action has consolidated into a strong accumulation zone, with buyers defending key support levels. The chart is showing a breakout setup: higher lows, tightening range, and volume starting to pick up. RSI is climbing out of oversold territory, MACD is crossing bullish, and moving averages are aligning for upward momentum.

XRP double bottomlooks like a clear double bottom on xrp.
would love too see a bullish jump from outta this zone failing under would be a bearish signal.

XRP Bleeds Out – Breaks New Lows AgainTrend Check:
XRP has officially lost all local support levels. Price continues pushing new lows with zero recovery structure. Clean bearish control.
Indicators:
RSI: 33 (oversold, but trending lower)
MACD: Deep bearish cross, full momentum with sellers
Structure:
No bullish MSB, no demand respected, and clean continuation downtrend. This is one of the weakest majors currently.
Position: Short bias
Entry Idea: Short below $1.91
Stop: Above $2.02
Targets: $1.72 → $1.55
Reasoning:
Clear breakdown, RSI and MACD agree. No signs of slowing down unless bulls react quickly at new demand levels.
