Hex on PulseChain mirrors XRP over time, $0.003 -> $3.40 (5yrs)Attention Poverty Investors 💀
While you were crying about your Hex bags at $0.003, XRP holders were getting absolutely REKT for 4-5 years straight. "Dead project!" they laughed. Then those same clowns FOMO'd in at $3 when XRP went nuclear in 2017.
1,133x gains for the psychopaths who didn't paperhand like little babies.
Now HEX sits at the EXACT same $0.003 graveyard for 5 years. Same high supply. Same "ngmi" energy. Same braindead price action that makes moonboys rage quit.
But here's the thing, anon: Alt-season is coming and history doesn't give a %$@! about your feelings. When high supply coins pump, they pump VIOLENTLY. Ask the XRP OGs who went from eating ramen to driving Lambos.
Translation for smoothbrains:
HEX at $0.003 for 5 years = XRP at $0.003 for 5 years.
If you can't see the pattern, stay poor.
$3.40 HEX incoming? Maybe. Maybe not. But if you're not at least considering it, you're ngmi.
This is not financial advice, it's a reality check for all you $0.003 stablecoin holders 🤡
WAGMI or cope forever. Your choice.
XRPUSD.P trade ideas

Xrp - This is the bullrun breakout!🔑Xrp ( CRYPTO:XRPUSD ) breaks the triangle now:
🔎Analysis summary:
After the recent bullish break and retest, Xrp managed to already rally another +100%. This is a clear indication that bulls are still totally in control of cryptos and especially Xrp. It all just comes down to the all time breakout, which will then lead to a final parabolic rally.
📝Levels to watch:
$3.0
SwingTraderPhil
SwingTrading.Simplified. | Investing.Simplified. | #LONGTERMVISION

Relax and watch the show - target = 13 dollarDear,
In a bull market it is normal to see a 10, 20% pullback before the next impulsive wave.
It is a normal level for XRP to reject for now because we came near the ATH.
With the next test of ATH i believe we will move fast trough it.
My personal target for this bull run is 13 dollar. It can go higher but i believe the market will be overbought.
Currently the RSI levels are cooling of, the 1H and 4H oversold so i believe we will reverse soon.
Take care.
$XRPUSD: Limits of Expansion🏛️ Research Notes
Documenting interconnections where historic area and coordinates of formations are used to express geometry of ongoing cycle.
If we scale out the chart back starting from roughly 2016, we can see more pretext like how the price was wired before decisive breakout from triangle.
Integrating fib channel to the angle of growth phase of the previous super-cycle, so that frequency of reversals match structural narrative.

XRP Critical Levels to Play This MonthHello I am the Cafe Trader.
This weekend we are shifting focus into the crypto market for a quick overview. If you read my last XRP article, we nailed the bottom for longs, and the sellers for a great positional play. This time we are going to analyze the current failed breakout.
Are Bulls Trapped? Does this still have room to leg up?
Point 1
We can start with the trend break. Massive buyers pushed this move higher, giving XRP a relatively quick All time high, But July 23rd shorts were able to shove this back inside of the previous high.
This signifies that there are bulls trapped, but the interesting thing to note is that the volume has reduced significantly since the last two ATH's. So this also would indicate a lack of buying interest at the highs.
Buyers are just not willing to to get involved with the same conviction as before (yet). No buyers, no continuation (even if there is not many sellers/profit takers).
Point 2
Strong buyers proved their interest with a "hot" reaction at $2.95.
With no "real" seller coming into this market yet, there is nothing stopping this continuation from legging up (so far).
Therefore I stand bullish, and am looking for a move up to $4.64 as a Target.
Point 3
Buying into this can feel tricky, your first entry for a classic two bar trend break would've been at the top of demand. I do think we will get another opportunity here, I definitely would not chase this, because it could play this range for a while before another leg up.
Setup
Trend break continuation.
Entry 3.13
Stop 2.65
Exit TP 4.64
Risk to Reward 3.1
If there is a close below these strong buyers, this could com all the way back down to 2.15-2.3 at least.
The reason for the wider stop here is because we don't want to get swept and then ran. A more conservative stop could be $2.85 which would be a 6R trade. Take your pick
Long Term
If you are late to the party on XRP (I know many are) here are some entries according to your sentiment:
Almost FOMO = 3.13
Aggressive = 2.95
Good price = 2.15-2.3
Steal = 1.60 - 1.93
That's all for XRP. We are going to be looking at Ethereum ETH Next.
Thanks for reading and happy trading!
@thecafetrader

You Are Getting Ripped Off On XRP Contd.... Once again for all the hype on xrp it still can not break the all time high.
Like I said 2 weeks ago when the price was at 3.60, I will see you at $3.00 by August 1st..
Its fading and the death nail will come 5-8 days from now.
The whole crypto market will crash. The slide starts in August.
I will be buying XRP for 55 cents in 2027.
Also Silver will outgain XRP in the next 2 years by 400 percent.
Laugh and mock all you want.
Come see me August 1st.

XRPUSD Massive break-out that can Top at $12.500XRP (XRPUSD) got out of its Accumulation Triangle (December 2024 - June 2025) making an aggressive break-out similar to the December 2017 one, which was after an identical Triangle pattern.
The fractals are so comparable that both mostly traded within the 1W MA50 (blue trend-line) and the Mayer Multiple (MM) 2 Stdev Above (orang trend-line).
As you can see, that MM trend-line was where the Top of the previous Cycle (April 2021) was priced and the one before was above the 3 Stdev Above (red trend-line).
Assuming that this Cycle will also go for the 'minimum' 2 Stdev Above test, it can make that contact by the end of the year on the 2.0 Fibonacci extension (Cycle Top-to-bottom) at $12.500.
-------------------------------------------------------------------------------
** Please LIKE 👍, FOLLOW ✅, SHARE 🙌 and COMMENT ✍ if you enjoy this idea! Also share your ideas and charts in the comments section below! This is best way to keep it relevant, support us, keep the content here free and allow the idea to reach as many people as possible. **
-------------------------------------------------------------------------------
💸💸💸💸💸💸
👇 👇 👇 👇 👇 👇

Xrp's next low I've already taken all profit at the 3rd angle vioation at the top of this run. Now I will buy back in 20%-25% lower, when Xrp hits this next beasrish target between $2.75 - $3.0.
See you at the top of this next rally up.

XRPUSD 4 Hour BottomXRP has broken out of the weekly wedge leaving a long weekly candle stick close. Price has pulled back indicating it it ready for the next leg higher. Daily candle closed bullish and 4 hour time from has double bottom.

XRP/USD – Bearish Shift After Momentum Exhaustion🧠 Summary:
XRP/USD has shown clear signs of exhaustion after sweeping the previous high. Following a breakout from a daily bull flag, price struggled to hold momentum near the key level of 3.4194, forming an ascending channel that eventually broke down. Liquidity zones below current price are now in focus.
🔍 Technical Breakdown:
✅ Daily Bull Flag → Broke out with strength
⚠️ Rejection near Previous High (3.4194) → No follow-through
🔼 Ascending Channel → Formed post-impulse, now broken
📉 Momentum Shift → Structure flipped bearish
💧 Liquidity Zones (LQZ) below price acting as magnets
📌 Key Levels:
🔹 Last High: 3.4194 (Rejection Point)
🔹 Broken LQZ: 3.2868
🔹 Current Support: 3.1689 (LQZ - being tested)
🔹 Target 1: 2.9849 (4HR Liquidity Zone)
🔹 Target 2: 2.7667 (Daily Liquidity Zone)
🧩 Confluences:
Liquidity sweep of prior high
Momentum loss near key resistance
Break of ascending structure
Retesting broken zones with room below
⚠️ Final Thoughts:
This trade is playing out just as we described in the post before this on XRP. We discussed watching how price would react to this area before making any type of "Late Entries". XRP is still a huge and vital part of the Crypto Eco System so long term i am holding my Long position. The areas on the chart are still great areas to buy in at "Dollar Cost Average". This will be one of those positions that though it may be bearish on the lower time frame you need to zoom out and always keep an eye on the weekly and daily chart before making any drastic moves.

Once Again You Are Getting Ripped Off On XRP.Pro Crypto President.
SEC Case.
Mass Adoption.
Multiple Partnerships
Mainstream
Huge Volume The Last Year
ETF Approval
Crypto Bills Passed By Congress
Still cant beat 2017 All Time Highs. They are ripping you off on the price action...!
Whats the catalyst going forward?
The Feds are soon going to cut rates multiple times. Bitcoin tanks everytime when that happens.
This was a crypto pump into whats coming.
This will close with a Monthly double top and August Starts the free fall.
The trend is your friend!Still respecting the trend. Maybe this week a push to the upside of 3.80 maybe 4.00

Xrp - The final bullish breakout!💰Xrp ( CRYPTO:XRPUSD ) will create new all time highs:
🔎Analysis summary:
After a consolidation of an incredible seven years, Xrp is finally about to create new all time highs. With this monthly candle of +40%, bulls are totally taking over control, which means that an altcoin season is likely to happen. And the major winner will simply be our lovely coin of Xrp.
📝Levels to watch:
$3.0
🙏🏻#LONGTERMVISION
SwingTraderPhil

XRP/USD H1 Educational Market Analysis – Support-Based XRP/USD H1 Educational Market Analysis – Support-Based Long Opportunity
🔍 Structure Overview:
• Support Zone: $3.21 – $3.23
This level has acted as a strong liquidity pool and base for past bullish moves. Price has tapped into it, showing signs of potential demand returning.
• Resistance Zone: $3.65 – $3.70
Acts as a key supply zone, where previous bullish attempts failed. Targeting this area after a rebound is technically sound if structure confirms.
⸻
🔄 Price Action Insights (H1):
• Price broke down through EMAs (20/50/100/200), confirming short-term bearish pressure.
• A rejection wick from support hints at possible absorption of selling pressure.
• If price forms a higher low structure above $3.25 and reclaims EMAs, a potential bullish reversal may unfold.
⸻
🧠 Educational Note:
• H1 charts are ideal for intraday strategies, and this structure provides a clear example of:
• Support-resistance dynamics
• The use of EMAs as trend confirmation tools
• Reversal vs. continuation setups
⸻
🎯 Intraday Bullish Scenario:
• If price holds above $3.21 and breaks above the $3.40 (EMA cluster), bulls may push toward the $3.55290 target.
• This level aligns with the mid-range of the resistance zone, offering scalp-to-swing potential.
⸻
🚫 Bearish Risk:
• Failure to hold $3.21 could lead to a deeper correction toward $3.10 or even $3.00.
• Confirmation of bearish continuation would be a lower high rejection from EMAs without reclaiming them.
⸻
📌 Summary:
On the H1 chart, XRP is at a critical support. Watch for a clean bounce and break above EMAs for a move toward $3.55. However, losing $3.21 could attract further downside. Use price action confirmation before entries.

XRP to 2.80So, conjugate waveform or Elliot wave retracement is 5 steps. With 3 being the longest. 5 obviously the lowest. Once a demand or supply zone is tapped/broken into, they want the extreme of that zone. That's why I think 2.80 low.
With, 1234 break on Z out of the bearish Pennant into the demand. Forming the bottom of the, now larger C&H.
And aAaAway we go!

XRP to $6?The optimistic target of $6 in 30 days is overpromised, unless a major developement comes from the White House.
Read more at: www.cointrust.com

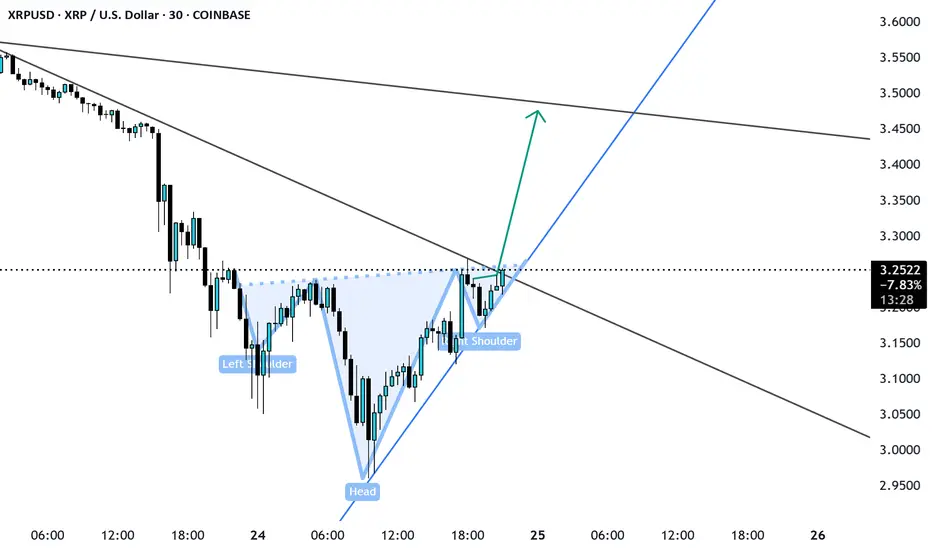
XRP SHS pattern Enter on Neckline breakout XRP pulled back from the support of 3.0 currently formed a head and shoulder pattern is likely to grow till 3.4 -3.45. let us see.
XRPUSD - Target reached. Reversal on the plateSo, that was a nice long trade.
Now price is stretched at the Upper Medianline Parallel (U-MLH).
As of the time of writing, I already see price pulling back into the Fork. A open and close within the Fork would indicate a potential push to the south.
Target would be the Centerline, as it is the level where natural Meanreversion is.
Observation Hat ON! §8-)

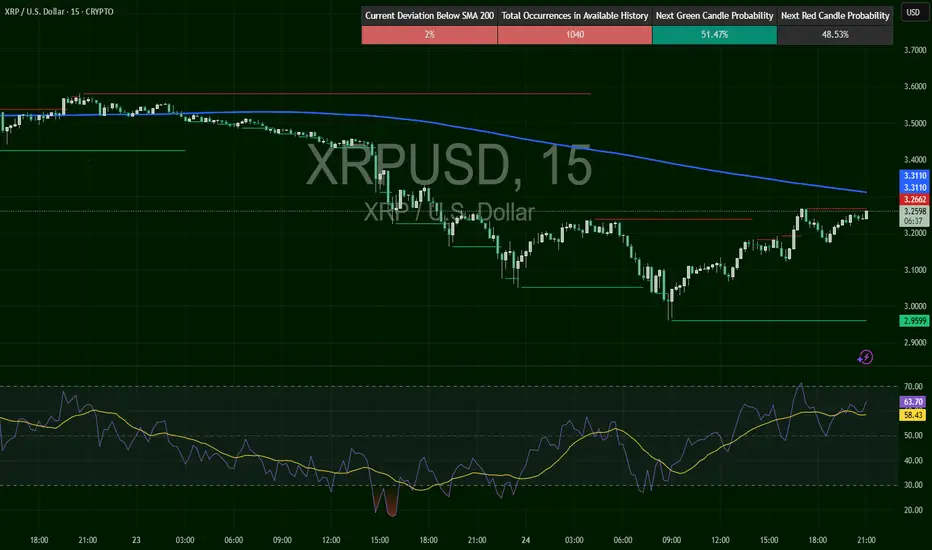
XRPUSD – Reclaim or Reject? Critical TestXRP flushed hard to $2.95, then reversed and is now pressing back into prior breakdown levels at $3.26–$3.31. 200 SMA above is resistance at $3.31. RSI at 63.14, bullish and rising. This is the make-or-break retest zone. Break it, and we could see $3.40+ fast. Rejection = trap.
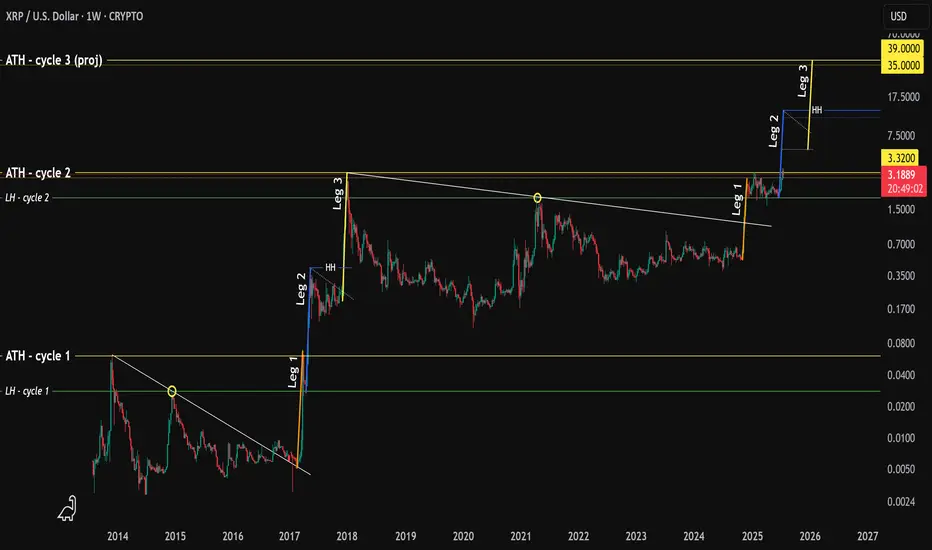
XRP - history repeating?Hello.
I'm going to walk you through what happened in the early years of XRP p.a. and how this fractal might play out today.
Here's what happened.
1. A high was printed in 2013 (ATH)
2. Followed by a lower high (LH)
3. XRP broke out of a downtrend 📈
4. In 2017 price increased 1,280% finding resistance @ ATH (we'll call this "Leg 1")
5. The LH then acted as support, followed by sideways price movement
6. Price increased 1,460% creating a higher-high (or "HH") which surpassed the ATH and this is "Leg 2"
7. Again, sideways price movement.
8. An increase of 1,560% creating a new ATH Dec 2017 - "Leg 3"
What's interesting here is that each leg takes 5 weeks to play out (that's 5 green weekly candles to put a finer point on it).
Fast forward in time - what do we see?
A high..
A lower high....
A breakout of the downtrend..
Followed by..... you guessed it... 5 green weekly candles
Hold on...
A rejection at the ATH
The LH acting as support...
With sideways movement .. 👀
The symmetry is quite profound and provides us with an idea of what will happen next.
If we consider the move in Nov 2024 as "Leg 1" then one could argue that "Leg 2" is currently in play.
Leg 1 was not as significant as the uplift we saw in 2017 (480% vs 1,280%)
However, if we assume that the variance between Leg 1 and Leg 2 rhymes then the projected uplift from the LH would be 550%.. making XRP price roughly $11-13
It follows that price will then move sideways/consolidate/capitulate for several months.
Followed by one last move to the upside which, using the variance between Leg 2 and Leg 3 put the final leg @ 585% or $35-39.
Wild guess but based on historical Bitcoin halving peaks and XRP ATH in both cycle 1 and 2 landed at the back end of Q4, it is assumed the same could happen (put simply: the end of 2025).
You're welcome.
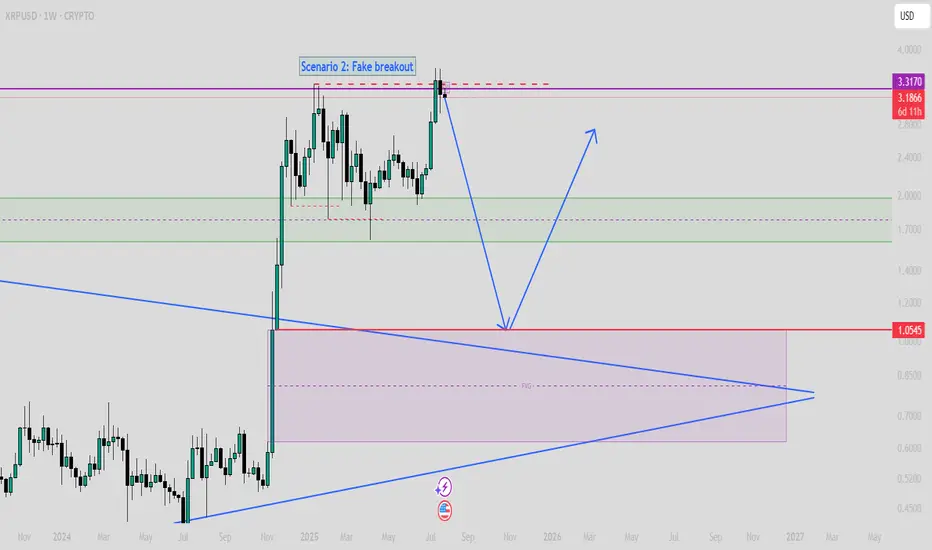
$XRP SCENARIO 2: Fake Breakout (Read caption)If XRP can't close strongly upper than $3.5 on the weekly time frame, then we must consider this scenario!
In this scenario, the first target will be $1.6, and then, based on time, even value around $1 is achievable.

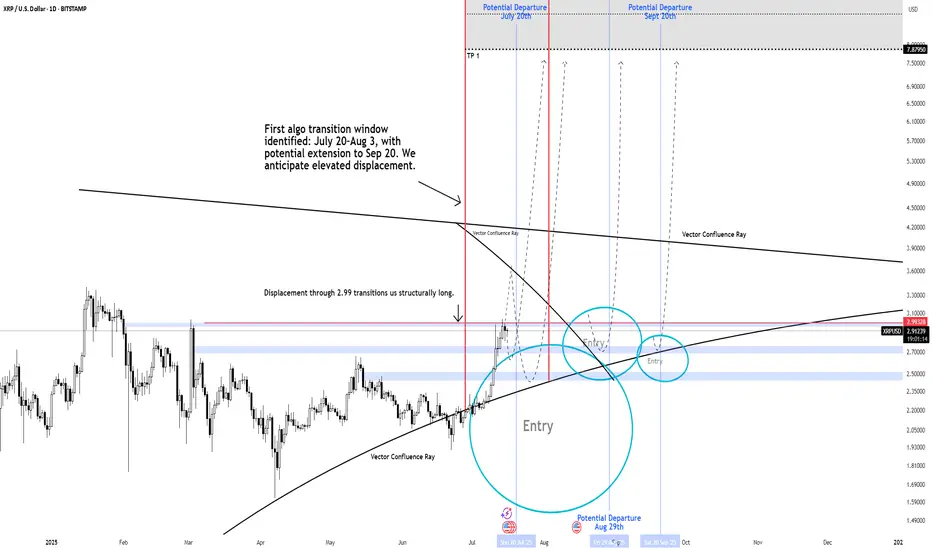
XRP THE $2.99 "NUKE" LEVEL Could Send Price To $30 to $100+ Primary Expansion Window: July 20 – Aug 3, 2025 (potential extension to Sept 20)
XRP is positioned for a structural regime shift. The pivotal $2.99 "nuke" level is on watch a clean break through this price isn't just an ignition, it's the catalyst for explosive directional flow. As algorithms flips long above $2.99, Wave 1 is triggered, opening accelerated risk toward the $30 target during this active expansion window.
Vector Confluence Rays: Dynamic Support/Resistance. order flow and price memory become most active these are potential launch points for expansion or resistance.
Nuke Level ($2.99): The term signals more than a trigger it's the critical inflection where algo's initiate volatility and momentum. When breached, price will accelerate.
What’s Next After Wave 1?
Second Expansion Window: November to December 2025
When momentum and higher timeframe structure persist, a larger breakout framework comes into play with targets of $60, $100, and, in extreme scenarios, $1,500+ if a full structural unlock unfolds.
Key Takeaways
$2.99 is the “nuke” level: The breakout ignition for Wave 1. Algo's are highly likely to accelerate above this line, targeting upwards to $30 within the first expansion window.
Lower probability predictive models do show price can reach $60 Wave 1 in extreme cases.
Expansion windows defined: First window live July–September; second window November–December for further upside potential.
Above $2.99: Upside is highly probable the algo is primed and with years of price suppression means acceleration is very likely once this level breaks.
-Neverwishing