XRP Sits Near Range Lows – Will Support Crack Again?Trend Check:
XRP remains in a clear downtrend after bearish MSB. Price failed to reclaim key levels and is now testing range lows once more.
Indicators:
RSI: 40 (bearish territory)
MACD: Flat and bearish — no clear momentum shift
Structure:
Price is making lower highs and lower lows, showing rejection near prior supply. No signs of reversal yet.
Position: Short bias
Entry Idea: Short under $1.98
Stop: Above $2.07
Targets: $1.82 → $1.65
Reasoning:
XRP is showing weak structure and lack of buyer interest. Breakdown continuation looks likely unless bulls step in quickly.
Market insights

Watch XRP for rally then dumpXRP, as well as many other LARGE
CAP altcoins will be taking early
hibernation in Q1, 2026. Look for
a retest around the dollar area as
this will be a good place for limit
orders. Not saying it's a SHOE in
but I suspect a small rally followed
one LAST BIG shakeout to get weak
hands to fold before EPIC run. Set some
limit orders in this area...you may
just thank me later...
************* HAPPY XRP HUNTING **************

Bullish XRP analysics by MSAXrp bullish angle view must look its rejecting trend line keep eyes on XRPUSD

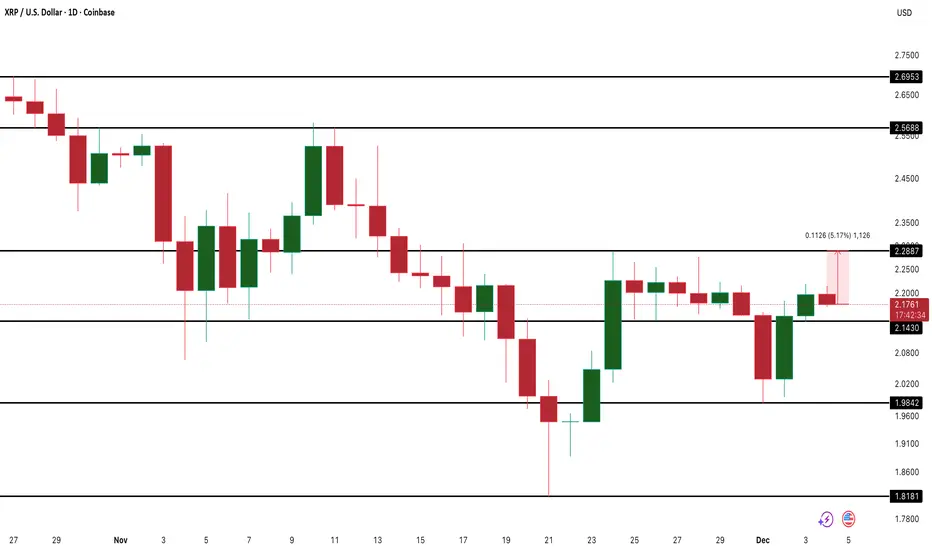
XRP Price Stalls as Key Level Blocks Breakout AttemptCOINBASE:XRPUSD has been stuck inside a narrow range for more than three weeks, and the chart still shows the same clear barrier. The price has failed to close above $2.28, which remains the main resistance controlling any breakout attempt. As long as COINBASE:XRPUSD trades below this level, momentum stays capped and upside targets at $2.56 and $2.69 stay out of reach.
On the downside, $1.98 is the structure line. Losing it exposes the range low at $1.81, where buyers stepped in earlier.
The on-chain side partly supports the bulls. Spent coins have dropped 91%, pushing dormancy to a three-month high and signaling lighter sell pressure from older wallets. But long-term holders are still distributing, which continues to limit trend strength despite the cleaner setup on the COINBASE:XRPUSD price chart.
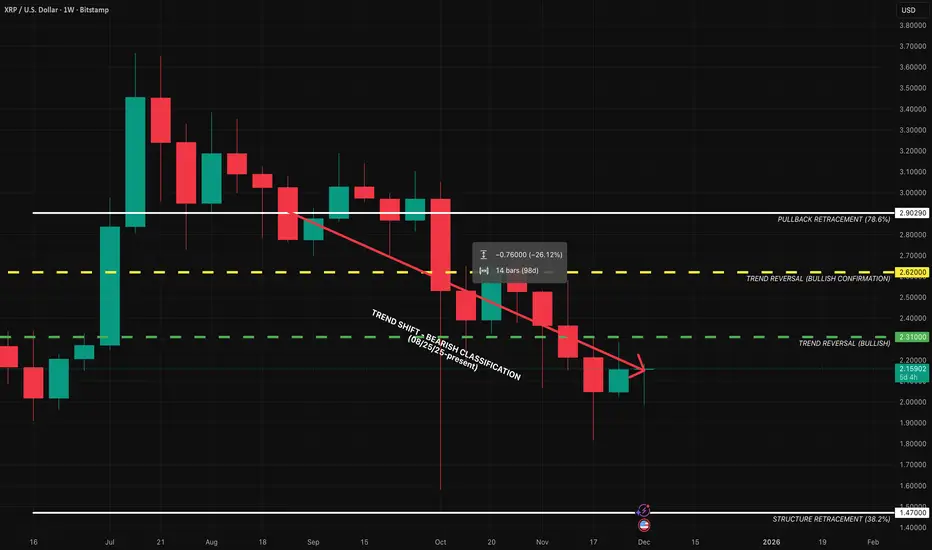
XRP — WEEK 49 TREND REPORTCRYPTOCAP:XRP — WEEK 49 TREND REPORT
Ticker: BITSTAMP:XRPUSD — 12/02/2025 @ 2.15$
Timeframe: WEEKLY
This is a reactive structural classification of XRP based on the weekly chart as of this timestamp. Price conditions are evaluated as they stand — nothing here is predictive or forward-assumptive.
⸻
1) Current Trend Condition
• Trend Duration: +14 weeks (Bearish)
• Trend Reversal Level (Bullish): 2.31$
• Trend Reversal Level (Bullish Confirmation): 2.62$
• Pullback Support: 2.90$
• Structural Support: 1.47$
⸻
2) Structure Health
• Retracement Phase:
Testing Structure (approaching 38.2%)
• Position Status:
Unstable (price below both structural layers)
⸻
3) Temperature
Cooling Phase
⸻
4) Momentum
Bearish
⸻
Author’s Note
This analysis is fully reactive, not predictive. Market conditions, trend structure, and behavior are classified as they appear in real time. The objective is to identify where directional shifts first occurred, where structural integrity remains intact, and where it would begin to weaken if key levels were breached.
Predictive analysis projects outcomes that do not exist yet. Without price confirmation, prediction is built on baseless assumptions. This framework avoids that entirely by responding only to verified structural changes and live conditions.
The levels shown simply identify where the current trend structure first shifted and where it would begin to lose integrity if breached. Recognizing these boundaries allows for clearer interpretation of market behavior without relying on forward guarantees, speculative projections, or unsupported assumptions.
⸻
Methodology Overview
This classification framework evaluates directional conditions using internal trend-interpretation logic that references price behavior relative to its structural layers. These relationships are used to identify when price movement aligns with the framework’s criteria for directional phases, transition points, or regime shifts. Visual elements or structural labels reflect these internal interpretations, rather than explicit trading signals or preset indicator crossovers. This framework is observational only and does not imply future outcomes.
XRP/USD 4H Analysis: Reclaiming the Key Level
XRP/USD 4H Analysis: Reclaiming the Key Level
• Sharp Rebound: XRP has executed a strong V-shaped recovery (marked by the recent large green candle), bouncing aggressively from the lower area of the Downtrend Channel (red area).
• Key Level Reclaimed: Crucially, this rally has successfully pushed the price back above the sig-nificant $2.0 Key Level (green horizontal zone), which it had briefly broken down from, showing renewed bullish interest.
• Consolidation Break: The price had recently broken down from a tight consolidation range, de-fined by the $2.30 Previous Support (grey area) and the $2.0 Key Level, confirming a brief, sharp bearish move.
• Next Resistance: The immediate challenge for this rally is maintaining momentum to retest the $2.30 Previous Support level, which now acts as overhead resistance. Failure to hold the $2.0 level would likely see a retest of the $1.8 Recent Support.

XRPUSD — WEEK 49 TREND REPORT (2D)XRP — WEEK 49 TREND REPORT
Ticker: COINBASE:XRPUSD BITSTAMP:XRPUSD — 12/01/2025 @ 2.02$
Timeframe: 2D
This is a reactive structural classification of XRPUSD based on the 2D chart as of this timestamp. Price conditions are evaluated as they stand — nothing here is predictive or forward-assumptive.
⸻
1) Current Trend Condition
• Trend Duration: +3 BARS (bearish)
• Trend Reversal Level: 2.06$
• Trend Reversal Level ( Confirmation ): 2.26$
⸻
2) Structure Health
• Retracement Phase:
• Testing Structure (approaching 38.2% @ 1.64$)
• Position Status:
• Unstable (price below both structural layers)
⸻
3) Temperature: Cooling Phase
⸻
4) Momentum: Bearish
⸻
Author’s Note
This analysis is fully reactive, not predictive. Market conditions, trend structure, and behavior are classified as they appear in real time. The objective is to identify where directional shifts first occurred, where structural integrity remains intact, and where it would begin to weaken if key levels were breached.
Predictive analysis projects outcomes that do not exist yet. Without price confirmation, prediction is built on baseless assumptions. This framework avoids that entirely by responding only to verified structural changes and live conditions.
The levels shown simply identify where the current trend structure first shifted and where it would begin to lose integrity if breached. Recognizing these boundaries allows for clearer interpretation of market behavior without relying on forward guarantees, speculative projections, or unsupported assumptions.
⸻
Methodology Overview
This classification framework evaluates directional conditions using internal trend-interpretation logic that references price behavior relative to its structural layers. These relationships are used to identify when price movement aligns with the framework’s criteria for directional phases, transition points, or regime shifts. Visual elements or structural labels reflect these internal interpretations, rather than explicit trading signals or preset indicator crossovers. This framework is observational only and does not imply future outcomes.

The clearest path for XRP. Period.
History repeats, this time with the full weight of the financial system behind Ripple/XRPL.
Signal v. Noise: The Power of the Macro StructureMy point ultimately, is that trend lines do matter. They aren’t fluff intended to misdirect or deceive. From the structural floor, to the precise intersection of the lines. It is not by coincidence.
As we know, trend lines are ubiquitous on many time frames but not always do they provide accuracy, rather on smaller timeframes they’re designed to trick you.
However on a large macro time frame there aren’t any coincidences. Probability is all layed out very plain for the eye to see, if you have the eyes to see it, and the time horizon bias to be patient enough to be undeterred by market volatility and not fall victim to over complication of what the chart is telling us.

XRP outcome!XRP did a drop in the Asian session after markets opened up. Possible reversal near this zone going to the London session or a reversal at the bottom of the channel or near it.

XRP - hourly chartupdated an XRP chart
T.A explained -
BackSide (BS)
FrontSide (FS)
Inverse BS (Inv.BS)
Inverse FS (Inv.FS)
BS & FS levels are expected support when dashed lines, tested when dotted and resistance when solid lines.
The inverse is true for the Inv. BS Inv. FS levels, they are resistance as dashed lines, tested as dotted and support as solid lines.
Monthly timeframe is color pink
weekly grey
daily is red
4hr is orange
1hr is yellow
15min is blue
5min is green if they are shown.
strength favors the higher timeframe.
2x dotted levels are origin levels where trends have or will originate. When trends break, price will target the origin of the trend. its math, when the trend breaks, the vertex breaks too so the higher timeframe level/trend that breaks, the more volatility there could be as strength in the orders flow in to fuel the move.

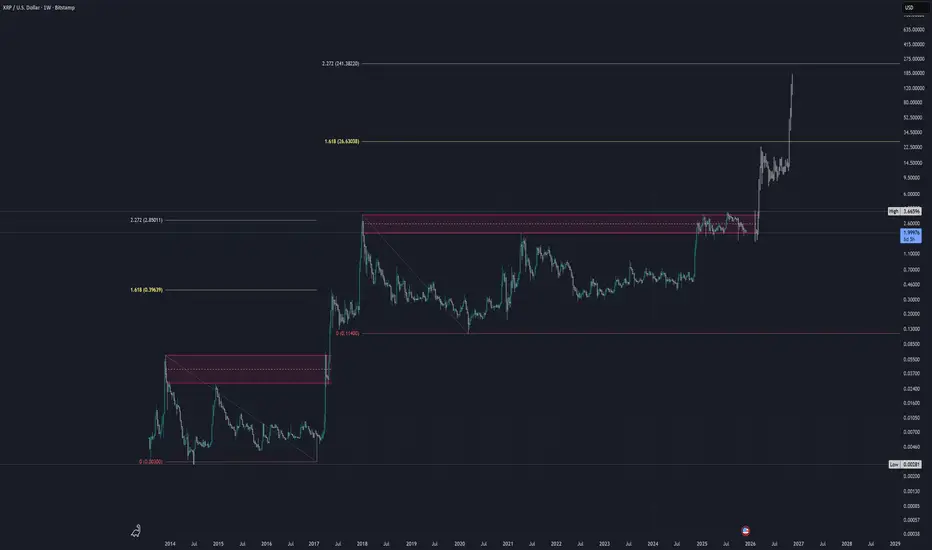
Catch XRP's Run EarlyThis is the 3 month timeframe for XRP but it shows a clear pattern of support along the upper line of the Gaussian Channel indicator
A breakout has already begun but there is potentially more to this run if you compare it to the first bull run.
Support will be found above the broken trend line in red

XRP Consolidating the high volatility is not a weapon when we talk about xrp , we see that it's price is very steady and tend to fluctuate less according to other major crypto ; it's time to start considerating it a strong crypto holding it's investors for long term profit .... stay away from high risk trades


Pump to $4 by Xmas Seen at the daily chart 1D, XRP is primed to reach $4 before end of the year!
IF the following two resistances each are broken with high volume.
Look at arrow 1 & 2.
Smashing through resistance 1 with high volume is still probable.
Smashing through resistance 2 with high volume at $2.60 is possible - and would probably give XRP the push to reach just a little over $4 ~ a new ATH before XMas🎅 The dream ain’t over for 2025… 🎄

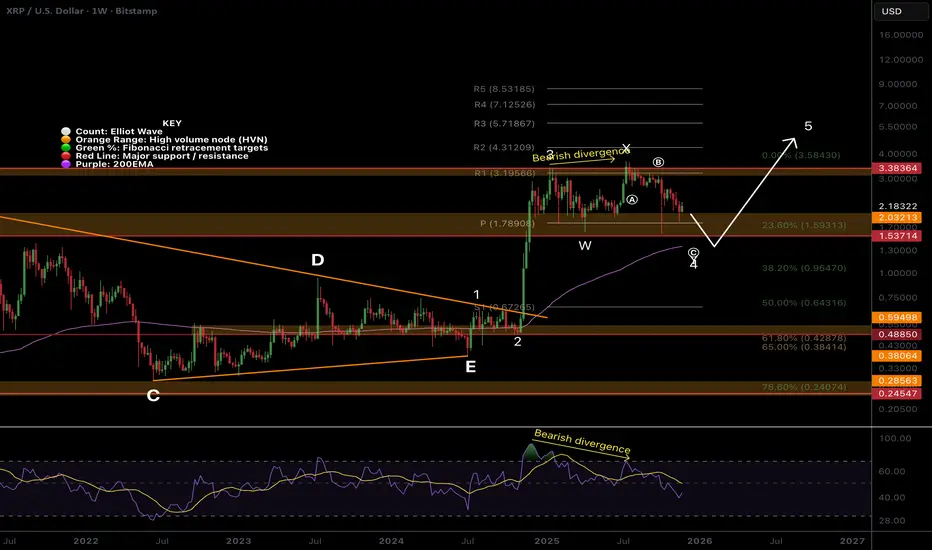
$XRP count changed, wave 4 underwayCRYPTOCAP:XRP Wave 4 appears to be a flat correction defined by the poke above the all-time high. Wave 4 is expected to end at the 0.382 Fibonacci retracement, also the weekly 200EMA ~$1.2.
The multi-year triangle is a penultimate move, so continuation in wave 5 to price discovery is my preferred count. For no,w price is stuck in a range aboev the weekly pivot.
🎯 Terminal target for the business cycle could see prices as high as $4.31 based on the weekly pivots
📈 Weekly RSI is bearish with room to fall after printing bearish divergence
👉 Analysis is invalidated if we fall below $0.64, as wave 4 can not go below 0.55 Fibs
Safe trading
XRP/USD Swing Trade Playbook — Bullish Breakout Profit Pathway📌 Asset:
XRP/USD – “Ripple vs U.S. Dollar” | Crypto Market Profit Pathway Setup (Swing Trade)
📈 Trade Plan (Bullish Bias)
Waiting for a HULL Moving Average breakout above 2.2500 to confirm bullish continuation momentum.
Once price breaks decisively, the structure opens room for a strong push toward the next liquidity zone.
🎯 Entry
Enter any price level AFTER a clean Hull MA breakout with candle body confirmation + volume uptick.
No breakout → No trade.
🛡️ Stop-Loss (Risk Protocol)
SL: 2.0500 — This is the Thief SL, designed to protect capital once breakout is confirmed.
Dear Ladies & Gentlemen (Thief OG’s), adjust your SL according to:
Your personal risk tolerance
Your system’s volatility rules
Timeframe-based noise filtering
You’re not required to follow my SL — trade safe, protect your bag. 🛡️
💰 Target (Exit Strategy)
Our next potential trouble zone — where the police (sellers) are waiting — stands near:
TP: 2.5500
This zone aligns with:
Overbought conditions
Previous liquidity sweep
Correlation pressure from broader crypto sentiment
Dear Ladies & Gentlemen (Thief OG’s), take profits based on your own system. Take money → Leave the market → Stay safe. 💸
🔍 Related Pairs to Watch (Correlation & Confirmation Signals)
1️⃣ BITSTAMP:BTCUSD – Bitcoin
Why watch it?
XRP often follows BTC’s trend.
A BTC breakout boosts liquidity across altcoins.
BTC above key moving averages = XRP tailwind.
2️⃣ BITSTAMP:ETHUSD – Ethereum
Why watch it?
Strong indicator of altcoin strength.
ETH momentum = altcoins tend to expand.
If ETH stalls while XRP breaks → caution (divergence).
3️⃣ COINBASE:XLMUSD – Stellar
Why watch it?
XRP & XLM share similar utility narratives.
High correlation during liquidity rotations.
XLM breakout → XRP often lags then follows.
4️⃣ BITSTAMP:XRPBTC Pair
Why watch it?
Shows whether XRP is outperforming BTC.
Rising XRP/BTC ratio = stronger XRP pump potential.
Falling ratio = breakout may fake out.
🧭 Key Correlation Notes
BTC strength = XRP stability + possible breakout fuel
ALT dominance rising → higher probability XRP joins the move
USD weakness boosts all crypto pairs priced in USD
Watch volatility cycles: XRP typically pumps after Bitcoin’s volatility cools

XRP Still Trapped Below 3.00 – Market Structure Remains BearishXRP continues to struggle under the 3.00–3.20 bearish OB zone. Multiple MSBs printed on the way down, and price is yet to reclaim any key level.
MACD is barely recovering and RSI is hovering just above 50, showing weak bullish momentum.
As long as XRP trades below 2.40–2.50, this bounce is just noise in a broader downtrend.
Bias: Bearish
Pair: XRP/USDT
Timeframe: 12H
This is not financial advice, only data analysis. Please consult a qualified financial professional for personalized guidance.


Bearish Outlook - but month ain’t overThere’s a bearish outlook on the daily chart for the pair PURPLETRADING:XRPUSD. Even though the San Francisco coin made a quite strong recovery, it seems that it’s about to crash even further. But if the bulls can smash this sweetheart above $2.5, maybe we even see a little top off before Xmas. I’m in doubt … I ain’t buying. I ain’t selling.

BTC ETH SOL XRP MSTR Did You Sell Your Bags? Of Course Not!I'm reposting this idea from early this morning because I got banned for a few hours, and the original idea post was hidden, because I mistakenly made a mention to a social media account in the idea description and it's a House Violation.
Now 12hrs later and my original forecast from early this morning now confirmed, here we go:
Last night we had a great SHORT entry and price was unable to break above key resistance channel lines. We should have a CHOPPY next few days so, the forecast is that today was a possible direction change so I closed my SHORTs with a profit and I'll wait for a better entry later tonight or overnight once this brief reaction rally is complete.
I am still expecting the collapse to continue into next week and I'll be entering new shorts as soon as the Stochastic Momentum Indicator confirms Bearish Divergences on each market.
As for MSTR, I misread the forecast and the drop was into today, not tomorrow, therefore we had a bounce into the current Tuesday overnight session and tomorrow Wednesday is a very strong target hence, it should be an important HIGH followed by a continued decline. But either way, if it's a HIGH then my SHORT is already opened, if it's a LOW then I'll close the SHORT when the LOW is complete and open LONGs... 😎

Ripple ETFs Gain TractionRipple’s market expansion into regulated ETFs has accelerated, but short-term price behavior tells a different story. XRP ETF (NASDAQ:XRPI) closed at $11.76 (-2.41%), while XRPR ETF (NYSE:XRPR) finished at $16.51 (-2.02%), both extending declines from prior sessions. Despite the ETF boom, XRP-USD remains subdued near $2.03, down over 40% from its July high of $3.65, highlighting the tension between institutional inflows and market sentiment.
The Bitwise XRP ETF launched on November 20 with waived fees on the first $500 million in AUM and opened with $2.3 million in seed capital. Trading volume exceeded $22 million on day one, underscoring institutional appetite. However, this enthusiasm has yet to translate into a sustained rally. The ETF’s debut coincided with broader market pressure as expectations of Federal Reserve rate cuts faded, dragging major cryptocurrencies lower.
The launch of the Bitwise ETF follows Canary Capital’s XRPC ETF, which recorded $58 million in its first trading day and helped push cumulative XRP-related ETF inflows past $293 million. Collectively, XRPI, XRPR, and XRPC now represent a meaningful portion of institutional exposure to the asset class. These inflows confirm XRP’s increasing acceptance among asset managers but also reveal a disconnect between capital inflow and immediate price performance.
FXStreet data shows that XRP ETFs attracted nearly $16 million in daily inflows this week, while open interest in XRP futures slipped to $3.79 billion from $3.85 billion, indicating muted derivative participation. The imbalance between ETF accumulation and derivatives weakness limits upside momentum and suggests that speculative interest remains constrained.
From a technical perspective, XRP/USD is attempting to stabilize above the $2.00 psychological level, supported by institutional buying via ETFs. Resistance remains at $2.18, coinciding with the 0.236 Fibonacci retracement and a descending trendline from the July 18 high at $3.66. Indicators lean bearish: the 50-day EMA ($2.45) lies below both the 100-day ($2.57) and 200-day ($2.54) averages, forming a death cross pattern. The RSI near 37 signals persistent selling momentum.
The MACD remains negative, reinforcing a cautious outlook. A breakout above $2.45–$2.50 could trigger a short-term rebound toward $2.72, while a failure to defend $1.95–$2.00 support risks accelerating declines toward $1.80.
The Bitwise ETF represents a structural shift rather than a speculative catalyst. It gives U.S. investors direct exposure to XRP, held physically in a trust—not futures-based exposure—enhancing market legitimacy. The 0.34% management fee (waived for the first month) and custodial safeguards make it attractive for traditional allocators. Matt Hougan, Bitwise CIO, described XRP as “an intriguing asset for regulated markets,” emphasizing its efficiency in cross-border settlement.
This ETF joins a crowded landscape: Grayscale and Franklin Templeton are preparing their own XRP ETFs, with launches expected within the next week. The rapid sequence of filings underscores the race to capture liquidity, similar to the Bitcoin ETF wave earlier in the year.
Ripple has been reinforcing its market position through significant strategic moves. Earlier this month, the company raised $500 million in a funding round valuing it at $40 billion, backed by Citadel Securities, Pantera Capital, Brevan Howard, and Galaxy Digital. Partnerships with Mastercard and Gemini aim to integrate stablecoin payments into credit systems, broadening XRP’s practical use cases.
Chairman Alexis Sirkia of Ripple-backed Yellow Network highlighted that ETFs now give institutions a “compliant, known way to gain exposure.” This reflects the company’s ongoing push to bridge blockchain technology with established finance, reinforcing XRP’s role in international settlements.
While Bitwise’s XRP ETF opened strongly in volume, price divergence between ETFs and the spot token illustrates structural lag. ETF flows must be processed through authorized participants, meaning net creation and redemption lag spot movements. As a result, short-term ETF enthusiasm often fails to lift the underlying token immediately. This mirrors early behavior observed with Bitcoin and Ethereum ETF launches, where initial volatility was followed by consolidation.
XRPI traded between $11.61–$12.57 for the day, while XRPR fluctuated from $16.25–$17.56, both near multi-month lows. Despite institutional inflows, this price compression suggests ETF participants are hedging exposure or waiting for confirmation of sustained demand before aggressive buying resumes.
Across the digital asset space, risk sentiment remains fragile. Bitcoin (BTC-USD) fell to $87,000 (-3.3%), and Ethereum (ETH-USD) dropped to $2,861 (-3.6%), mirroring macro-driven outflows. The absence of dovish signals from the Federal Reserve has triggered defensive positioning across all asset classes. For XRP, this environment offsets the bullish momentum from ETF launches.
The Derivatives Open Interest (OI) of $3.79 billion confirms the market’s neutral stance—neither capitulation nor renewed optimism. Sustained ETF inflows exceeding $300 million may stabilize the price, but further upside depends on renewed liquidity from institutional desks.
The ETF launches mark a pivotal milestone for XRP’s institutional adoption, but timing remains key. Structural inflows are slow-moving compared to speculative capital, meaning the XRP price could consolidate between $1.95 and $2.20 before directional clarity emerges. ETF adoption signals long-term confidence, not immediate returns.
With XRPI and XRPR trading at $11.76 and $16.51, both funds sit near the lower end of their 52-week ranges ($11.61–$23.53 and $16.25–$25.99, respectively). These valuations imply potential medium-term upside once rate expectations stabilize and ETF flows mature.
