XRP Holds Gains Amid AccumulationFenzoFx—XRP (Ripple) is up 3.0% today, trading at $2.464 above the 8-period SMA. Rising volume suggests accumulation. If the price holds above $2.318, XRP/USD may target $2.6480. Continued buying pressure could invalidate the downtrend and open the path to the next liquidity zone at $2.956.
However, if the price drops below $2.3180, the bullish scenario is invalidated and accumulation may extend toward the $2.000 psychological level. Traders should monitor support levels closely as momentum builds.
Trade ideas

$XRP is cooking something up. CRYPTOCAP:XRP is cooking something up.
Chart has been inverted, but the story remains the same.
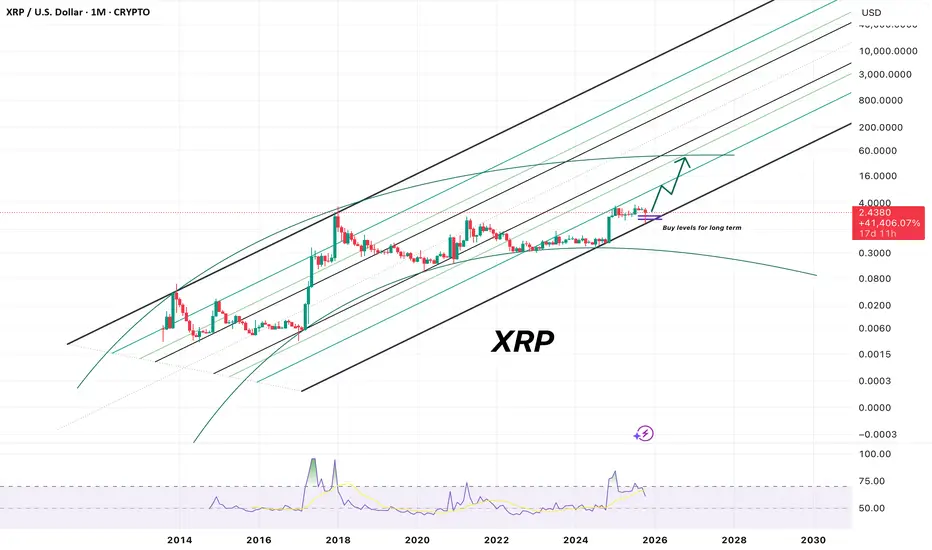
XRP is still gathering strength within the demand zone emerging from the 2018 major resistance.
While the direction may seem confusing, the structure is clear.
The next major move is being prepared to the upside.

XRPUSD 4H SetupPrice has broken out of the downtrend and is now retesting support around 2.40.
As long as price stays above 2.36, I expect a move towards 2.51 → 2.62 → 2.65.
A drop below 2.36 would invalidate this bullish setup

XRP could Sky Rocket!!!XRP is testing at a key SUPPORT zone and if it starts pushing to RESISTANCE there is a good chance in the next couple of months it will break that zone and give lots of profits to holders. 😍🫡

Battle between bears and bulsWe are at the edge to break out from the bears channel , but wait for confirmation and then retest

XRPL | XRP Native TokenYearly levels are in black
monthly levels in pink
weekly levels in grey
daily levels in red
levels are labeled with BS or FS which are support levels as dashed lines, resistance levels as solid lines
Inv.BS or Inv.FS are the inverse of those. They are resistance levels as dashed, support as solid.
Candle science uses these 4 candles to create 6 levels to paint a picture. Not all levels are marked or shown.
enjoy my chART as edutainment. This is an idea for my Chart.Gallery.

$XRP Same scenario, new cycle. XRP cyclical structure is showing a striking similarity once again.
After the major rally in 2017, the price was rejected from the 2013 ATH level and then retested the 2014 ATH level, which had previously acted as resistance. After accumulating strength in this area, it began its parabolic run.
Today, the picture is almost identical..
After the strong surge in 2024, the price was rejected at the 2017 ATH level and retested the 2021 ATH level, which had previously acted as resistance. Now, the power accumulation phase is ongoing in this region.
Following this consolidation, the next parabolic run will be inevitable.
Patience is the most valuable strategy in this cycle.

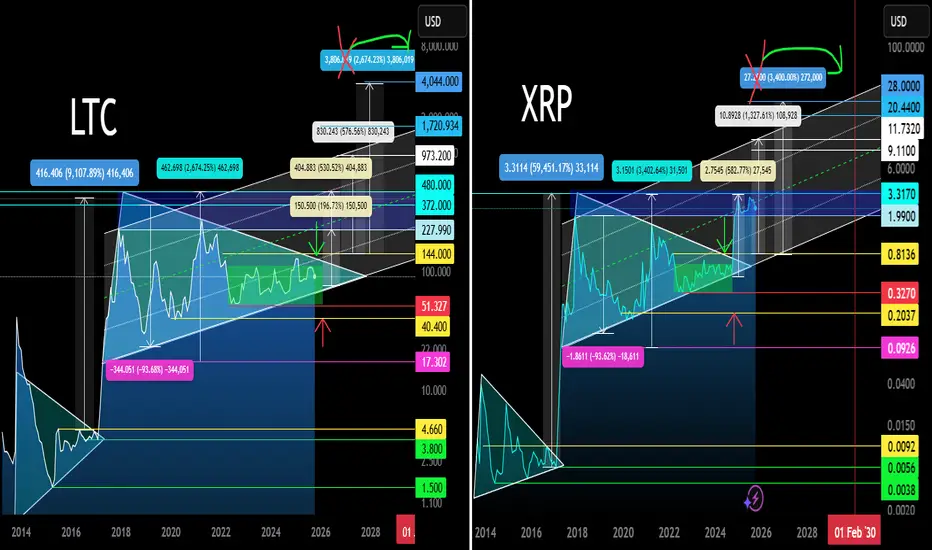
LTC and XRP Fractals. Main Trend. Triangles 10/18/2025Logarithm. 1-month time frame. Larger time frame for comparison and clarity. XRP is ahead of LTC by 1 year, where a breakout of the 7-year formation and the first wave of strong price growth (pump impulse of 500-600%) have already occurred. There will be 3 of them.
🟣⚠️ But, perhaps a retest of the formation's breakout zone, based on a super-fabulous and funny story, will happen very soon from a trend perspective. This is, more accurately, a retest of human intelligence worldwide, the clarity of common sense (perhaps there will be no reaction, and the scenario will fail to capture the public's attention), which could impact speculative markets as a whole.
In general, cryptocurrencies like Litecoin (scam protection) should be of interest to those with common sense but who understand that trading isn't their thing. You buy in increments and forget about it. That is, for investors... Perhaps it would be of interest to positional traders (trades once a year or several months) after a breakout on a pullback, or trigger trades on breakouts of local zones.
An idea for comparison that could impact your trading strategy. Don't be confused by the large percentage pumps in 2017 to initiate the formation of the triangles of these 7–8 years. Cryptocurrency in the "reset waves" has long been redistributed. However, this doesn't negate risk management, not like some silly “book” that says to squeeze your coins out of you in reversal zones, but rather as common sense and math dictate. Also, set reasonable targets, depending on the timeframe of your trading strategy, for liquidity accumulation levels and those willing to sell. Don't set limit orders in round numbers, either sell or buy.
🟡 On Litecoin cryptocurrency, the price is still trapped , ahead of a potential breakout (highly likely). It's possible they'll make a false takeout and accumulate long liquidity under the 7.8-year formation before breaking out of the triangle, but that's not a given.
LTC ETF to be adopted in the US later . But overall, everything will be fine. Currently, with the price clamping down (over the last six months), we've seen high network activity and an increase in the number of addresses (the banking sector is “testing” + a little large capital) without price growth or positive news. Of the top cryptocurrencies, LTC is currently an underdog, which is logical, as positions are being built up in a local trend after a major redistribution (change of hands). This is a good sign.
🟡 Work in the secondary trend I'll publish later, possibly a public idea. However, here I've shown the maximum targets for both an upward breakout (more likely) and a downward breakout (rare, perhaps, perhaps liquidity accumulation).
A chart pattern (trends, figures, fractals, patterns) is formed according to the general market trend (market phase) and the asset's liquidity (money in the project). What is a projection (paragraph below).
The price movement direction is determined by:
1️⃣ real supply/demand for the "commodity."
2️⃣ manipulative supply/demand.
3️⃣ intellectual degradation of market participants and their control and predictability.
4️⃣ intellectual “insight” into how things “should” or “shouldn't” be. This is usually the result of points 2 and 3 (the formation of a dominant opinion), and very rarely a personal opinion that can be used to develop one's own trading tactics and money management.
Wyckoff Distribution Scheme 1I still remain bullish on xrp dispite what happend last Friday but I think the real manipulation was above the flush

My only remaining hope for XRP !!!I might be wrong and this might never happen, but it might come true From a technical perspective!!!

XRp On Long ( Cnagda Pure Price Action Test )Hello Our indicator shows XRP distribution. XRP has been in a downtrend for some time now, and it looks like it could rebound from here. We plan to go long here. You can learn how it works from the indicator description.
Time Frame - 1Hour
Entry - 2.173
Sl - 2.183
Tp 1 - 2.3294
tp2 - 2.4246
Selling volume has declined over the past eight hours, while bullish volume has increased. Several buyer traps have already been set, and now it appears the market is ready to reverse direction.

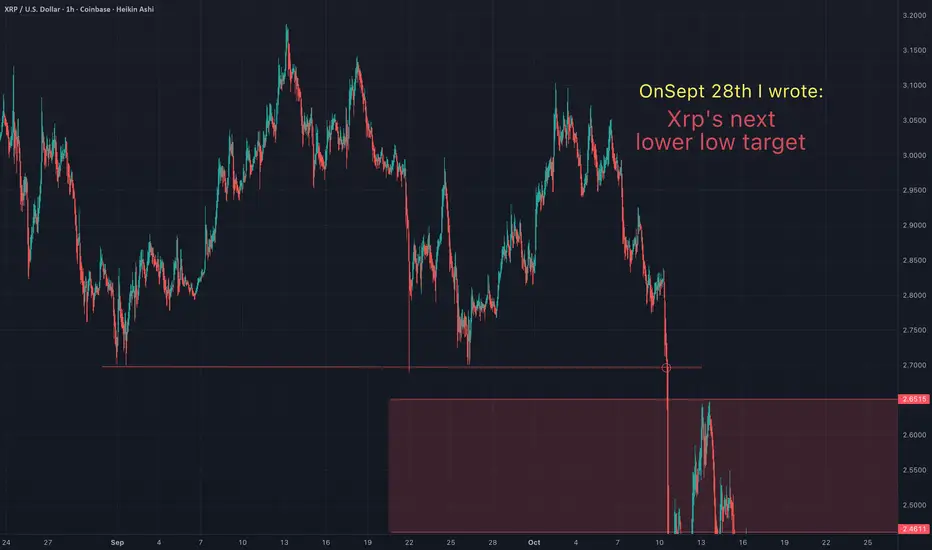
You will ask yourself "how did he know Xrp would do that"?On Sept 28th I suggested that Xrp was headed for a lower low. Congrats to all of you that took that trade and are in profit. The "3 Red Week Down Rule" played out as anticipated. TA works!
May the trends be with you.
XRPUSD Bearish Cross pushing it down to $1.9350 t least.XRP (XRPUSD) has been trading within a Channel Up for almost 1 year (since November 26 2024) and just before last Friday's flash crash, it formed a 1D MA50/100 Bearish Cross. This came after the pattern has already started its 2nd Bearish Leg (red Channel).
The last 1D MA50/100 Bearish Cross was formed post half-way through the previous Bearish Leg and resulted into a bottom just below the 0.786 Fibonacci retracement level. Since there are no news in the market that can drastically alter the bearish sentiment following the renewed U.S. - China trade tensions, we have no reason to expect that the current Bearish Leg won't reach again the bottom of the Channel Up at least.
Our Target is therefore 1.9350 (marginally below the 0.786 Fib). If the Bearish Leg repeats the % drop of the previous one (-52.42%), it can even break to 1.7500 (still within the Channel Up on a logarithmic scale). A break above the 1D MA100 (green trend-line) would invalidate this bearish structure.
-------------------------------------------------------------------------------
** Please LIKE 👍, FOLLOW ✅, SHARE 🙌 and COMMENT ✍ if you enjoy this idea! Also share your ideas and charts in the comments section below! This is best way to keep it relevant, support us, keep the content here free and allow the idea to reach as many people as possible. **
-------------------------------------------------------------------------------
💸💸💸💸💸💸
👇 👇 👇 👇 👇 👇

You will ask yourself, "how did he know Xrp would do that"?On Sept 5th I wrote, "Based on my statistical analysis of the "3 week down rule", I anticipate Xrp retracing from one of these 3 targets to form a lower low". Congrats to all who rode the gains up to the 3rd target and shorted the top. Also, as expected, Xrp got the lower low for all the doubters of the "3 Red Week Down Rule".

XRP short to 1.814$ - we predicted this weeks ago!please see the linked idea that we predicted this on here.
we should comfortably see price settle and trade around here properly instead of wicking within the next few days to weeks.

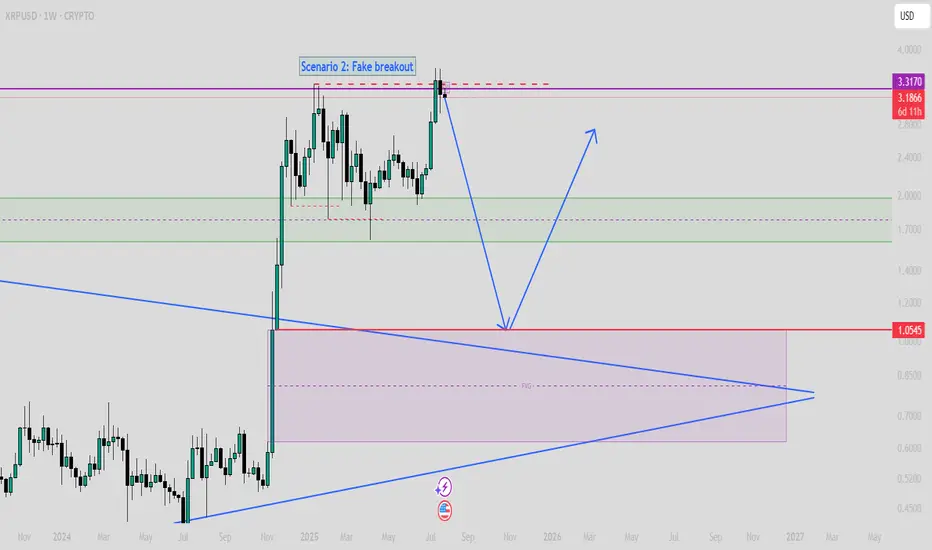
$XRP SCENARIO 2: Fake Breakout (Read caption)If XRP can't close strongly upper than $3.5 on the weekly time frame, then we must consider this scenario!
In this scenario, the first target will be $1.6, and then, based on time, even value around $1 is achievable.
XRP – another rally incoming?There are really only two options: either the market reached its final top in July 2025, or we’re about to see a new wave of strong growth. Considering that the triangle pattern on XRP had been forming for 7 years and that smart money was accumulating the cryptocurrency throughout that time, I would bet that we’re heading for a continuation of the uptrend in the coming months. An altseason is ahead of us, and XRP could be one of its leaders.
Bear scenario for comparison:

XRPUSD Bullish/Bearish ScenarioMY XRP brain storm for this crucial point in the market. It really is sitting at a critical point and the next move decides direction. He are the possibilities.

Xrp - This chart is only bullish!💰Xrp ( CRYPTO:XRPUSD ) is pointing higher:
🔎Analysis summary:
Yes, Xrp has been consolidating for the entire year of 2025. But looking at obvious market structure, Xrp is preparing for another move higher. And even if we see a -50% correction, the path of least resistance remains towards the upside. This bullrun is clearly not over.
📝Levels to watch:
$2,0, $3,0
SwingTraderPhil
SwingTrading.Simplified. | Investing.Simplified. | #LONGTERMVISION

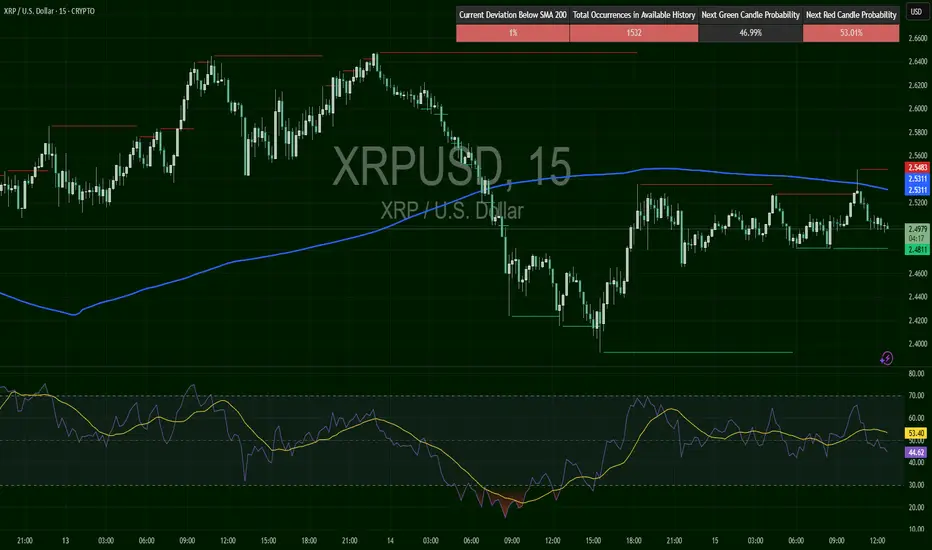
XRP/USD – Compression Beneath the Trendline📉 Bias: NEUTRAL-to-SHORT
XRP trades near $2.50, consolidating just under the SMA200 ($2.53) after momentum cooled from the $2.55 zone. RSI at 48 signals balance, but repeated failures at resistance tilt risk lower.
A close below $2.48 may trigger continuation toward $2.42, while a break above $2.55 invalidates the short setup.
📊 Key Levels:
Resistance: $2.53 / $2.55 / $2.62
Support: $2.48 / $2.42
My thoughts on XRPMy thoughts on XRP are simple.
We created 2 triangle formation patterns and both of this patterns broke out to the upside.
Currently we are retesting broken resistance which is a normal process. It seems that the broken triangle is now acting as strong support.
The price is now fluctuating between support and resistance while the RSI levels are cooling off.
The upcoming ETF approvals and the fact that Ripple is expanding there business on a rapid speed, in confluence with the current chart let me believe that we will see a bullish breakout in the near time future.
My personal target is around 15 dollar, but it can go probably higher.
Let me know in the comments what your thoughts are and how you think XRP will preform in the future.

Xrp super cycleBeen a while , things didn’t go as expected for many of the coins and some of mine as well which I will update today , the amount of frustration and hopelessness I see is crazy , people getting off the market with loss specially after recent event of liquidation, waiting took so long and promised Altseason didn’t came as many of us anticipated it for October and late 2024 , this all gives me clue to expect something more , different and exciting.
Looking at dino coins they seems like getting ready to do something extraordinary, something they couldn’t manage to do last cycle and that is going beyond expectations, I see many of them including XRP getting ready for that , I believe we haven’t finished any altseason and in fact we didn’t even start it yet , giving it the momentum it shall start from next month and extend through the next year till late September and October , what I have in mind is that all markets in order to trap your money and keep you inside have to have a cycle including Alts .
So what we witnessed in the last few years should eventually gives us something we can use and be happy for .
I’m gonna add XRP to my bag but please be aware that this is my own personal decision and I won’t be responsible for your losses.
Wish you all the best .
XRP DRAW ON LIQUIDITY CAN PUSH IT TO A POSSIBLE $6 LEVELThe recent weekly candle on XRP shows that there is a possibility that a weekly draw on liquidity has occurred, and a parabolic move into higher prices is more open. Let's see how it goes by the end of 2025
