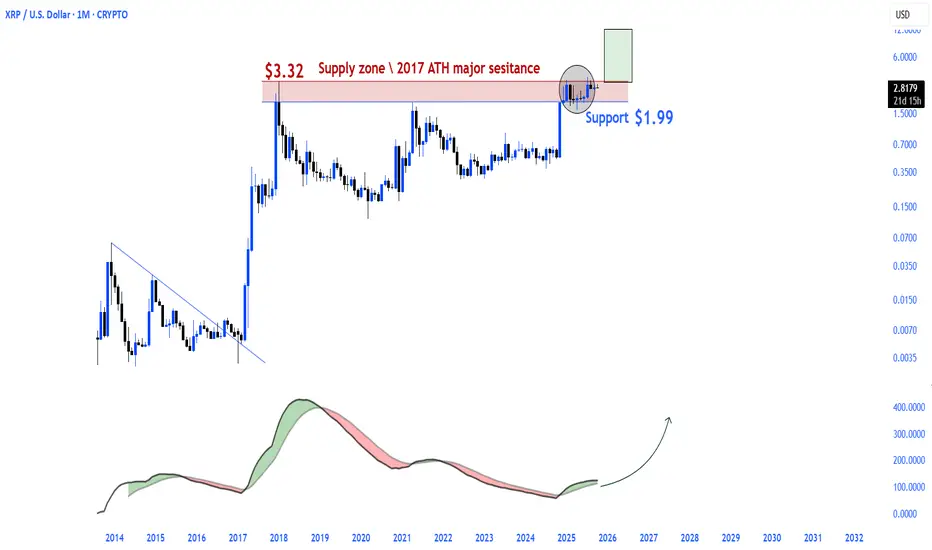
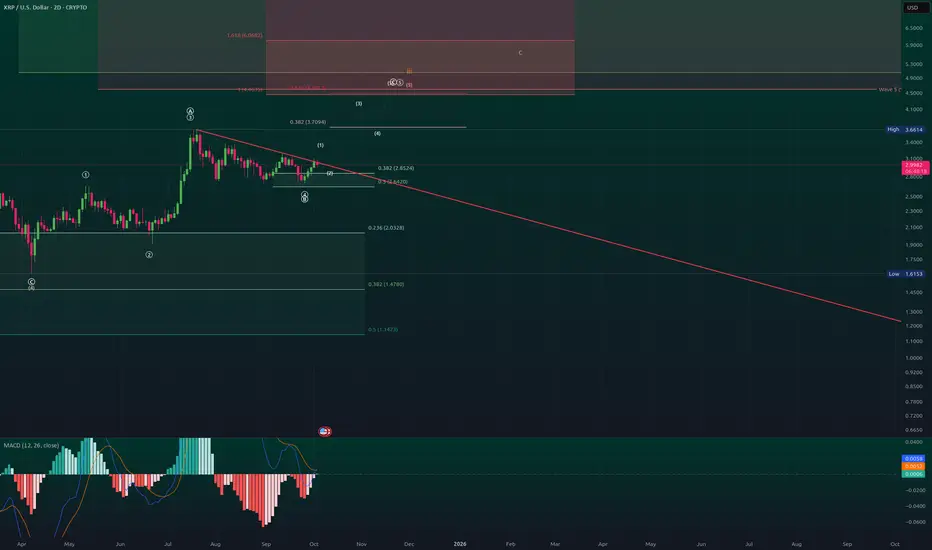
$XRP Explosion After Re-Accumulation.XRP has been strengthening in a horizontal consolidation pattern for quite some time.
The $3.32 region, which was the 2017 peak, was retested on the monthly chart and rejected.
This level was a significant resistance area in the past, but it is now a pivot point that could potentially open the door to a new parabolic rise.
Major support at $1.99, staying above this level confirms the bullish reversal of the structure.
The momentum indicator is in an area where it could move upward.
This table may signal the awakening of a giant that has been silent for a long time.
Emerging from the re-accumulation phase is not always without surprises.
Market insights
XRPUSD BUY 2.7440On the 4-hour chart, XRPUSD is fluctuating and falling. Currently, we can focus on the support near 2.7440 below, which is a potential buying position for a bullish bat pattern and is also within the previous demand zone.

XRP USDThe increase in xrp usd resembles that of 2017.
If we use the fiblevels, the following targets are visible.
trade safely and do your own research!

XRP last downtrend before the STormRipple is one of the few promising project that i'm optimist about, nevertheless its seems like we are having our last retracement before skyrocket to some new highs

XRPUSD: The Immediate Recovery Test
XRPUSD: The Immediate Recovery Test
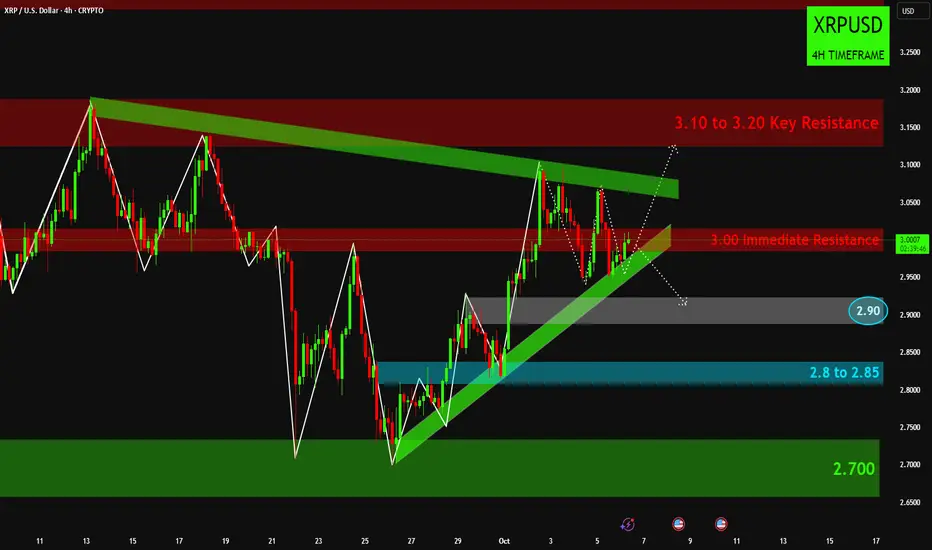
XRP (XRPUSD) on the 4-hour timeframe has recently broken down from its ascending structure and is currently trading around 2.8780, consolidating above the "2.8 to 2.85" support zone after a bounce.
Bullish Scenario: For a recovery, XRP must reclaim and sustain trade above the "2.90" level, indicating a potential push towards the "3.00 Immediate Resistance" and, if overcome, a retest of the "3.10 to 3.20 Key Resistance."
Bearish Scenario (Immediate): If XRP fails to break above the "2.90" level and faces rejection, it would likely retest the "2.8 to 2.85" support, with a breakdown from this range indicating further weakness.
Bearish Scenario (Deeper): A sustained move below the "2.8 to 2.85" zone would pave the way for a deeper correction towards the "2.700" support level, which is a critical point for the asset's longer-term outlook.
Disclaimer:
The information provided in this chart is for educational and informational purposes only and should not be considered as investment advice. Trading and investing involve substantial risk and are not suitable for every investor. You should carefully consider your financial situation and consult with a financial advisor before making any investment decisions. The creator of this chart does not guarantee any specific outcome or profit and is not responsible for any losses incurred as a result of using this information. Past performance is not indicative of future results. Use this information at your own risk. This chart has been created for my own improvement in Trading and Investment Analysis. Please do your own analysis before any investments.

XRPUSD - A Realistic Indicator?This indicator predicts a massive increase for XRP with tops at $100
That is a massive move on this Weekly timeframe
What do you think?
Indicator Idea

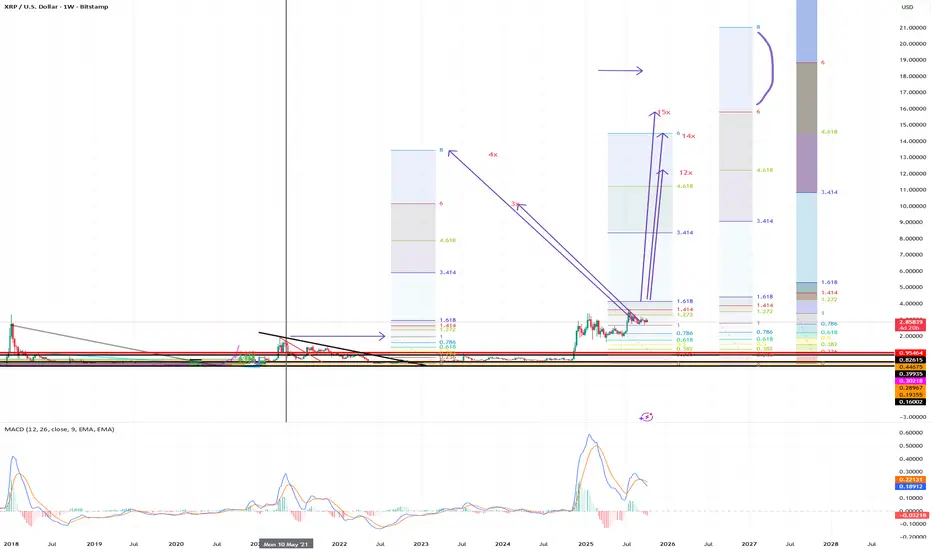
xrp 14 18 24Although we could expect 24 or more, it is possible that the very strong setback, in March 2025, could just let us get 10usd-12usd. If something goes wrong, only 6usd
XRP SHORT TIME BUYSNot a Financial Advice but it means a lot. XRP short time buys to the levels around 2.9995
XRP May Extend Bearish MomentumFenzoFx—XRP (Ripple) is in a bear market, trading around $2.847 after failing to hold above the bearish FVG resistance at $2.966. It dipped and tested lows at $2.699.0. The outlook remains bearish while XRP/USD trades below the fair value gap. If this level holds, price may break below $2.6990, with potential downside extending to $2.339 if selling pressure increases.
Please note, the bearish view is invalidated only if price closes and stabilizes above the $4,250.0 resistance.

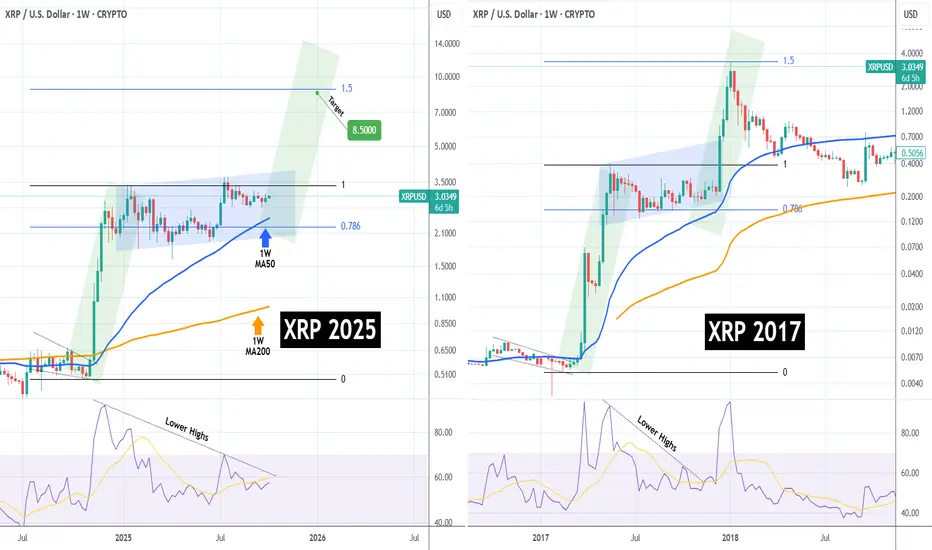
XRPUSD getting ready for its NOW-or-NEVER moment to $8.500XRP (XRPUSD) has been trading sideways since the July 14 2025 High in a growth pattern that resembles 2017. As it approaches the 1W MA50 (blue trend-line), the market gets closer to its now-or-never moment as the 1W MA50 is expected to hold and provide a bullish boost similar to December 11 2017, which made the price rally to its 1.5 Fibonacci extension.
With even the 1W RSI sequences among the two fractals also looking identical, we can see XRP peaking around $8.500 (Fib 1.5 ext), if this model repetition is completed.
-------------------------------------------------------------------------------
** Please LIKE 👍, FOLLOW ✅, SHARE 🙌 and COMMENT ✍ if you enjoy this idea! Also share your ideas and charts in the comments section below! This is best way to keep it relevant, support us, keep the content here free and allow the idea to reach as many people as possible. **
-------------------------------------------------------------------------------
💸💸💸💸💸💸
👇 👇 👇 👇 👇 👇
XRPUSD 4H: Breaking $3.00 - Next Stop 3.10-3.20 if Support HoldsXRPUSD 4H: Breaking $3.00 - Next Stop 3.10-3.20 if Support Holds!
XRP (XRPUSD) is currently exhibiting strong bullish momentum on the 4-hour chart, having rallied significantly from the "2.700" strong support and now trading at 3.000.
The price has successfully pushed above the "3.00 Immediate Resistance" level but is now facing a retest of this level after reaching the lower bounds of the "3.10 to 3.20 Key Resistance" zone.
A potential retracement from current levels could see the price retest the ascending green trend line or the "2.90" level, which would act as crucial immediate support for buyers to step in.
Maintaining price action above the "2.8 to 2.85" zone and ultimately the "2.700" strong support is essential for the bullish structure to remain intact and for further upside potential towards breaking the 3.10-3.20 resistance.
Disclaimer:
The information provided in this chart is for educational and informational purposes only and should not be considered as investment advice. Trading and investing involve substantial risk and are not suitable for every investor. You should carefully consider your financial situation and consult with a financial advisor before making any investment decisions. The creator of this chart does not guarantee any specific outcome or profit and is not responsible for any losses incurred as a result of using this information. Past performance is not indicative of future results. Use this information at your own risk. This chart has been created for my own improvement in Trading and Investment Analysis. Please do your own analysis before any investments.
XRP/USD — Breakout Playbook 2-Day ChartXRP — Breakout Playbook (Weekly Context + 2-Day Execution, With Divergences & Wave Map)
1) Market position (where price sits now)
Price is compressing beneath a descending trendline and just under a horizontal range ceiling after a strong upside impulse.
The prior pullback held inside the mapped support box (approx. 2.85–2.64 on the chart), keeping the higher-timeframe up-leg viable.
2) Momentum state & divergences
Now (2-Day): Regular bullish divergence printed into the box: price made an equal/lower low while the MACD histogram made a higher low. This signals seller fatigue into support and raises the odds that a valid break can sustain if participation appears.
Anticipated (near resistance): Regular bearish divergence risk is elevated into 4.46–4.60 and again near 5.05. Expect momentum to lag if the move matures; divergence there often precedes a reaction.
On the throwback: a successful retest frequently forms hidden bullish divergence (price makes a higher low while momentum makes a lower low). That pattern supports the “acceleration” phase.
3) Wave roadmap (now → next)
Primary count on the breakout path
The current advance is mapped as micro A–B–C, with C ≈ A (1:1) clustering in the 4.46–4.60 band; a higher-hierarchy objective resides around 5.05.
After the first clean break, the standard path is: Wave 1 up through the ceiling → Wave 2 throwback to retest the broken trendline/ceiling → Wave 3 extension targeting 4.46–4.60, with potential continuation toward 5.05 if momentum holds.
What qualifies the Wave-2 retest
Pullback respects the former cap (trendline/ceiling acts as support).
The reaction back up shows volume expansion and improving momentum.
The Wave-2 low stays above the Wave-1 origin (structure intact).
4) Breakout qualification (must see both)
Close through the cap and range high on the 2-Day.
Participation: volume clearly above recent average on the break.
→ After that, a weekly close that holds above the level promotes the move from tactical to structural.
5) Path after confirmation (scenarios)
Base scenario — continuation with throwback
Break → throwback to the breakout line (common) → hold → acceleration.
Wave-3 behavior: broad bars, rising participation, momentum improving.
Targets by confluence on the chart:
4.46–4.60 (equality/congestion band) = first reaction zone.
~5.05 = higher decision area; expect a larger battle there.
Alternate bullish — deeper retest first
If the breakout wicks and fails to stick on the first attempt, a deeper retest into the upper half of the support box can still resolve higher, provided weekly structure remains intact and momentum rebuilds.
Bearish/failed break
Pop above resistance without volume, followed by a close back inside the range = false breakout risk; immediate de-risk and await a fresh setup.
A new closing low below ~2.64 (box floor) breaks the structure of the current weekly idea.
6) Risk, invalidation, and management
Tactical invalidation (post-break): a 2-Day close back under the reclaimed level on rising volume.
Structural invalidation: weekly close back inside the prior range after confirmation, or loss of the most recent weekly higher low.
Stop logic: trail beneath successive 2-Day swing lows during the advance; after weekly confirmation, management can widen to weekly swings to respect higher-TF trend.
Profit handling: expect churn and potential bearish divergence at 4.46–4.60; partials are reasonable there. If momentum/volume remain constructive, leave a runner toward ~5.05.
7) Execution checklist (pin next to the chart)
2-Day close above the descending cap and the horizontal ceiling ✅
Volume expansion on the breakout bar(s) ✅
Weekly close holds above the break ✅
Throwback: test of former cap; holds as support ✅
Wave-3 tells after the retest: broader candles, improving momentum, higher participation ✅
Zones to manage: 4.46–4.60 (reaction/divergence risk), then ~5.05 (bigger decision).
Failure tells: quick close back in range, retest breaks down, or fresh weekly lower low → stand down.
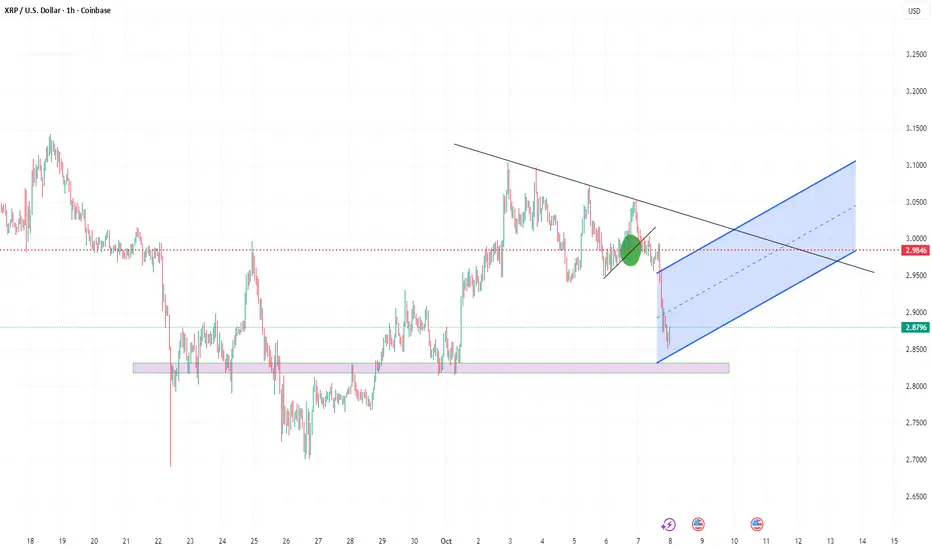
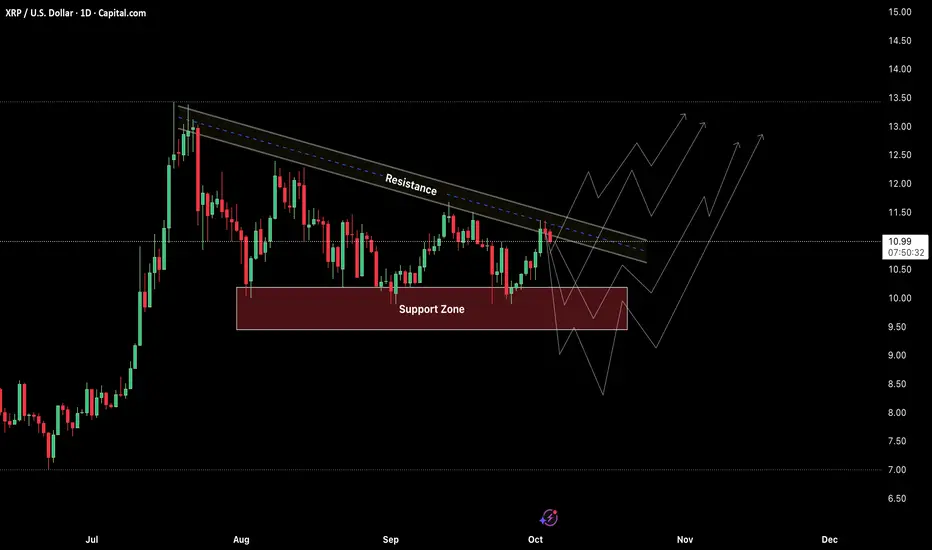
XRP: Decision Time! Up or Down?this chart for XRP shows us two main lines:
A: Resistance Line): XRP has been trying to go higher since July, but it keeps hitting a sloped ceiling and bouncing back down. It's hitting that ceiling again right now.
B: (Support Zone): There's a strong floor below XRP where it usually finds buyers and stops falling.
What could happen next?
Go Up (Bullish): If XRP can break through that ceiling it's hitting now and stay above it, it could start moving much higher, maybe towards $12, $13, or even $14.
Go Down (Bearish): If it fails to break the ceiling and instead breaks below its strong floor, it could fall lower, maybe towards $9 or even $8.
Right now, XRP is at a very important spot. The next few days will likely show us if it's going to break up or break down. It's like a coiled spring, ready to jump one way or the other!
XRP at a critical momentThe Alpha View on XRP
CRYPTOCAP:XRP at a critical moment:
Daily close above 3.07 = bullish continuation.
Healthy retrace = 2.83 as fresh support.
Lose 2.73 and the #XRParmy might face a full-blown meltdown.
Stay Sharp. Stay Regulated.

XRP BIG Whales are moving it's the end of the year and it is obvous that big whale will start looking for promising crypto and as BTC startv losing legitimacy a lot of them traders will start looking for close profits .... hang on your profits the wave is starting on XRP

XRP Holds $2.30 Support as Bulls Eye Breakout Toward $3.45XRP continues to defend the $2.30 level, a crucial support that has been tested repeatedly by bulls. With dynamic resistance pressing price into an apex, the stage is set for a breakout backed by volume.
The price action on XRP has reached a critical juncture. For weeks, buyers have managed to hold the $2.30 support region, which has acted as a dependable base despite several tests. At the same time, descending dynamic resistance has been compressing price into an apex structure, increasing the probability of an imminent breakout. This confluence between firm horizontal support and downward resistance highlights the importance of the current consolidation zone.
Key Technical Points:
- $2.30 remains a key defended support level for XRP.
- Dynamic resistance is compressing price into an apex, increasing breakout probability.
- A confirmed breakout could send XRP back toward $3.45 resistance and beyond.
XRP’s consolidation above $2.30 underscores the strength of this level as a technical anchor. Multiple retests have failed to break it, suggesting strong commitment from buyers. Market structure here is constructive, showing that despite downward pressure, bulls have consistently absorbed selling activity.
The descending dynamic resistance line has created an apex structure. In technical analysis, such compression zones are often precursors to large breakouts, as they represent an area where supply and demand forces converge tightly. The longer XRP holds this pattern without losing support, the higher the probability that the breakout resolves upward.
Volume will be the key confirming factor. Without sufficient influx of bullish momentum, any breakout attempt risks becoming a failed move, leading to renewed downside pressure. However, the alignment of horizontal support, compression, and overall bullish bias in the market makes the upside scenario more probable.
The next key objective is the $3.45 resistance level, which has previously acted as a ceiling for price. A successful retest of this level would indicate not only the strength of the breakout but also the continuation of XRP’s broader bullish trend. If $3.45 is reclaimed, XRP could extend to even higher levels, reinforcing its market position as one of the leading altcoins.
What to Expect in the Coming Price Action:
XRP remains bullish while $2.30 holds. A breakout from the apex, supported by volume, would likely see price rotate toward $3.45 and potentially higher. Failure to generate momentum, however, could prolong the consolidation phase before a decisive move is triggered.

$4.66 aheadXRP just broke out of months long bullish pennant formation & retested successfully on the 5m chart. If support holds, a retest of ATH is next with a possible breakout to $4.66 on the table

All Aboard XRPI think from here we have built a pretty strong support around $2.94-$3. I expect crypto to take over the gold rally as the treasury looks into creating a digital asset reserve first starting with bitcoin. The government shutdown should give boost to this initial rally.
-This is not financial advice good luck!

XRP Ready for Breakout – Bullish Continuation Ahead!
XRP is showing strong bullish structure:
Price is consolidating inside a descending triangle, approaching breakout levels.
RSI bouncing from neutral zone, signaling renewed bullish momentum.
Next resistance is $3.18, and a breakout targets $3.56 ATH retest, with extensions toward $4.50+.
The setup strongly favors the bulls — momentum, structure, and Fibonacci alignment all point to the next leg higher.

XRP (XRP) Bulls Eye $3.00 as Momentum BuildsXRP (XRP) Bulls Eye $3.00 as Momentum Builds
XRP (XRP) is demonstrating clear bullish momentum on the 4-hour timeframe, having rallied significantly from the "2.700" support zone and is now trading at 2.98, pushing into an ascending channel.
The price is currently challenging the "3.00 Immediate Resistance" level, with the critical "3.10 to 3.20 Key Resistance" zone serving as the next major hurdle for further upside.
A potential retracement from current levels would find initial support around "2.90," which aligns with the upward trendline of the active channel.
Maintaining price action above the "2.8 to 2.85" support zone is crucial to sustain the current bullish structure and confirm the continuation of the uptrend.
Disclaimer:
The information provided in this chart is for educational and informational purposes only and should not be considered as investment advice. Trading and investing involve substantial risk and are not suitable for every investor. You should carefully consider your financial situation and consult with a financial advisor before making any investment decisions. The creator of this chart does not guarantee any specific outcome or profit and is not responsible for any losses incurred as a result of using this information. Past performance is not indicative of future results. Use this information at your own risk. This chart has been created for my own improvement in Trading and Investment Analysis. Please do your own analysis before any investments.

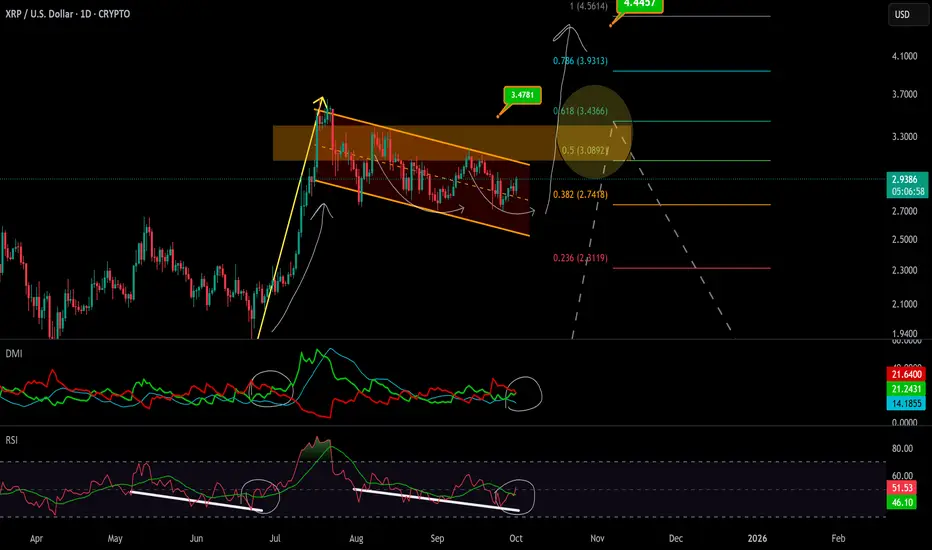
XRP Bull Flag | Ready to ExplodeRipple was rejected by SWIFT, they didn’t use it.
But you think the community will also abandon it?
Not at all — in fact, XRP must have had something that scared them, which is why they avoided working with it.
A hidden bullish divergence on the RSI,
and a repetitive behavioral pattern on the DMI indicator tell us:
We are moving rapidly toward $0.456.
XRP Fractal ExtendedI took the fractal that I previously posted and just dragged it out to the my timeframe of what I think a top will be for BTC and XRP. Same fractal, just extended for time. This is just speculation.

XRP's Comeback: Breaking $3.00 Resistance?XRP's Comeback: Breaking $3.00 Resistance?
XRP is currently demonstrating a nuanced recovery on the 4-hour timeframe after experiencing a significant downtrend, indicated by the prominent red descending trendline. We've seen a bot-toming process around the 2.700 support level, which initiated the current upward trajectory.
The price has successfully broken above the initial descending resistance and is now navigating an ascending trendline, signaling increased buying interest and higher lows. XRP is currently consolidating within a tight range, testing the immediate resistance zone between 2.95 and 3.00.
A sustained breakout above this 2.95-3.00 resistance would be a strong bullish signal, potentially targeting the more significant 3.20 key resistance level. Conversely, a failure to hold the ascending trendline or a drop below the 2.8 to 2.85 support band could see XRP retesting the 2.700 lev-el. The overall sentiment suggests a cautious optimism for continued recovery as long as the ascending structure remains intact.
Disclaimer:
The information provided in this chart is for educational and informational purposes only and should not be considered as investment advice. Trading and investing involve substantial risk and are not suitable for every investor. You should carefully consider your financial situation and consult with a financial advisor before making any investment decisions. The creator of this chart does not guarantee any specific outcome or profit and is not responsible for any losses incurred as a result of using this information. Past performance is not indicative of future results. Use this information at your own risk. This chart has been created for my own improvement in Trading and Investment Analysis. Please do your own analysis before any investments.
