90% chance we go sub 0.70 areaHello all,
Fibs never lies, so for the emotional gna gna gna reaction... Take the time to read this.
I've shared this lately and more I look at it, more it makes sense. I was bullish like everybody else before this massive wick appeared on the chart. This has reset my bullish view short terms.
This analysis is crystal clear. We have been missing one retracement to 0.70 level.
If I'm wrong this last wick was hell of a scam one, yet I intend to believe it shows the direction price will take the coming weeks.
We may have a great opportunity ahead to buy at discount and shoot back up to where we should have been without the SEC in our way.
I'm still bullish. 9 dollars is my conservative target. 40 dollars my Top coz like you I'm addicted to Hopium.
Take care all.
Trade ideas

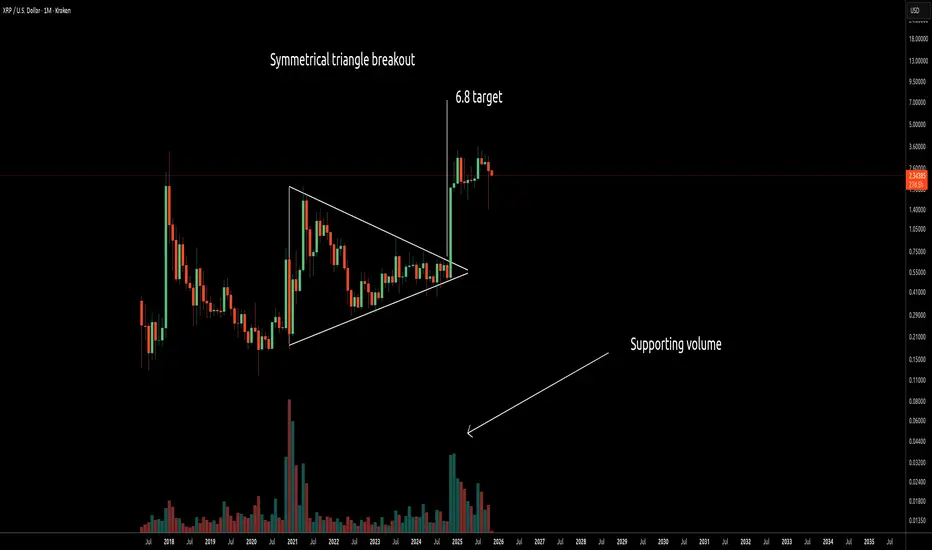
XRP Symmetrical Triangle Breakout Targeting 6.8XRP looks like it just broke out of a Symmetrical Triangle with supporting volume and is eyeing a move to the $6.8 zone.
XRP is unique. It's one of those coins that just does its own thing.
XRP will sit there doing absolutely nothing while the rest of the market pumps, then randomly decide to move when you've completely forgotten about it.
Definitely not for weak hands as XRP will frustrate the hell out of you.
However, if you can wait it out, XRP delivers solid rewards.
The long-term game plan should be:
a) Buy
b) Hold
c) Forget about it
d) Check back in 6 months
For patient hands only. Set it and forget it and your future self will thank you.
XRP will Rise!XRP at a SUPPORT zone. Got some confirmation for it bouncing back. Waiting for Trend Reversal confirmations. Before the end of the year there could be a great spike for the major cryptocurrencies.

XRP Monthly ChartClosed October as a bearish candle with a wick all the way to $1.50.
See how the years ends at this point, first 1/3 of the last quarter is already bearish.


XRP/USD – Holding Support but Trend Still Down🟠 Bias: Neutral → Slightly Bearish
Price: $2.21
Below SMA200 ($2.63). RSI ~40 → stabilizing, but momentum still weak.
Key Levels
Resistance: $2.30 / $2.45
Support: $2.07 → $2.00
Read:
Unlike ADA, XRP is at least stabilizing. The $2.07–$2.00 zone is real support from prior reactions. Unless it closes above $2.30, this remains a bounce-only environment.

XRP | Strong buy - Let it rip Strategy: Impulse Correction
Direction: Bullish
Moving Average: Blue above Red
Fib Retracement: 38.2 reached
MACD > 0
Support: Should the weekly close above the green support level, we could see XRP moving higher in the coming weeks. As it stands it has bounced of the moving average which acts as confluence.
Entry: 3.04
SL: 2.84
Lots: 0.1 (Plan to pyramid into this one)
1st Target = 3.66
2nd Target = 4.12
3rd Target = 4.71
Trade 6/20
#Trading #Technicals #MovingAverages #FibRetracements #Crypto #XRP

XRP: Accumulation Zone Supports Short-Term UpsideFenzoFx—XRP (Ripple) is under selling pressure, down 0.50% today, trading near $2.309. The daily chart shows accumulation, suggesting sideways momentum may continue. Open interest supports this phase, with strong support between $2.072 and $2.223.
XRP could rise slightly, potentially revisiting $2.456. If resistance at $2.456 holds, a bearish wave may follow, targeting $2.072. Continued selling pressure could push the price toward the liquidity void at $1.922.

Xrp/Usd - Approaching Resistance; Possible Trendline Break AheadPrice is currently trading around 2.33, testing a key resistance zone (highlighted in green). The pair has been respecting a short-term ascending trendline support, but momentum is weakening as price approaches the resistance area.
A potential bearish setup could form if price fails to break and close above this resistance level. A confirmed break below the trendline support may trigger a correction toward the 2.26–2.24 target zone, aligning with previous structure support.
Key levels:
Resistance: 2.33–2.34
Support (target zone): 2.26–2.24
Trend bias: Bearish rejection from resistance
Trading idea: Watch for rejection signals or a clean break below trendline support for a possible short setup toward the 2.24 area. A strong breakout above 2.34 would invalidate the bearish view.

XRP/USD (4H) Analysis: The $2.10 Launchpad🚀 XRP/USD (4H) Analysis: The $2.10 Launchpad 🌊
Current Market Context
The XRP/USD 4-hour chart provides a clear picture of a major bearish reversal from its recent highs. Price action suggests a classic Head and Shoulders (H&S) pattern has likely completed, marked by a decisive break below its neckline (the lows between the peaks), leading to a sharp drop.
The crucial development is the recent price bounce off the $2.10 (Green Zone) support area. This zone has acted as a strong demand area, suggesting that the initial, aggressive correction phase triggered by the H&S pattern may be concluding. Bulls are now attempting to build a local base.
Key Levels to Watch
⚡️ Immediate Resistance (The First Hurdle): $2.20
This is the immediate hurdle. A clean break and hold above $2.20 are necessary to confirm short-term bullish momentum and set the stage for a push to the next major resistance.
🎯 Key Resistance Area (Flip Zone): $2.30 (Grey Zone)
This is the most critical resistance in the short term. The $2.30 area was previously a strong support and will now be tested as a major psychological and technical resistance. Breaking and turning this zone into support would significantly shift the short-term market structure from bearish to neutral/bullish.
🛡️ Major Support (Must Hold): $2.10 (Green Zone)
This is the line in the sand for the bulls. A sustained break and candle closure below $2.10 on the 4H chart would confirm continued downside, with the H&S target being the next point of interest, leading to a much deeper correction.
Potential Scenarios
Bullish Scenario (Bounce and Break):
XRP successfully holds the $2.10 support.
The price breaks through $2.20 and then reclaims the $2.30 (Grey Zone).
A confirmed flip of $2.30 opens the door for a rally toward the higher resistance zones at $2.50 (Blue Zone) and ultimately $2.70 (Red Zone).
Bearish Scenario (Rejection and Retest):
XRP fails to hold the recent bounce and is rejected at $2.20 or $2.30.
Price falls back to retest the $2.10 (Green Zone) support.
A sustained break below $2.10 would invalidate the current base-building effort, suggesting the H&S downside target is still in play, leading to further significant
losses.

XRP Eyes $2.072 if Support BreaksFenzoFx—XRP is down 3.30% today, trading around $2.2330. Immediate support lies at $2.2230, backed by the anchored VWAP. So far, the price hasn’t closed below this level on the daily chart.
Technically, a close beneath VWAP could trigger further downside toward $2.072. If selling pressure continues, the next support is $1.922. The market outlook remains bearish while XRP trades below the descending trendline.

XRPUSD correction completedinitially thought that more upwards correction was false. i thought this was and impulse (Grey box) but it turns out its and abc, hence the impulse moving down

XRPThe line in the sand held once again..
now let’s see how the recovery will look like for this week

XRP Price Under Pressure as Sellers Stay ActiveCOINBASE:XRPUSD price has dropped nearly 3% in the past 24 hours, extending its 30-day losses to 19%. On the daily chart, the token trades inside a clear downtrend channel, showing sellers still in control.
Between October 13 and November 2, COINBASE:XRPUSD made a lower high while RSI formed a higher high — a hidden bearish divergence that signals the continuation of the ongoing decline. Unless COINBASE:XRPUSD reclaims $2.64, the bearish setup remains valid.
The key level to watch is $2.31, a major support zone; losing it could trigger a move toward $2.18. On-chain data backs this weakness — NUPL at 0.428 shows traders still in profit, and short-term holders have cut over half their positions in two weeks, confirming continued selling pressure.

SHORT | XRPUSDCOINBASE:XRPUSD
XRPUSD Daily – Bearish Continuation in Play
Trend Structure
Market printed a Higher High near 3.66 but failed to sustain momentum.
Recent price action has shifted into a sequence of Lower Highs, confirming bearish control.
Current structure shows LH → LL pressure, with momentum pointing lower.
EMA Context
Price is already below the 9 EMA, confirming short-term weakness.
The 35 EMA has failed to hold as support.
The 100 EMA aligns with demand and marks a critical inflection point.
Fib + Key Levels
38.2% retracement at 2.995 has been broken — bearish confirmation.
50% retracement at 2.788 is the near-term magnet.
61.8% retracement at 2.580 is a strong support cluster with EMA + demand zone.
Targets
TP1: 2.247 (aligns with 78% retracement + demand)
TP2: 1.909 (major liquidity zone and deeper correction target)
Invalidation
A daily close above 3.25–3.30 would weaken the bearish thesis and shift focus back to range consolidation.
Bias
Short-term to mid-term bearish. Expecting continuation toward 2.78 → 2.58 first, with potential extension into 2.24 and 1.90 if supports fail.

XRP/USD – Capped Under Resistance🔴 Bias: Neutral-Bearish
Price at $2.53, sitting just below SMA200 ($2.62). RSI 47, losing short-term drive.
Upside pivot: need a strong close > $2.65 to regain upside control (target $2.90).
Downside trigger: fail under $2.50 → possible slide to $2.30–$2.10.

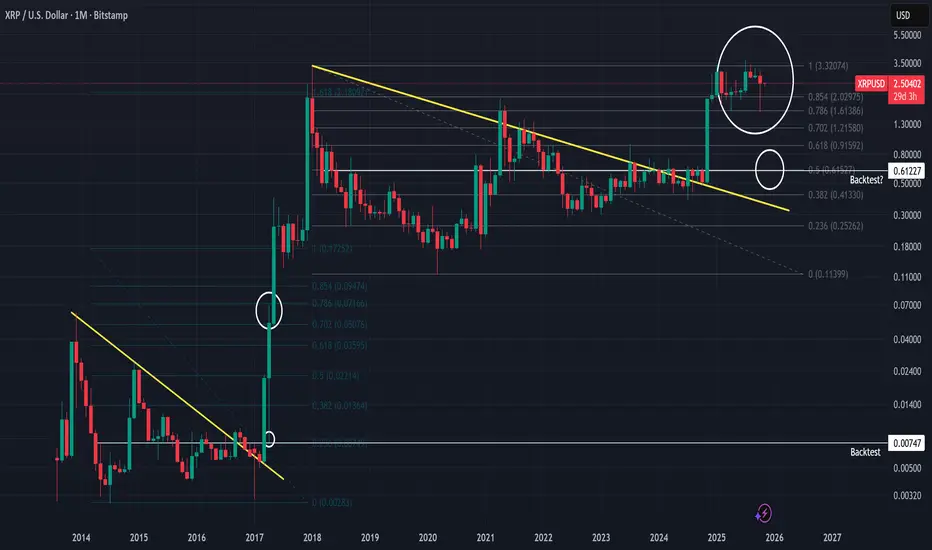
$0.61 Flash Crash / backtest missingIn 2017, after the breaking the ATH, XRP had a severe backtest before altcoin season.
2025, IMO, the ABC correction has NOT completed and a SEVERE backtest potentially down to $0.61 for a flash crash, then altcoin maina.
Blockchainbacker on youtube probably knows this pulled 50% and ready to buy the dip.
$1.21.... 0.702fib retestdont hate, but xrp didnt break out of the flag pole yet and potentially building a C leg down to $1.21 to retest the 0.702fib.
$1.21 being a wick grab if youre an xrp crackhead buying at 3am.
BUT, if xrp does breakout of the flag pole, buy the C leg on the backtest of the top of the pole.

XRP market snapshotVolume is extremely low - poor thing looks exhausted. The same short set up as Bitcoin on the monthly TF, clear price/volume, price/MACD histogram divergence, which for me adds another point in favor of shorts.
There’s a major support level around $2.
Locally, the price is holding below 50/200 MAs on the Daily TF, which technically indicates a trend reversal.
Price has entered in accumulation pattern in the form of triangle - a breakout below $2.4 would most likely send it toward the candle’s tail area and the privious local downtrend

Breakout ScenarioXRP ist moving in a triangle formation and might have completed the bottom formation of the wave 2 at the 78,6 Fib level
Breakout could be possible in a wave 3 to 1,618 fib or 2,618 fib levels in a impulsive wave 3
Wave 4 and 5 already marked but depends of coure of and if wave 3 is happening.

watch 2.5-2.55 resistance potential to form head an shoulder on option 1 ,if it breaks 2.55 we are save

XRP — Targeting Liquidity Grab at $2.50XRP just tapped into the $2.65–$2.70 supply zone and is showing rejection wicks off the top. Clean liquidity pocket sitting around $2.50, lined up with prior structure and the mid-demand zone.
I’m expecting a pullback into that level before any continuation. That’s where late longs get cleared and smart money reloads.

Tick... Tock... $XRP When a resistance level is tested more than three times and the price continues to accumulate above a major support, that resistance is destined to break, sooner or later.
Each test weakens the sellers’ defense. Supply gets absorbed, liquidity thins out, and the market builds pressure.
Meanwhile, steady accumulation above strong support shows that buyers are quietly taking control, energy is being stored for an explosive move.
Eventually, the chart reaches a tipping point:
What once held the price down becomes the launchpad.
The breakout is no longer a question of if, but when.
