Ripple (XRP): Getting Ready To Sell This One!XRP is not really a surprise here. We were never big believers in XRP, even though it had a strong push about a year ago. Since then, price has mostly been moving sideways, and now we are starting to see clearer signs of a sell-off building up.
EMAs are shifting and slowly pointing the trend lower, which tells us buyers are losing control. In our personal opinion, XRP actually deserves a deeper correction compared to many other coins that already flushed harder.
What we are watching now is the local support zone. If sellers manage to take control below this area, we would expect XRP to transition into a proper downtrend from here. That move would open the door for continuation lower rather than another sideways phase.
Swallow Academy
Market insights

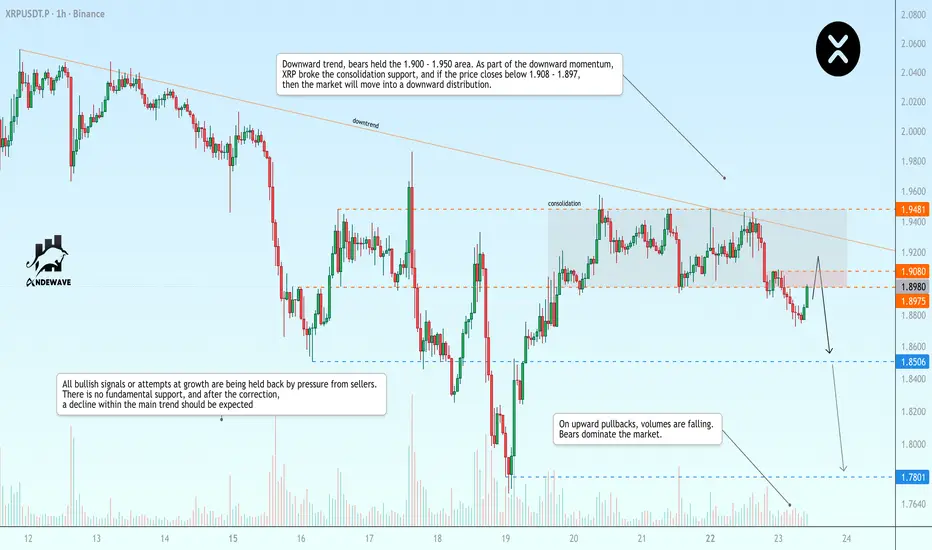
XRPUSDT may resume its decline after a pullback Downward trend, bears held the 1.900 - 1.950 area. As part of the downward momentum, XRP broke through the consolidation support, and if the price closes below 1.908 - 1.897, the market will move into a downward distribution.
On upward pullbacks, volumes are falling. Bears dominate the market. All bullish signals or attempts at growth are held back by pressure from sellers. There is no fundamental support, and after the correction, a decline within the main trend should be expected.
Scenario: a false breakout of the specified resistance and prices remaining below these levels may provide an opportunity to go short...
SOL & XRP - Decision Time at Weekly Structure!⚔️Both SOL and XRP are now sitting at a major weekly support zone , clearly marked in blue. This is not just a random level, it’s a key structural area that has defined direction in the past.
From here, the market is at a crossroads: 🔁
📉If this weekly support breaks , it would signal a loss of structure, opening the door for further long-term bearish continuation toward the green demand zone below.
📈On the other hand, for bulls to regain control, price must prove strength. That confirmation comes only with a break above the last major daily high, marked in red. Without that, any bounce remains corrective, not a trend reversal.
In short:
Structure is being tested.
Reaction matters more than prediction.
Do you think this support holds, or are we heading deeper into demand? 📊
⚠️ Disclaimer: This is not financial advice. Always do your own research and manage risk properly.
📚 Stick to your trading plan regarding entries, risk, and management.
Good luck! 🍀
All Strategies Are Good; If Managed Properly!
~Richard Nasr

XRPUSDTOn 4h TF - price went to liquidity run (x) and we can see a possible MSS as price went up and breakout to the recent swing high. Bias is bullish just until the swing high of the parabola.

Xrp ShortIf the 1h candle is closing below the range I expect the price to drop
Price keeped in the chanel and keep rejected the 1.94-1.95 zone, from here I expect the price to drop 1.8050-1.8000 zone and if the down trend continues I expect to go to the 1.7000 range zone

XRP - Bullish wedge pattern XRP is continuing to compress within a lovely wedge pattern. There is a high probability of a breakout to the upside with a target of $2.75 giving around 50% increase in price. I will continue to monitor this and buy the breakout

XRP – Daily OutlookXRP Army,
Price is still trading inside a descending channel, keeping the short-term structure bearish.
We recently saw a reaction from daily support, but this move alone is not enough to confirm a reversal.
In the past, this support level has shown clean deviations, where price dipped below and quickly reclaimed the level.
A similar scenario could play out again, but confirmation is required.
Key observation:
For any bullish continuation, XRP needs to reclaim the broken support level and hold above it.
Without a reclaim, this move remains a relief bounce within a downtrend.
I’ll be watching lower timeframes for a potential deviation and reclaim before considering longs.
Until then, caution is warranted.
Levels to watch:
Resistance: reclaimed support + upper channel
Support: current daily support zone
MrC

XRP Weekly Setup – Breakout After Triple Bottom?
#XRP is rebounding from strong support at $1.6963, forming a triple bottom pattern.
A breakout from the downtrend channel signals a possible bullish reversal.
🟢 Entry Zone: $1.69
🎯 Target: $3.79

XRP/USDT – H4 Analysis....XRP/USDT – H4 Analysis (Based on my chart)
Market Structure
Price has broken the descending trendline.
Strong support zone held near the bottom (yellow demand area).
Price is now above the trendline and pushing into the Ichimoku cloud → bullish reversal confirmed.
📈 Buy Scenario
Buy Zone: 1.85 – 1.90
🎯 Target Points
Target 1: 2.10
Target 2: 2.50
❌ Invalidation
A strong H4 close below 1.80 will invalidate this bullish setup.
📌 Summary
Bias: BUY
Trend: Bearish → Bullish reversal
Expectation: Price to continue upward toward 2.10 first, then 2.50 (as marked on my chart)

Xrp? Plans... Hi
What's your plan?
I'm currently a buyer.
1st needs to break 1.86_855
Which was yest flat area. Highs
If trade above. I'm in
If not. I think it's not ready.. Still in holiday mood.
POV.
Few days more for a good / bad year closing.
WITH mega funds in mind, they would not want to see positions in negative.
Collectively, they would push to the extreme, 2.00 minimum or 3.20.
These are POV. If 1.90 is too hard. Don't expect anything.
www.tradingview.com
Low liquidity sellers, would be nice ambush.
All the best
Not a guru

XRP USDT SHORT SIGNAL📢 Official Trade Signal – XRP/USDT
📉 Position Type: SHORT
💰 Entry Price: 1.9330 (Limit Order)
🎯 Take-Profit Targets (Partial Exits)
• TP1: 1.9011
• TP2: 1.8742
• TP3: 1.8532
• TP4: 1.8245
• TP5: —
• TP6: —
🛑 Stop-Loss: 1.9615
📊 Timeframe: 15m
⚖️ Risk/Reward Ratio: —
💥 Suggested Leverage: 5× – 10×
🧠 Technical Analysis Summary
XRP is facing strong rejection from a short-term supply zone around 1.95 – 1.97, with bearish structure forming on the 15-minute timeframe.
Lower highs and increasing selling pressure indicate potential continuation to the downside.
Key downside liquidity targets align with our TP levels:
1.9011 → 1.8742 → 1.8532 → 1.8245
A clean break below TP1 (1.9011) will likely accelerate bearish momentum toward deeper support zones.
⚙️ Trade Management Rules
✔ Take partial profit at TP1
✔ Move Stop-Loss to Break-Even after TP1 is hit
✔ Trail SL as price reaches lower targets
✔ No re-entry if SL is hit
✔ Confirm bearish structure before entry
⚠️ Risk Management Is Mandatory

Xrp? Continue
Hi
My second entry activated.
Smaller with SL at X no2
Why?
I'm hoping it breaks the resistance of 2 days.
If this is my 1st entry. X2 will be SL.
X2 not touch. Will have a good up2 and away for NY closing 2025
All the best
Not a guru

Ripple road map (6h) !After the drop, the price can slightly bounce back up if buyers support it and we have a price correction. If the red trendline is broken, the price can move to the ranges we have specified.

xrp/usdt xrp recent price is 1.8625 so as planned price has dropped to 1.8581. we are seeing price hovering over that price, first price to be looking for is 1.8854, if broken we should be seeing 1.9210 .

Going short on XRPUSDThe price is at a strong support level, and I believe the price will continue to the downside because the trend is down and the present bullish move is a retracement on the Daily time frame. I believe that by the end of this week, the price will reach a new low.

XRP Breakdown Loading...Are You on the Right Side of the Market?Yello Paradisers, are you prepared for what could be a brutal XRPUSDT reversal? If you missed the latest fake breakout above $1.96, this might be your last chance to position smartly before the market punishes the late entries.
💎After multiple rejections, XRPUSDT is once again trading within a heavily manipulated resistance zone. Price action shows clear signs of exhaustion after sweeping liquidity above the previous highs. The inducement move was textbook, dragging in breakout traders just before reversing hard. This kind of move typically signals smart money is offloading positions while retail gets trapped.
💎We’ve already seen multiple internal structure shifts, including an internal Change of Character (I-ChoCH) and Break of Structure (I-BOS). These are strong bearish signals on the lower timeframes, especially when combined with a Fair Value Gap (FVG) rejection at the golden pocket between the 0.5 and 0.618 Fibonacci retracement levels. Unless XRP can close a strong candle above the $1.96 resistance, this move looks more like distribution than continuation.
💎From here, the first downside target sits at the $1.8262 support level. However, if that zone fails to hold, we’re eyeing a deeper move towards the major support around $1.7450–1.7500. That’s also where a large pool of liquidity sits, marked on our chart as "$$$" making it a likely magnet for price. This zone could serve as the next point of interest for accumulation, but only if approached with patience and precision.
💎Right now, emotions are your biggest enemy. Don’t get tempted by hype or fear of missing out. Stick to your levels, respect invalidation, and let the market come to you.
🎖But it never is, and never will be a free ride. Make sure you play it smart, Paradisers; The next 6–9 months will be juicy for some and painful for others. Discipline, patience, robust strategies, and trading tactics are the only ways you can make it long-term in this market.
MyCryptoParadise
iFeel the success🌴

xrp?usdtrecent price is 1.8571 we are looking for price drive down to 1.8519 from there see price go back up to 1.9213

Xrp? Wcha gonna do..
Hi
Merry ma's for those celebrating
My 2c POV
Few weeks it had rejected 1.85-86 about.. But never wanna fly.
SINCE
It's not moving south. YET.. (pressume/ assumption)
We are not going to see it 1.83/82- which I will place stop loss gracefully.
- since rejections
And make 2.60 and 2.80 as landing side.
All the best
Not a guru.
Wishing you best of times with family and friends.
May you have glorious celebration.
We are here to embrace each other, thou we are different. Remember to give, coz nothing is forever here.

DeGRAM | XRPUSD will correct from the $2 level📊 Technical Analysis
● XRP/USD remains in a well-defined descending channel after the post-crash structure, with multiple rejections from the falling resistance line confirming sustained bearish control. Recent rallies failed near the upper channel boundary, forming lower highs.
● Price action shows weak rebounds from the support line, followed by renewed selling pressure. The inability to reclaim the 2.00–2.05 area keeps downside risk active, with continuation toward the lower channel zone around 1.75–1.80.
💡 Fundamental Analysis
● XRP sentiment remains pressured by the lack of strong positive catalysts and ongoing regulatory uncertainty, while broader risk-off conditions limit speculative demand.
✨ Summary
● Bearish trend intact. Key resistance: 2.00–2.05. Targets: 1.80 then 1.75. Invalidation above the descending resistance line.
-------------------
Share your opinion in the comments and support the idea with a like. Thanks for your support!

XRP/USDT – Critical Decision Zone After Major Breakout!XRP/USDT on the Weekly (1W) timeframe shows a major shift in market structure. After a long accumulation phase throughout 2022–2024, price experienced a strong impulsive breakout in early 2025, signaling a transition from sideways conditions into a bullish market structure. Currently, price is in a retracement and re-accumulation phase, which will determine the next major direction.
---
Pattern & Price Structure
1. Long-Term Accumulation Range
XRP traded sideways for an extended period below the 1.00 USDT area.
This range acted as a strong accumulation base.
2. Bullish Breakout (Impulse Move)
Price broke above the major resistance around 0.90–1.00 with strong weekly candles, confirming valid breakout momentum.
3. Pullback / Re-Accumulation Phase
Current price action represents a healthy correction after the rally.
As long as key support holds, the structure remains higher high and higher low.
---
Key Levels
Major Resistance
3.60 – 3.80 USDT → Previous high / weekly supply zone
Key Support
1.90 USDT → Critical horizontal support & decision level
1.55 – 1.60 USDT → Strong demand zone
1.30 USDT → Last major bullish defense
---
Bullish Scenario
Price holds above 1.90 USDT with a valid weekly close.
Bullish reactions such as strong weekly candles or long lower wicks appear.
Upside continuation targets:
Target 1: 2.50 USDT
Target 2: 3.00 USDT
Main target: 3.60 – 4.00 USDT
This scenario suggests trend continuation after re-accumulation.
---
Bearish Scenario
A confirmed weekly close below 1.90 USDT signals weakness.
Price may continue correction toward:
1.55 USDT (first support)
1.30 USDT (major demand zone)
As long as price stays above 1.30, the broader structure remains bullish corrective, not a trend reversal.
A breakdown below 1.30 would indicate macro trend deterioration.
---
Conclusion
XRP is currently trading at a critical weekly decision zone.
The 1.90 USDT level acts as the key pivot:
Holding above it favors bullish continuation toward new highs.
Losing it opens room for a deeper, but still healthy, correction.
From a macro perspective, XRP remains structurally bullish, with the current move best interpreted as a pullback after a major breakout, not distribution.
---
#XRP #XRPUSDT #CryptoAnalysis #WeeklyChart #AltcoinMarket #MarketStructure #SupportResistance #BullishContinuation

XRP/USDT Trade Update (TP1–TP3 Hit)📈 XRP/USDT Update
TP1 Hit ✅
TP2 Hit ✅
TP3 Hit ✅
Partial profits secured.
Risk managed step by step.
— mastercrypto2020
Follow for real-time trade updates.

XRP future plan Hyping all XRP mewnbois! We will se a bottom of .70-80 cents with potential long term goal between $4-4.50.

