XRP Whales’ $3.8 billion Accumulation May Drive Price To ATHBINANCE:XRPUSDT is currently trading at $3.18 , having faced a slight decline over the last four days. The altcoin remains 15.3% below its ATH of $3.66, which investors are targeting. The ongoing bullish sentiment, coupled with whale accumulation, keeps the price within range of a potential breakout.
If the whales’ efforts succeed, BINANCE:XRPUSDT price could rise to $3.41 . If the $3.41 level is flipped into support, XRP could continue its ascent toward its ATH of $3.66 . This scenario would signal a sustained bullish momentum, with strong backing from both large holders and retail investors. The support level at $3.41 would play a crucial role in sustaining XRP’s price growth.
However, if BINANCE:XRPUSDT faces bearish cues from the broader market or selling pressure from retail investors, the price could dip to $2.99 or even lower . This would invalidate the bullish thesis and raise concerns about the sustainability of the upward trend.
Market insights

[SeoVereign] RIPPLE BEARISH Outlook – August 10, 2025In this idea, I would like to present a bearish outlook on Ripple.
There are three main reasons on which this perspective is based.
First, an arbitrary wave X forms a 1.272 ratio with another arbitrary wave X.
Second, a 1.414 BUTTERFLY pattern has formed.
Third, if the consistently formed trendline is broken to the downside, I believe the likelihood of Ripple’s decline will increase.
Accordingly, the average take-profit target has been set around 3.145 USDT.
Thank you very much for reading, and as time goes by and the chart becomes clearer, I will continue to update this idea accordingly.
Thank you.

Pump Always Comes, After You’re Too Tired To HoldHave you ever felt the market is deliberately tiring you out?
The moment your hope runs out is when the real flight begins.
This analysis explains why market makers change the game exactly then.
Hello✌️
Spend 2 minutes ⏰ reading this educational material.
🎯 Analytical Insight on Ripple:
BINANCE:XRPUSDT is showing strong volume with a respected daily trendline and nearby support. If this zone holds, price could rally about 17% toward 3.70 USD. 📈💹
Now , let's dive into the educational section,
🎯 Big Picture of the Market Maker’s Game
The market is never just a single candle up or down. Its moves are filled with swings designed less for short term gains and more for managing your emotions. Market makers know that 70% of traders think alike. When they see some profit they fear losing it and when they face some loss their patience fades. That exact weakness is their golden opportunity.
This is not random and it is not luck. Behind every long range or sharp fluctuation lies a clear goal. Collecting liquidity and pushing the weakest hands out. Once most people are caught on the wrong side the market maker takes the biggest profit with the least effort.
⏳ Wearing Down Investors
The market maker is a master of time manipulation. They can hold price in a narrow range or dull sideways move where neither strong rallies nor deep drops happen. This slow bleed in excitement causes small traders to withdraw their money one by one.
Every day this continues hope fades and doubt grows. By the time most decide to exit the market is primed for a move they will not be part of.
📉 Stop Loss Hunting in Price Swings
Stop loss placement is vital for traders but to a market maker it is a treasure map. They know most stops are just below recent lows or above recent highs. With a few intentional pushes in price they trigger these stops and collect the liquidity.
This can happen multiple times in one trend each time pushing more traders out and clearing the way for the next move.
🎯 Targeting Leveraged Traders
High leverage traders are like low hanging fruit. Even a small move against their position can cause forced liquidations or margin calls. Market makers exploit this by moving price briefly against the crowd several times flushing them out.
This not only removes a large chunk of opposing positions but also makes it easier to drive the price strongly in the desired direction with minimal resistance.
💧 Building Liquidity
Liquidity is the fuel for major market moves. Without it a big push in price is costly and risky. To create it market makers need traders to buy or sell in large volumes. Stop hunts exhausting investors and shaking out leveraged players all feed this goal.
Once there is enough volume stacked on one side they flip the market hard taking the big profit while the majority has either exited or is trapped in the wrong direction.
📊 TradingView Tools to Spot the Market’s Mind Games
To see this game more clearly TradingView has tools that directly help you.
Volume Profile lets you identify price zones with the most traded volume which are prime hunting grounds.
Liquidity Zones Drawing helps you mark liquidity pockets to predict the next hunt.
Replay Tool lets you rewind past trends and find moments where stop losses were targeted.
Relative Strength Index (RSI) shows that multiple touches in overbought or oversold with sideways price often means a hunter is at work.
Alerts Customization allows you to get notified when price nears key liquidity zones.
Practical use. Open the BTCUSDT chart run a Volume Profile to find high volume areas mark liquidity zones then use Replay Tool to see how often the market hit those zones before a major move. This drill trains your eye to avoid becoming prey.
Summary
The market never moves in a straight painless path. Every swing trap or sideways grind has a purpose. If you understand these moves as part of the market maker’s plan to gather liquidity you can position yourself where others give up and join the move when it truly starts. Patience and pattern recognition are your sharpest weapons.
✨ Need a little love!
We pour love into every post your support keeps us inspired! 💛 Don’t be shy, we’d love to hear from you on comments. Big thanks, Mad Whale 🐋
📜Please make sure to do your own research before investing, and review the disclaimer provided at the end of each post.

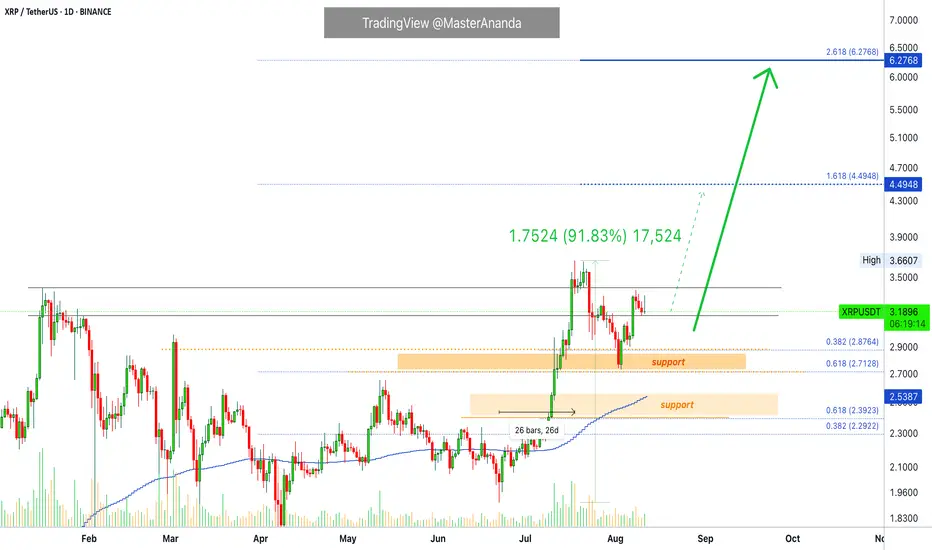
XRP Update · Nothing Changes But One Thing...Market conditions continue to improve and all is great but one thing...
XRPUSDT is trading in the bullish zone but below its January 2025 peak price, this can have some implications. If XRP were to stay below this resistance, it can take a while before the next target is reached.
The last advance was a good one. XRP grew 92% in 26 days, including all-time high and everything. The market is good, the market is strong and the market can continue to grow, but there is no hurry if the growth is set to be sustained long-term. If a rise is to be maintained, there needs to be stops along the way.
So moving below resistance for a few days can lead to bullish momentum drying up. Once dried, the bears can take the upper-hand and push prices lower. Lower but still higher as in our classic higher lows.
Retraces, sideways, reversal, consolidation, accumulation. Bullish wave.
The market has room to wiggle around. Patience is key.
If a move back above $3.40 doesn't happen soon, prepare to wait.
Regardless of the length of the waiting period, possibly with a downward bent, XRP will continue to grow. If prices move lower this is an opportunity to buy-in or rebuy.
Namaste.
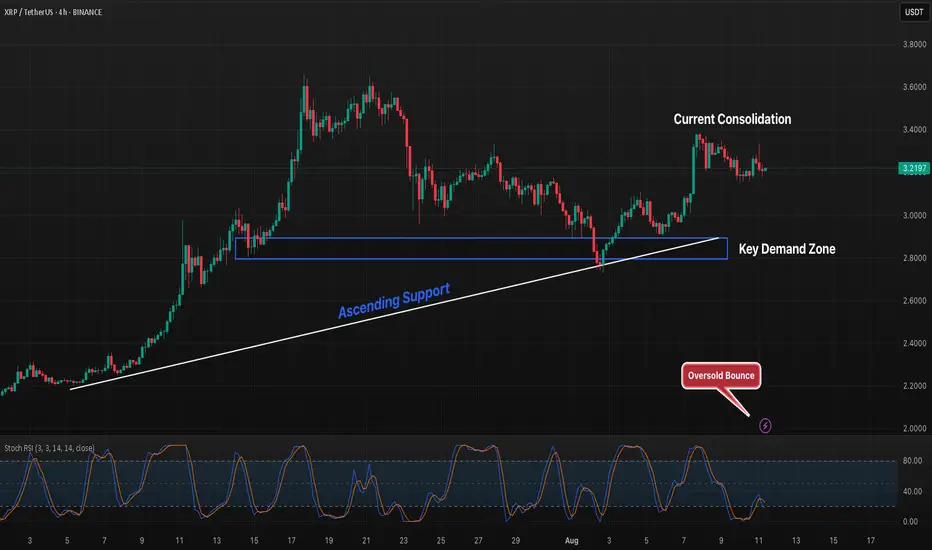
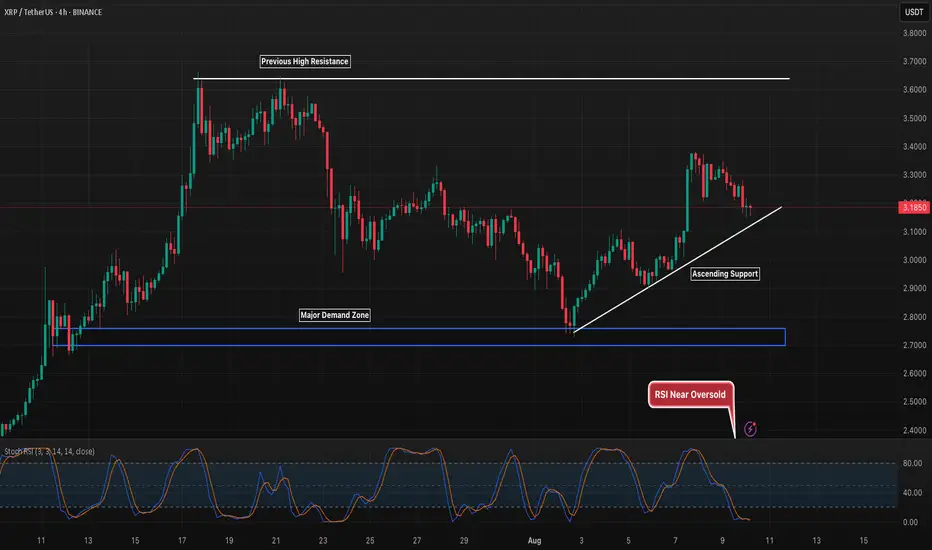
XRP 4H Holding Above Support, Can Bulls Break Consolidation?XRP is holding above a key ascending support line and the $2.85 demand zone after rebounding from oversold Stoch RSI conditions. Price is currently consolidating near $3.18, with a breakout above recent highs potentially signaling continuation toward $3.40–3.60. Failure to hold support could see a retest of the $2.85–3.00 demand area, which remains critical for the bullish structure.
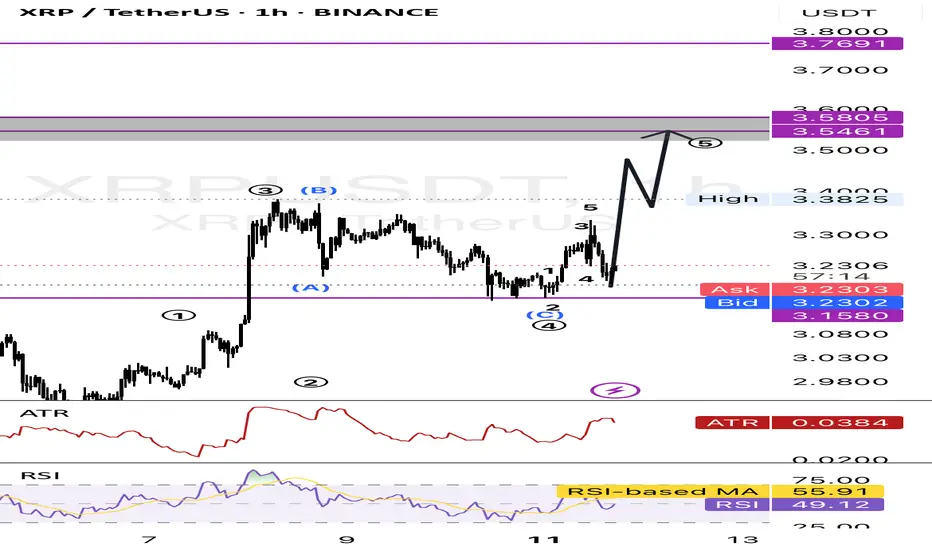
XRP:Elliot Wave Analysis Hello friends, you can see the Ripple chart, which is analyzed on the basis of Elliott waves. The first and second waves have completed, so we are waiting for the Sharpe movement for the third to fifth waves, and the number will be 3.54 to 3.84. Be profitable and successful.
Still bullishMy overall bias for XRP is still bullish.
I have one major Fibonacci line in the daily chart that I have been using to analyse the price action.
The Fib line is drawn from Jan 25 high at $3.40 to April 25 low at $1.58.
XRP has been spending most of the last 18 months oscillating in this range.
In mid July 2025, the price finally broke above the range but it was short lived and started to retrace.
The price found a strong support at $2.73 where Fib 0.618. It is also a 50% retracement area from the recent high to recent low.
All momentum indicators are in the bull zone and plenty of scope to keep moving to the upside.
Causions:
Daily MACD lines haven't crossed to the upside.
The price has hit the major resistance line and is rolling to the downside in the lower time frame. It has failed to break above it.
All the bullish signals are there. However, it is such a major historical resistance area: it might consolidate and perhaps retrace to fill the fair value gap first before it starts to make a major move to the upside. (see 4H chart)

xrpxrp usdt daily analyses
time frame daily
look at the chart
xrp is moving up and down slowly. when all of assets fall down in two week before , ripple was excepted
so I think if xrp break the red box (strong resistance) it can move to moon and my first target is 4.86$

Ripple (XRP)Xrp usdt Daily analysis
Time frame daily
Risk rewards ratio >1.5
Short position ↘️↘️
Bad news for Ripple investors
Head and shoulders pattern is created
So I think , maybe xrp fall down to 1.7$

Xrp (Ripple)Ripple
Xrp usdt Daily analysis
Time frame daily
Risk rewards ratio >3.2 👈👌
Target 3.2$
Ripple technical analysis ✅️
My last short position reached the target.
Head and shoulders pattern completed.
Now it is a good time to start
My critical area is red box that you see on the chart. It is very important area .
If Ripple can reach and break this resistance, we will have a good pump
But now 3 _3.2$ is a good target

Lingrid | XRPUSDT Potential Upside Move From Support ZoneThe price perfectly fulfilled my previous idea . BINANCE:XRPUSDT is rebounding after a breakout from the consolidation zone and testing support around 2.897. The price is forming a bullish structure within a downward channel, aiming to reclaim the mid-level resistance. As long as it remains above 2.897, the bullish wave has room to target the descending channel’s upper boundary near 3.230. Momentum is gradually shifting toward upside continuation following the recent breakout and rebound.
📉 Key Levels
Buy trigger: Break and hold above 2.960
Buy zone: 2.850–2.960
Target: 3.230
Invalidation: Drop below 2.740
💡 Risks
Failure to hold 2.870 could invalidate the rebound
Overall channel remains bearish, posing structural resistance
Broader market sentiment may weigh on breakout momentum
If this idea resonates with you or you have your own opinion, traders, hit the comments. I’m excited to read your thoughts!

XRP 4H Testing Ascending Support After Strong RallyXRP is pulling back into ascending support after a sharp rally from the $2.70 demand zone. The structure remains bullish above this trendline, with the next key resistance at the previous high near $3.65. A breakdown here could send price back toward the major demand zone, while holding support could set up another push toward highs.
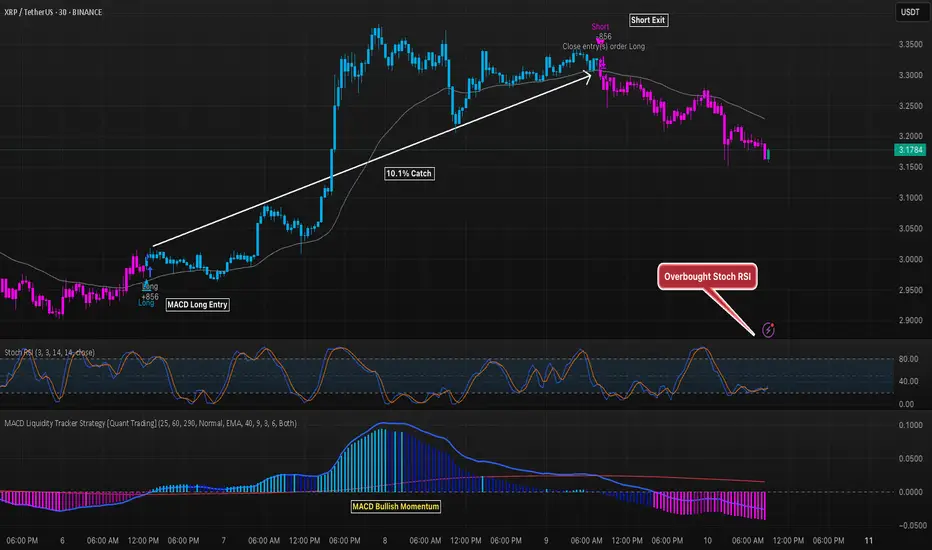
XRP 30M Strategy Trade Nets 10.1% GainThe MACD Liquidity Tracker Strategy caught a strong 10.1% move on XRP’s 30-minute chart, entering on bullish momentum and closing near the peak. The rally aligned with overbought Stoch RSI conditions, signaling potential exhaustion before price turned lower. Post-exit, momentum flipped bearish, confirming a timely close.
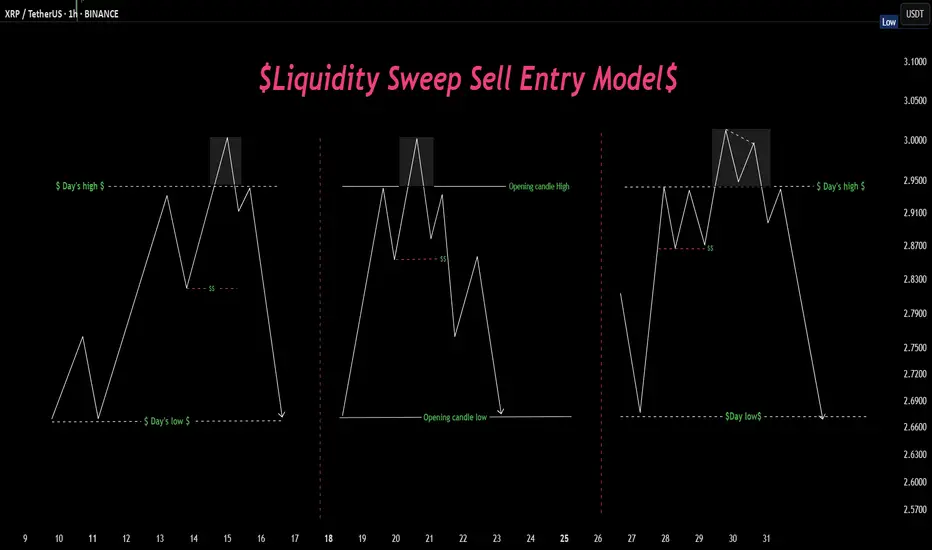
Sweep, trap, send. Textbook manipulation move Liquidity hunts in action 🏹 — Three variations of price sweeping key highs before a major move down. Spot the trap, ride the reversal. 📉💧
1:2.5 RR LONG XRPSame bias as my other trades... larger SL targeting recent highs
Bitcoin has had a pump would love to see alts follow suit tonight
This is more swing/intra day trade which works better for me where I can set and forget
Lets see what happens....
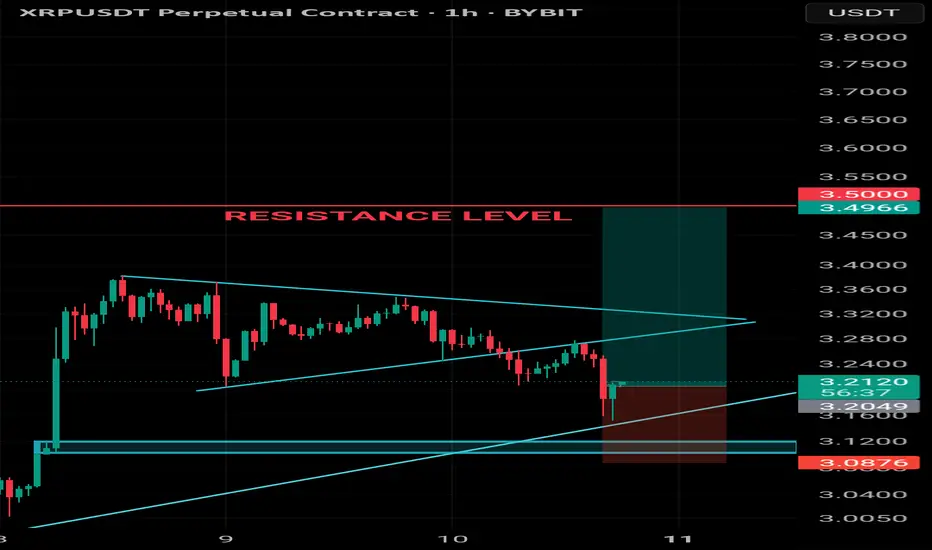
The Great XRP Escape Plan: Thief Strategy Deployed🌀 XRP/USDT – Thief Trader’s Master Heist Plan: Crack the Vault Before They Catch On! 🧠💰
🔐💸 Operation Code: Ripple Raid 3.9 - Eyes on the Prize, Hands on the Trigger 💥
🌍 Attention Global Market Robbers and Strategic Money Movers!
This ain't just another analysis—this is the Thief Trading Style Blueprint, surgically designed for the XRP/USDT Crypto Market. Whether you're a silent sniper or full-squad raider, this trade setup is your next high-voltage money heist.
🔍 Market Breakdown:
📊 Technical + Fundamental = Robbery Precision
Currently, Ripple (XRP) is showing bullish fuel—charging into our trap-the-bears zone. Volatility is tightening, resistance is trembling, and it smells like liquidity is about to get stolen.
⚠️ Warning: The market’s at a risky cross-zone – overbought with heavy consolidation – where big bears and trapped traders usually play defense. That’s exactly where we strike.
🔓 Entry Gameplan – “Wait, Trigger, Execute”
📈 Entry:
"The heist begins when the candle breaks the high and screams confirmation!"
Set Buy Stop Orders above the recent resistance (around 3.1000).
Alternatively, use Buy Limit Orders on pullbacks at key swing levels (15M or 30M timeframes).
We use a multi-layered entry strategy (aka DCA + stacking like a pro thief stacking vaults). Be surgical. Be patient.
📌 Pro Tip: Always set a chart alert at the trigger zone to avoid missing the breakout party.
🛑 Stop Loss – “Breakout First, Then Talk Safety”
🚫 NO SL BEFORE BREAKOUT. Period.
Once price breaks out, then:
🔐 SL = Nearest 4H candle wick swing low (around 2.8000).
But remember, your SL = your risk appetite.
Whether you're placing 1 big order or 10 mini traps, manage it smart.
🎯 Target – "Get Rich, Then Vanish"
🏴☠️ Primary Take Profit Zone:
Target: 3.9000
Or exit anytime you see signs of reversal.
Don't get greedy—get paid.
👀 Scalpers’ Note:
Only play the Long side.
If you're deep-pocketed, dive in straight. If not, ride with swing traders and trail your SL to protect profits.
🔥 Why This Trade is 🔐:
📈 Current price structure, liquidity zones, and momentum favor bulls.
📊 Correlated intermarket signals + on-chain activity + macro backdrop align with XRP strength.
🧠 Smart money accumulation is visible – this is your window before the big breakout.
🚨 News & Position Management Alert:
📢 Stay clear of opening trades during major news events.
Use Trailing Stop-Loss on running positions to lock gains while letting profits fly.
This is not hype. This is precision.
Thief Trader doesn’t guess – we plan, we trigger, we exit.
📌 Final Words:
Whether you're scalping seconds or swinging for days – follow the blueprint. XRP has a vault to crack, and we’re here to rob it clean.
Now go out there, set those traps, and let the market pay you like it owes you.
🧠💸🕶️ Next Heist Plan Coming Soon… Stay Sharp.

XRPUSDT - Time to be bearish!!Did you know that the XRP chart has turned bearish and is looking pretty grim?
A lot of indicators are pointing in that direction right now.
It recently formed a triangle pattern, broke out, rallied, and hit a new ATH — which coincided with the fifth and final wave of the Elliott Wave impulse.
Now it has shifted into an ABC corrective structure, and wave B seems to have completed, setting the stage for the main corrective move with wave C, which is expected to deliver around a 30% pullback from this point.
Another red flag for me is that XRP barely managed to break into a new ATH, only to quickly reverse and is now retesting the previous ATH, which lines up with the 1.00 Fibonacci level. Based on this, I strongly expect a major correction in XRP from here.
Sure, a lot of die-hard XRP believers won’t like this take — but let them ride it down. You can always buy back cheaper, my friend.
take a look to this post
As I told you earlier in a previous post, I recommended buying it at that time(3 months ago), which was the perfect entry. It has now risen by 50%, so I’m telling you to sell if you still hold it.
Best regards:
Ceciliones🎯

XRP: Bulls and Bears Fighting Over the Same Couch!XRP is trading into a key structural inflection point as we move into the weekend. Price is compressing between three high-value reference points: the neckline at 3.2496, the 50% Fibonacci retracement at 3.1560, and the Point of Control (POC) from the recent volume profile at 3.1322. This triad forms a high-probability reaction zone for the next directional leg.
From the swing low at 2.7405 to the recent high at 3.5716, the market advanced in a five-wave impulsive structure on lower timeframes. The subsequent retracement has been orderly, contained within a descending price channel, and has printed a series of lower highs, signalling controlled distribution rather than panic selling. The rejection from 3.57 aligns with a potential double top on the 4H and 1H charts.
The high-volume node at 3.1322 (POC) represents the highest traded volume area in the current range, marking it as a key battleground between buyers and sellers. Volume delta in recent sessions shows selling pressure increasing on rallies, suggesting offers are stacking above 3.25 while bids remain concentrated in the 3.15–3.13 zone. If the POC fails to hold on a retest, there is low-volume support until 3.05, after which the next notable node is at 2.88.
38.2% Fib: 3.2783 – acting as minor resistance intraday.
50% Fib: 3.1560 – aligning with the POC for a dual-layer support cluster.
61.8% Fib: 3.0349 – key retracement level, overlaps with previous structural pivot.
Bullish Scenario (40–45% probability)
If price holds above 3.15–3.13 and buyers step in on increased volume, the structure allows for rotation back toward the neckline at 3.2496. A reclaim and acceptance above this level could trigger a measured move toward 3.40, followed by 3.57 retest. Sustained momentum above 3.57 would target the 127.2% Fib extension at ~3.76.
Bearish Scenario (55–60% probability)
Failure to hold 3.15–3.13 would invalidate the local support cluster. A break of the POC with acceptance below it shifts control to sellers, opening targets at 3.05 (minor), 2.88 (major HVN from previous base), and potentially 2.74 (full 0% retracement of the prior rally). A breach of 2.74 would likely trigger deeper revaluation into the 2.55–2.50 liquidity pocket.
Macro & Fundamental Catalysts:
ETF Speculation: High-probability (95%) approval chatter could act as a volatility trigger in either direction if confirmed or denied over the weekend.
Regulatory Clarity: Ripple’s legal resolution removes an overhang, but also removes a “buy-the-rumour” driver, leaving market dependent on new catalysts.
Whale Movements: $175M in recent large-lot transfers indicate potential for distribution if market conditions weaken.
Correlation Risk: Bitcoin dominance and macro crypto flows will impact XRP’s ability to sustain directional moves.
For CFD and prop firm traders, the asymmetry of holding over the weekend must be factored in. Spot markets will continue to trade 24/7, but most CFD/prop platforms will remain closed until Sunday night. This creates exposure to potential weekend gaps that can breach stop levels or account drawdown limits before the market is accessible again.
Given the structural setup and confluence of levels, does this zone resolve as a bullish rejection or a clean breakdown into deeper support? Share your directional bias and target projections below I'd love to hear your take on it. Im by no means a "Crypto Guy" but this intrigues me.

Lingrid | XRPUSDT Potential Trend ContinuationThe price perfectly fulfilled my previous idea . BINANCE:XRPUSDT is holding above the 3.1500 support zone after a clean rebound from the ascending trendline, signaling a bullish continuation setup. The structure remains intact with higher lows, and the next major objective lies in the 3.8000 resistance zone. A breakout above 3.4000 could open the way for accelerated upside movement. Trend bias remains bullish while price holds above key support.
📉 Key Levels
Buy trigger: Break above 3.4000
Buy zone: 3.1000–3.2000
Target: 3.8000
Invalidation: Drop below 3.000
💡 Risks
A breakdown under 3.0000 could shift trend to bearish
Resistance near 3.8000 may cause sharp rejection
Broader market weakness could limit upside
If this idea resonates with you or you have your own opinion, traders, hit the comments. I’m excited to read your thoughts!

Is XRP doing it again?No need to complicate it, just look into it.
Will it reverse or what? Let's see.

XRP/USD LOOOOONGS🔀 Varied risks vs rewards
Break of downward trend ⤴️
🐃 Bullish overall bias
XRP army aren't stopping here 🌙
1️⃣ Tightest is - 1% (3.29) / 3% (3.69)
2️⃣ Mid - 1% (3.18) / 5% (4.18)
3️⃣ Large - 1.5% (3.10) / 6% (4.8)
Lets see how we goes!!

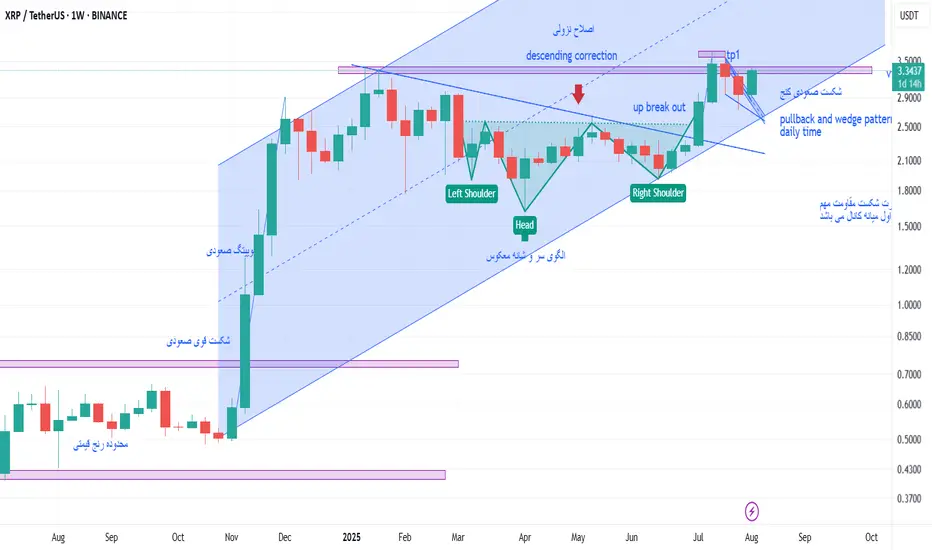
xrp weekly chartas we see total trend is ascending
tips :
1 after a midterm descending corretive trend it formed a head and soulder pattern which with macd positive divergence was a signal for the the end of correction
2 : by 7 july candle which is a strong ascending one the descending trend line was broken up and the buy signal was presented.
3 : when price reached to the vital static resistance made by candle 20 jan 2025 it stoped and formed a wedge pattern which is obvius on daily chart ,
4 : then we witness that the price broke up the wedge and now it is testing the static resistance level .
if it can break up that static resistance level I believe the first target price will be channel midline.
so we are waiting for closing weekly candle and starting new one , and for better decision we should control daily chart .
thank you
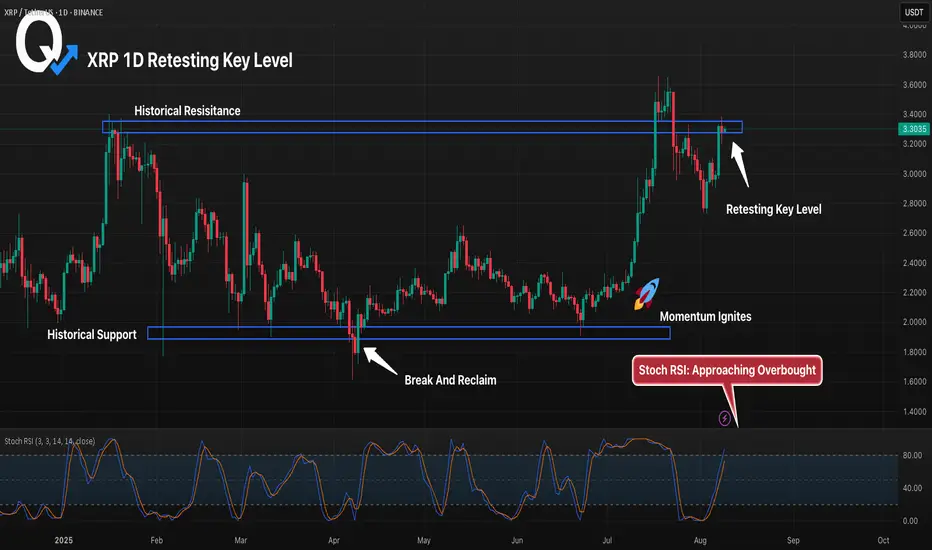
XRP 1D Retesting Key Level, Will Bulls Hold Above Historical ResXRP has broken and reclaimed a major historical support before rallying to retest the multi-year resistance near 3.30. Price is now pulling back into this zone, which will determine whether the breakout holds or fails. A successful retest could launch a push toward the July highs, while rejection here risks a drop back toward 3.07. Stoch RSI is nearing overbought, making this level even more critical for direction.