XRP DECIDES Rounding up the Bull run and getting ready to move with the bear on the best POI’s available, the trend lines will guide you
Market insights

XRP – Reversal Loading at the Demand Floor ?XRP is approaching a critical point within its descending channel, where price has tested the demand floor multiple times and continues to hold above the structural low marked with the red X. This area has acted as a major liquidity pocket, and the market is showing early signs of absorption rather than continuation to the downside.
The overall structure still respects the descending channel, but the reaction from the lower boundary suggests that sellers are weakening while buyers are gradually stepping in. This type of behaviour often precedes a mid-term trend reversal, especially when the market begins to form higher lows inside the same range.
A breakout above the internal trendline would shift momentum upward and open the door for a larger continuation move into the upper supply block. As long as price holds above the current structural low, the bullish scenario remains active.
Key Technical Notes:
• Strong demand response near the channel’s lower boundary
• Price defending the final structural low (red X)
• Potential bullish divergence forming as momentum begins to stabilise
• Break above the inner descending trendline can trigger acceleration
Simple Interpretation:
XRP is bouncing from major demand and trying to regain momentum. A breakout above the internal resistance trendline could confirm the start of a larger reversal wave.
Invalidation:
A clean breakdown below the red X level would invalidate the bullish scenario and open the way toward deeper support zones.

Ripple (XRP): Seeing Similar Setup To Form Near EMAs | BearishXRP is forming a similar setup to what we’ve seen on a few other charts — price keeps rejecting from the EMAs and struggling to gain any bullish momentum. As long as we stay under these levels, sellers keep control.
What we’re waiting for is a proper breakdown from this small consolidation. If that happens, the downside play becomes very clear. Until then, we stay patient and let the structure show us the direction.
Swallow Academy

XRP Update🚨📊 XRP Update
XRP is testing the red resistance zone right now 🔴.
If price manages to break out above this red level,
the first target will be the green line level 🟢 —
the next key zone on the chart.

LONG TRADE (XRPUSDT)ENTRY: 2.2260
STOP LOSS: 2.2100
TP1: 2.2480
TP2: 2.2620
RRR: ~1.4:1 (TP1), ~2.25:1 (TP2)
🔍 MULTI-TIMEFRAME ANALYSIS
1m:
Strong breakout candle after liquidity sweep near 2.2100
Structure shift confirmed by reclaim of micro supply → turned demand
Clean higher low + push through minor resistance confirms momentum
5m:
Recovery from lower low + breakout above local descending trendline
High momentum candle with volume suggests strength
Local resistance flipped near 2.2200 zone
15m:
Clear rejection wick + strong engulfing rebound from 2.1850 region
Structure still developing but forming an early higher low
Price reacting from prior imbalance area (near 2.2100–2.2150)

XRP/USD LONG SET UP TRADETitle: XRP/USD (RIPPLE) BUY
Asset: Crypto
Symbol: XRP/USD
Market Entry Price 1: $2.19
Stop Loss: $2.14
Take Profit 1: $2.24
Take Profit 2: $2.28 (close 25 %)
Take Profit 3: $2.34 (close 50%)
Take profit 4: $2.45
Status: ACTIVE

XRP RoadMap (1D)Let's take a look at Ripple to see what fluctuations it may experience over the next month or two.
We considered the upward move in 2024 as Wave A, the following correction as Wave B, and the third rise as a terminal 5-wave structure.
The sharp downward move is considered a post-pattern terminal, and now the waves we are in are regarded as a bearish cycle, forming an expanding/diametric/symmetrical triangle.
Whatever the larger pattern is, in aggregation it seems that the price will move downward from the red zone to the short-term targets marked on the chart.
The targets are marked on the chart.
A daily candle closing above the invalidation level will invalidate this analysis
For risk management, please don't forget stop loss and capital management
When we reach the first target, save some profit and then change the stop to entry
Comment if you have any questions
Thank You

why? 90% of traders buy high and sell low?Have you ever entered a trade right when everyone said it is going to the moon
Have you ever sold right before price exploded upward again
This guide is here to break that painful cycle once and for all
Hello✌️
Spend 3 minutes ⏰ reading this educational material.
🎯 Analytical Insight on xrp:
I expect a much bigger rise for Ripple than what I have shown on the chart. But we should remember that every year when the New Year approaches the market usually goes bearish. We need to wait and pass through that period to see what the final result will be.
Now , let's dive into the educational section,
🧠 Trader Psychology
When price pumps fast the brain fears missing profit
This fear forces rushed entries without any plan
During drops the brain wants to escape immediately
Emotions repeat the same losing behavior again and again
As long as emotions decide the market always wins
📉 Market Emotion Cycle
Hope and excitement start the first entries
Greed grows at the top and everyone buys with confidence
Fear suddenly appears and price collapses fast
Panic creates the worst possible exit timing
Professionals buy while panic controls the crowd
🎯 Why We Buy Tops And Sell Bottoms
We search for confirmation from the majority
The majority is usually late and wrong in timing
Crowded zones have the highest probability of traps
After attracting buyers price normally corrects downward
In the bottom panic sellers accelerate the drop
📌 Proper Entry Plan
Entries must happen in logical discounted areas
Follow the trend instead of fighting it blindly
A trade without risk reward logic is a bad trade
A clear plan neutralizes heat of the moment emotions
🛡 Real Risk Management
Stop loss must exist before entering a position
Small risk keeps the trader alive long term
Clear targets prevent emotional exits without purpose
Without stop loss the market owns your account
📊 TradingView Tools
Volume Profile shows where big money entered strongly
Auto Fib Retracement marks logical pullback zones
Fear and Greed Index shows collective emotional pressure
Horizontal levels identify probable price reaction zones
Combining these tools creates emotion free trading decisions
🏆 Professional Behavior
They never enter trades during emotional hype
They journal every decision for performance growth
They know the market always gives another chance
Mind control matters more than predicting every move
main point
Replace hype and the herd with logic and structure and the cycle of buying tops and selling bottoms ends here. Survival and profits come from mental discipline not guessing the future. Control emotions and you step into professional trading.
golden recommendations
Wait for pullbacks instead of chasing fast moving candles
When everyone feels extremely confident danger might be highest
A stop loss costs less than your pride and saves your future
✨ Need a little love!
We pour love into every post your support keeps us inspired! 💛 Don’t be shy, we’d love to hear from you on comments. Big thanks , Mad Whale 🐋
📜Please make sure to do your own research before investing, and review the disclaimer provided at the end of each post.

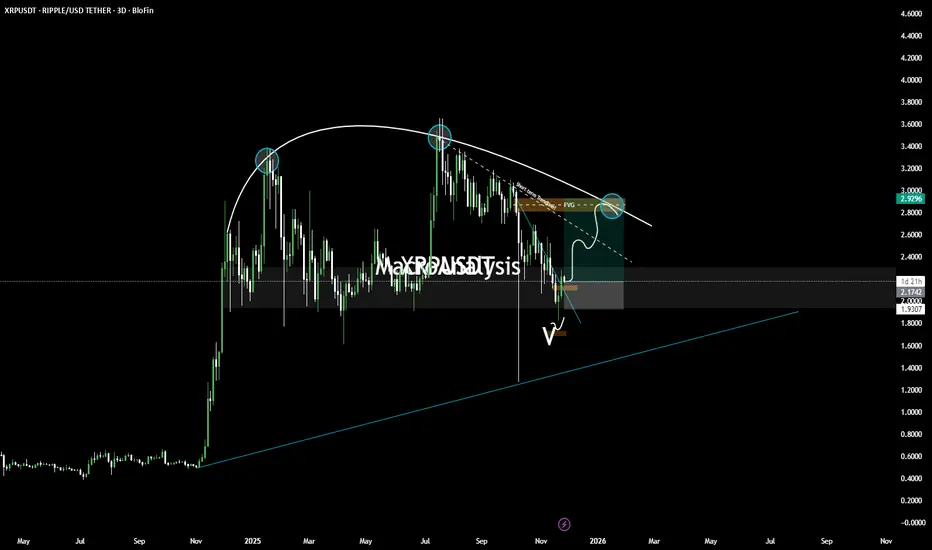
XRP — Major Macro Reversal Loading? XRP is completing a long-term structural pattern that has been developing for months. This setup includes a rounded top distribution, a full breakdown into major demand, and a potential reversal structure forming at the bottom.
This idea outlines both bullish and bearish pathways based on higher-timeframe confluence.
🔍 1️⃣ Rounded Top Distribution Completed
XRP formed a clear rounded top on the macro chart, with three major distribution points (highlighted).
Each point shows diminishing momentum and repeated rejection from the declining macro trendline.
This structure typically precedes:
Liquidity sweep lower
Long accumulation phase
Then high-timeframe reversal
We’re now entering the second phase.
🔍 2️⃣ Price Now Sitting in Major Higher-Timeframe Demand
Price has dropped directly into a large daily/3D demand block that held all previous macro corrections.
This zone aligns with:
Old imbalance fills
Breaker structure retest
Long-term ascending trendline below (blue line)
This is where macro buyers have stepped in before — and may do so again.
🔍 3️⃣ Bullish Scenario (Blue Path)
If price confirms demand strength, the bullish pathway is:
Sweep of local V-shaped liquidity
Retest of micro trendline (white dashed)
Break above the short-term breaker + FVG layer
Move toward the $2.95–$3.10 area (macro rejection zone)
This is the first major upside target.
A full reclaim above this level opens the door for a much larger trend reversal.
🔍 4️⃣ Bearish Scenario (White Path)
If demand fails, watch for:
Deviation above micro resistance
Rejection from FVG / breaker
Breakdown of V-swing formation
Deeper move toward long-term trendline support below
This would create a deeper macro accumulation before any major bullish cycle.
🎯 Summary
XRP is at a macro inflection point
We have:
Completed distribution
Full retest of long-term demand
Early signs of reversal structure
Clear upside targets and invalidation levels
This is a high-timeframe educational structure outlook, not a signal.
📘 Disclaimer
This post is for educational purposes only and reflects personal market analysis. It is not financial advice or a trade signal. Always DYOR and manage your own risk.
XRPUSDT buy limit idea.ENTRY: 2.2140
STOP LOSS: 2.2050
TP1: 2.2350
TP2: 2.2575
RRR: ~2.3:1
TYPE: Scalp
🔍 MULTI-TIMEFRAME ANALYSIS
1m:
Break of micro-structure to upside after strong push
Pullback created minor OB near 2.2140
Engulfing candle confirms reclaim of structure
5m:
Clean reclaim of 2.2100 level with bullish engulfing
Strong volume spike on breakout
Pullback forming into micro demand (prior resistance flip)
15m:
Bullish bias intact: higher lows + clear impulse
Price bounced from previous imbalance zone
15m forming structure continuation after pullback
⚠️ EXECUTION NOTES
SL below strong wick support, protected by structure
Entry confirmed by 1m reclaim + 5m OB + 15m bias
TP1 at prior rejection level (1.5R), TP2 into next resistance zone (2.25+)
RISK: 3%
Move SL to BE at TP1
Trail remainder to TP2 or structure break

XRP short term bullish setupPrice pushed strongly upward, then formed a small descending trendline as it corrected.
That correction held above support, creating a tight consolidation range.
We now have:
Break of the trendline
Retest of the broken structure
Bullish continuation setup forming above 2.18 support
As long as price stays above 2.18, buyers remain in control, and continuation toward 2.3169 is likely.
Invalidation:
Below 2.1374, the bullish idea fails.

XRP - 4hrXRP continues to compress against a downward trendline and against major support at $2. A break of this will see a potential upside of 25% to the $2.75 area. Watching this closely.
What are your thoughts on XRP?
Thanks and good luck

XRP/USDT : LIVE TRADEHello friends
Given the growth we had, the price has now broken its trading range strongly by sellers and our trend has also been broken, which is likely to push the price down.
Observe risk and capital management and avoid emotional behavior.
*Trade safely with us*

XRP/USDT Analysis. Long Setup
XRP shows weak selling pressure, while cumulative delta is rising on the entire decline, indicating background buying activity.
We expect a test of the $2.17–$2.154 buy zone. If a reaction appears, we consider a long position toward the nearest local high.
This publication is not financial advice.

XRP USDT LONG SIGNAL---
📢 Official Trade Signal – XRP/USDT
📈 Position Type: LONG
💰 Entry Price: 2.1789
---
🎯 Take-Profit Targets (Partial Exits):
• TP1: 2.2168
• TP2: 2.2490
• TP3: 2.2858
• TP4: 2.3390
• TP5: —
• TP6: —
---
🛑 Stop-Loss: 2.1315
📊 Timeframe: 15m
⚖️ Risk/Reward Ratio: 3.56
💥 Suggested Leverage: 5× – 10×
---
🧠 Technical Summary
XRP is currently showing bullish continuation signals after reacting from local support near 2.16–2.18.
Price is forming higher lows on the intraday structure, aligning with upward momentum.
Targets are positioned at key liquidity zones:
2.2168 → 2.2490 → 2.2858 → 2.3390
Holding above 2.1315 keeps bullish structure valid.
---
⚙️ Trade Management Rules
✔ Partial exit at TP1
✔ Move SL to Break-Even after TP1
✔ Trail SL as price climbs
✔ Do not re-enter if SL hits
✔ Confirm price structure before entering
---
📌 TradingView Hashtags
#XRPUSDT #XRP #CryptoSignal #LongSetup
#TradingView #FuturesTrading #Altcoins #TechnicalAnalysis
---

Ripple long term roadmap.This is my long term view.
* The purpose of my graphic drawings is purely educational.
* What i write here is not an investment advice. Please do your own research before investing in any asset.
* Never take my personal opinions as investment advice, you may lose your money.

Big XRP bullish move formingBYBIT:XRPUSDT has formed a (remarkably equaliteral) triangle flag pattern since breaking out of the parallel channel flag*. Given the previous 25% move upwards (i.e. the flagpole), text book technical analysis theory states that there is another upwards move imminent. This is a good opportunity for a medium term (approx. one month long) bullish swing trade.
A few things to note:
*The breakout move from the parallel flag channel was a text book move upwards where it moved outside of the channel (breakout move), then returned back to the resistance line of the parallel channel, which became support, and then continued the move upwards. This provided a very good entry opportunity upon the return move once the daily candlestick showed proved that resistance line is a now a line of support (i.e. the candlestick is of a dragonfly shape) - you enter on the dragonfly share confirmation
The triangle flag pattern is running out of room. i.e. the move is expected to come soon (this coming week) as the candlesticks are getting smaller and smaller in size, following, broadly speaking, the triangles lines of support and resistance, and there are not many days left until the candlesticks will naturally move out of the triangle.
The market psychology behind this is that the buyers who made a profit on the recent flagpole are now selling, with newer, bullish buyers entering the market. The price which the sellers are willing to sell and and buyers willing to purchase at is getting closer and closer, which usually means the continuation of the trend as there are more buyers (in this case) than sellers (i.e. people are willing to buy at a price closer and closer to the sellers ask price and sellers don't have to drop their prices as much to entire people to buy)
This is consistent with the optimistic and bullish sentiment for the economy in generally, stock market and crypto since Trump's election victory with Trump having recently announced that he would prefer lower interest rates i.e. The chart formation is showing that there are still more bulls than bears.
Risk to this move are that the RSI is overbought (which in this case can be ignored as it has been overbought for a few months and the nature of the indicator is that in a bullish market it remains at an overbought level regularly) and that the crypto market is prone to large gyrations on rumours and even minor US governmental policy announcements.

DeGRAM | XRPUSD will correct from the resistance line📊 Technical Analysis
● XRP/USD repeatedly rejects the descending resistance line, forming lower highs and preserving the broader bearish structure inside the falling channel.
● Price is approaching the upper boundary near 2.28–2.32, where previous reversals occurred, suggesting limited bullish continuation before a likely drop toward channel support.
💡 Fundamental Analysis
● Regulatory uncertainty around Ripple and slowing altcoin inflows continue to cap upside potential as traders rotate into stronger majors.
✨ Summary
● Bearish bias below 2.32. Targets: 2.10 → 1.95. Resistance: 2.32.
-------------------
Share your opinion in the comments and support the idea with a like. Thanks for your support!

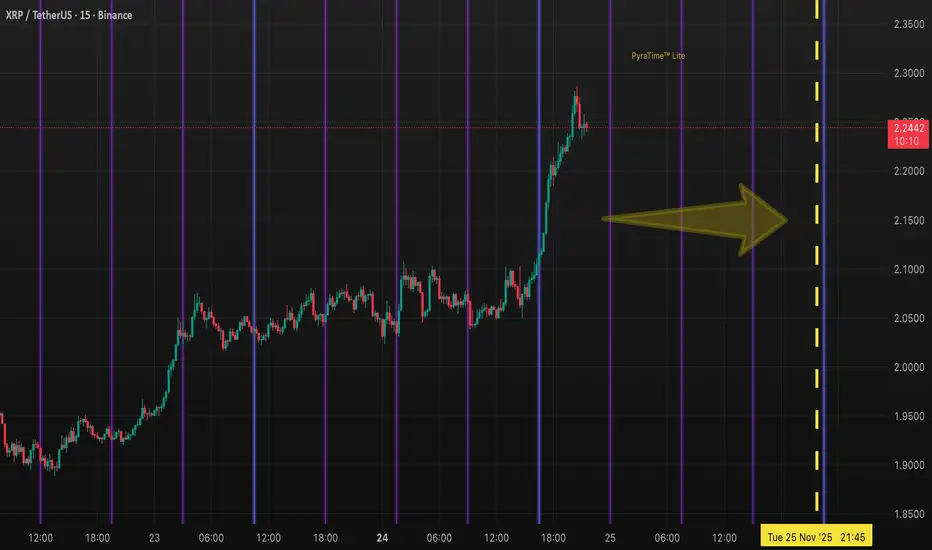
XRP: The "Time Singularity" – Rare Harmonic Convergence IncomingWe just witnessed the price respect the $2.20 geometric level perfectly. But Price is only half the equation. Time is about to take over.
If you study the chart above, look closely at the vertical timeline for Tomorrow (Nov 25) at 20:00 UTC.
⚠️ The Setup: A Harmonic Singularity Usually, our time pivots appear on specific timeframes independently. But tomorrow night, we are seeing a statistical anomaly. We have a Multi-Timeframe Convergence where the short-term high-frequency cycles and the medium-term swing cycles are hitting the exact same vertical coordinate simultaneously.
Think of this like two waves in the ocean combining to form a massive "rogue wave."
What does this mean? When these multiple pivot signals overlap, the market energy compresses. It creates a vacuum that must be filled by volatility. We are expecting a significant Expansion or Reversal event exactly within this window.
The Play: Do not front-run the time. Let the clock hit 20:00 UTC and watch the reaction.
Bullish Case: If Price is holding above $2.15 leading into 20:00, expect a violent expansion upward to challenge new highs.
Bearish Case: If Price is exhausted and below $2.15 entering this window, the time grid will likely force a sharp rejection/reversal to clear leverage.
Summary: Mathematics suggests the market is waiting for this specific minute to make its next major decision. Prepare for volatility.
Disclaimer: This is a time-based analysis using proprietary geometric modeling (PyraTime). This is not financial advice. Trade your own plan.
#XRP #Ripple #SacredGeometry #TimeAnalysis #Crypto
XRP Break and RetestXRP had strong bullish momentum to pss resistance and is likely to retest the $2.11-$2.15 block. With positive sentiment and ETF growth it is likely to push back to $2.5-$3 within the coming weeks.

Ripple outlook #xrp #shortLooking to short right here , I'm expecting a very down side bearish candle

$XRP 2H CHART UPDATE 📌 CRYPTOCAP:XRP is currently showing a short-term price increase ✅
📌However, I think it will be rejected again from the Resistance zone marked in red ✅
📌If that happens, the price could fall back to $2 🚀

XRP USDT LONG SIGNAL---
📢 Official Trade Signal – XRP/USDT
📈 Position Type: LONG
💰 Entry Price: 2.1037
---
🎯 Take-Profit Targets (Partial Exits):
TP1 = 2.1464
TP2 = 2.2100
TP3 = 2.2735
TP4 = 2.3385
TP5 = —
TP6 = —
---
🛑 Stop-Loss: 2.033
📊 Timeframe: 15m
⚖️ Risk/Reward Ratio: 3.47
💥 Suggested Leverage: 5× – 10×
---
🧠 Technical Analysis Summary
XRP is showing bullish continuation after rebounding strongly from the 2.05–2.10 support zone.
Price structure on the 15m timeframe remains bullish with higher lows forming consistently.
Momentum supports a push toward liquidity pockets at 2.1464, 2.210, and 2.2735, with extended upside targets near 2.3385.
As long as price remains above 2.033, the long setup remains valid and structurally healthy.
---
⚙️ Trade Management Rules
✔️ Take partial profit at TP1
✔️ Move SL to Break-Even once TP1 hits
✔️ Trail SL toward each target
✔️ Do not re-enter if SL is hit
✔️ Confirm structure + volume before entry
---
⚠️ Risk-Management Note
After TP1 is reached, SL is moved to Break-Even — this avoids unnecessary losses and locks the trade into zero-risk mode.
Capital protection always comes first.
---
📌 TradingView Hashtags
#XRPUSDT #XRP #CryptoSignal #LongSetup #TradingView
#FuturesTrading #TechnicalAnalysis #AltcoinSignals
--
