XRPUSDT UPDATE#XRP
UPDATE
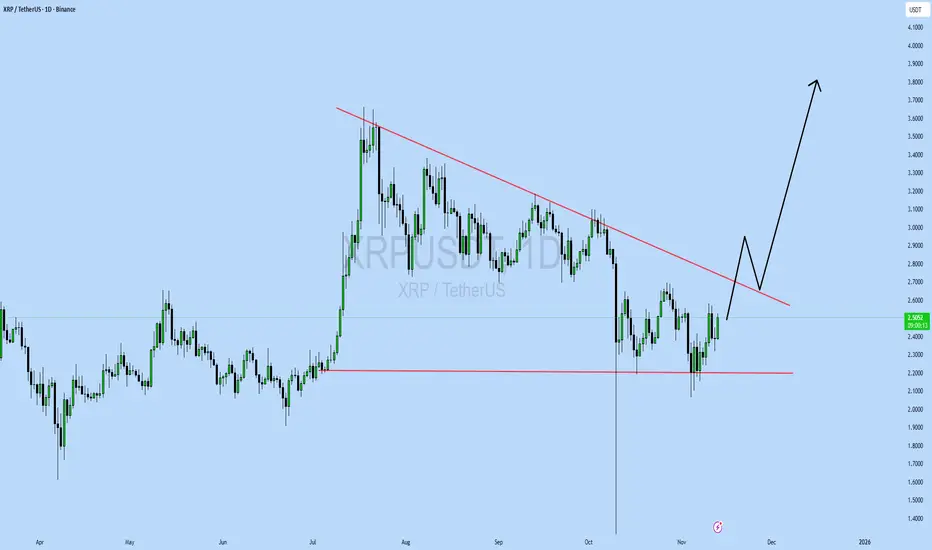
XRP Technical Setup
Pattern: Falling Wedge Pattern
Current Price: $2.49
Target Price: $3.80
Target % Gain: 52.61%
Technical Analysis: XRP is forming a falling wedge pattern on the 1D chart, suggesting bullish momentum is building. The price is approaching the upper resistance trendline and is expected to break out soon. A successful breakout, supported by volume expansion, could push XRP toward the $3.80 zone, aligning with previous structural highs.
Time Frame: 1D
Risk Management Tip: Always use proper risk management.
Market insights
Nasdaq Approves Spot $XRP ETFThe first spot CRYPTOCAP:XRP ETF (ticker:XRPC) is scheduled to go live today, signaling another step forward for the broader crypto-ETF market.
This marks a major legitimacy boost for XRP—something the asset hasn’t seen in years. Whether it becomes a true catalyst now depends on one thing: sustained inflows.
TECHNICAL VIEW:
CRYPTOCAP:BTC continues to dictate broader market direction, while XRP remains stuck in a multi-month range. The structure still leans bearish, with a clear sequence of lower highs showing that momentum has yet to return.
CRYPTOCAP:XRP is currently ranging between $2.06 and $2.70, with the upper boundary holding as firm resistance. Price made an attempt to break through the liquidity curve, but if price just stall here without a decisive break above $2.60, then we do have a risk of breaking down into $1.80-$1.70 zone.

XRP Downward Move Incoming? Market Manipulation at Play?I’m watching XRP closely on the 1H chart, and something feels off. This recent push up looks like a liquidity grab — classic manipulation to trap late long entries before a potential reversal.
The structure still shows lower highs forming, and we haven’t reclaimed key resistance levels convincingly. I believe we could see a move down from current levels, possibly retesting the demand zone below before any sustainable bounce.
Let’s see how it plays out — stay patient, stay sharp, and don’t get caught in the trap.
📉💡

$XRP Support Siege – Flip to Bulls on Hold?BINANCE:XRPUSDT CRYPTOCAP:XRP Support Siege – Flip to Bulls on Hold?
Current trend: XRP's in a corrective slide, probing the sturdy 2.31 support after topping out near 2.56 resistance—low-volume wicks suggest exhaustion, with alts eyeing a relief rally 🛡️.
Hold support? Solid odds yes; doji formations and volume pickup on greens signal buyers loading up for defense.
Breakout above resistance? On deck if closes over 2.56—could spark 5-7% rip to fresh highs 🚀.
Dip risk? Low-moderate to 2.25 on BTC drag, but MACD divergence limits downside.
Target: Near-term 2.55 retest, then 2.70 if momentum flips.
Indicators tracking: MACD for crossover signals, RSI (hovering 42) for oversold snapback, and VWAP as pivot 📊.
#XRPTrading #AltcoinRebound #CryptoSupport

XRPUSDT 1D#XRP is moving inside a bullish flag on the daily chart. Consider buying around the support zone. For the bullish scenario, the price must hold inside the flag; therefore, two consecutive daily candle closes below the flag will invalidate this analysis.
In case of a successful bounce from the support zone, the short-term target is:
🎯 $2.5777
And in case of a breakout above the daily SMA200 and the flag resistance, the next potential targets are:
🎯 $2.7845
🎯 $2.9913
🎯 $3.2471
🎯 $3.6607
⚠️ Always use a tight stop-loss and apply proper risk management.

BTC LONGS!!The Crypto Market Is Pulling Back… But This Changes Nothing! Im looking for longs on BTC!!
In this video, I break down the current crypto move to the downside and why I still believe this is a healthy pullback, not the start of a bearish trend. I’ve been talking about this setup for weeks — and it’s unfolding exactly as planned.
Here’s what I cover:
-Analysis of Total Market Cap, BTC, ETH, and XRP
-CME Gap finally filled — what that means for price action
-Why this could be the perfect area for high-risk long setups
-What I’m looking for next and how I’m planning my next trades
⚠️ Disclaimer:
I am not a financial advisor. The content shared on this channel is for educational and informational purposes only and should not be considered financial advice.
Trading and investing in cryptocurrency involve high risk — you could lose some, or all, of your money. Always do your own research and make sure you understand the risks before making any financial decisions.

XRP Update📊 XRP Update
XRP is approaching the green support zone 🟢
Now the question is — will it bounce or break below? ⚖️
If it holds, we could see a strong rebound 📈
But if it breaks, expect a deeper correction 🔻

XRPUSDT 30min Longs 🔵 Market Structure
Break of Structure (BOS): Above 2.4283 confirmed
Liquidity Sweep: Below 2.4019 before push upward
🟡 ICT Concepts
⚡ Trade Setup
Long Entry: 2.4150-2.4200 (current pullback)
Stop Loss: Below 2.3980 (FVG break)
Targets :
TP1: 2.4500-2.4750
TP1:2.5200-2.5700
Bullish structure intact - buying dips for liquidity grab above
#XRP #SMC #ICT #TradingView #Bullish

XRPUSDT.P - November 12, 2025XRPUSDT.P is showing potential for a short-term bullish reversal after stabilizing near the $2.3779 support zone. The pair is attempting to break above a descending trendline, which has contained price action throughout the recent downtrend. A confirmed breakout and sustained move above the $2.4399 resistance level could signal renewed buying interest. If momentum builds, price action may target the $2.5758 profit level, representing the next key upside objective.
The stop level is positioned around $2.3148–$2.3200, marking the invalidation area for this bullish setup and protecting against a deeper correction.
Risk Assessment: Moderate to High — While early signs of a trend reversal are forming, XRPUSDT.P remains within a broader bearish structure. Failure to hold above the $2.38 zone or rejection from the trendline could trigger a renewed selloff toward $2.32 or lower. Confirmation above $2.44 is essential for a stronger bullish case.

XRP/USDT — Reversal Incoming or Deeper Breakdown?XRP is now standing at a make-or-break point. After weeks of movement inside a well-defined descending channel, price is once again testing the critical support zone at 2.32–2.17 — the level that has repeatedly acted as the last line of defense for the bulls.
This zone has held multiple times, yet each bounce has been capped by the upper boundary of the channel — forming a classic corrective structure where bearish momentum gradually weakens, preparing for a potential breakout phase.
---
📊 Pattern & Technical Structure
The chart reveals a descending channel pattern, typically signaling a corrective or consolidation phase within a broader market cycle.
Lower boundary of the channel → potential accumulation area and source of rebound.
Midline → dynamic resistance that has repeatedly rejected upward attempts.
Support box 2.32–2.17 → the decision zone, where bulls and bears will soon reveal the next major trend.
Failure to hold this level could trigger another leg down, while a strong defense here could mark the beginning of a larger trend reversal.
---
🚀 Bullish Scenario
A bullish breakout setup will be confirmed if:
1. Price closes above the descending channel with strong daily momentum.
2. The breakout is followed by a successful retest of 2.75 as a new support.
3. Upside targets then lie at 3.09 – 3.32 – 3.56 – 3.66, representing potential wave extensions.
If validated, this move could trigger a powerful recovery rally and possibly signal a major bullish reversal on the higher timeframes.
---
🔻 Bearish Scenario
On the flip side, if the 2.17 support fails to hold and a daily close occurs below this zone, then:
Price could continue sliding toward the lower boundary of the channel (1.95–1.80),
Extending the correction phase,
And potentially forming a lower-low structure in continuation of the broader downtrend.
This would confirm a sustained bearish control in the medium term.
---
📍 Conclusion
XRP is at the edge of compression, where the next decisive move will define its next big trend.
This descending channel may soon reveal whether it’s a bear trap before a breakout, or the start of another downward leg.
The reaction at the 2.32–2.17 zone will decide everything — this is the battlefield between reversal and breakdown.
Watch for daily closes, volume confirmation, and price behavior around the upper boundary of the channel.
Smart traders know — the calm before the breakout is where the biggest opportunities are born.
---
#XRP #XRPUSDT #Ripple #CryptoAnalysis #TechnicalAnalysis #DescendingChannel #PriceAction #SupportResistance #CryptoBreakout #SwingTrade #ChartPattern

#XRPUSDT: Bullish Reversal Coming With Price Heading Back To 3.5## XRPUSDT Analysis: Long-Term Perspective
In the long term, we anticipate the XRPUSDT price to revert to its all-time high of 3.5. From a fundamental analysis standpoint, we maintain a positive outlook, with the potential for the price to surpass 3.5. We have identified a favourable trading opportunity, as illustrated in the chart.
Our approach is neutral, as the trend remains undecided. Based on the duration of your positions, you can set two targets:
1. **Short-Term Target:** If you intend to hold your positions for a short period, aim for a price level above 3.5.
2. **Long-Term Target:** For long-term investors, a target price of 4.0 or higher is plausible.
We are committed to providing comprehensive analysis and support. Should you have any inquiries or require further clarification, please do not hesitate to contact us.
Additionally, we would appreciate your insights on which cryptocurrency pair you would like to explore next.
Regards,
Team Setupsfx_

$XRP: Bouncing from Support, Breakout in Sight?BINANCE:XRPUSDT CRYPTOCAP:XRP : Bouncing from Support, Breakout in Sight? 📊🚀
XRP's current 1H trend is bullish, solidly holding the main support at ~2.33 after a quick rebound—strong buyer interest here!
Expect a potential breakout above 2.61 resistance if volume spikes, targeting 2.80 next.
Low risk of deeper dip unless support cracks (possible test at 2.20).
Tracking RSI (hovering neutral ~55), 50 EMA crossover, and MACD histogram turning positive.
Stay bullish, but set stops! 💎📈
#XRP #CryptoTrading #Altseason

XRP elliot wave scenario: 5 wave upside?For my full xrp elliot wave scenario, check my earlier post where I cover the elliot wave count on the weekly timeframe for my long term setup based on probabilities.
Zooming in on the 4H timeframe, we have seen a beautiful momentum to the upside but for now it's still a three wave move. We need five waves to the upside to confirm a bullish setup by finishing a wave I to create opportunities for the wave II.
Currently we are in the wave three and the target is the 1.618 fib sitting at 2.62$.
The invalidation of this setup and a five wave impulse is the 0.618 fib of the internal wave four of wave three sitting at 2.31$ as this would invalidate the internal wave four of the wave three.
to make it easy:
bullish scenario:
wave 3 target: 2.62
After that a wave 4 and wave 5 to finish the wave I
Then we have finished a wave I and can prepare the setup for a wave II
bearish scenario:
we make only 3 waves with invalidation sitting at 2.31 which is the 0.618 of the internal wave 4 of wave 3
Share your opinion! Peace!

Next volatility period: Around November 26
Hello, traders!
Follow me to get the latest information quickly.
Have a great day!
-------------------------------------
(XRPUSDT 1D chart)
Currently, the M-Signal on the 1W chart > Price > M-Signal on the 1D chart > M-Signal on the 1M chart.
Additionally, it is attempting to break above the StochRSI 80 indicator.
Therefore, if it finds support near the StochRSI 80 indicator and rises, it is highly likely to enter an uptrend.
The resistance zone is around 3.4037-3.4540, which is the HA-High ~ DOM (60) range.
The above is an interpretation based solely on the 1D chart.
-
The chart above displays support and resistance points drawn on the 1M, 1W, and 1D charts.
This indicates that support and resistance have formed in the 2.9092-3.0361 range.
Therefore, we have identified a zone where we can execute a two-stage sell-off.
This confirmation will be crucial for maintaining a stable psychological state amidst price volatility.
If the price falls to the 1.5-1.9669 range, which is the most important level for maintaining an uptrend, you should watch for an explosive increase in trading volume.
If it shows support, it indicates a buying opportunity.
-
Thank you for reading to the end.
I wish you successful trading.
--------------------------------------------------

$XRP Resistance Test – Breakout Incoming?BINANCE:XRPUSDT Resistance Test – Breakout Incoming?
XRP's 1H chart building bullish momentum, probing resistance at 2.583 after solid bounce from support ~2.50—break above targets 2.65, but watch for rejection dip to 2.45 if volume dips.
Strong uptrend holds.
Key indicators: RSI at 65 (bullish), 50MA support intact, MACD histogram expanding. 🚀💥
#XRP #Ripple #AltcoinPioneers

The Final Crypto Shakeout Before The Big Move?Everyone’s Bearish… I Couldn’t Be More Bullish!
In this video, I break down the current crypto market after a strong weekly close. While everyone is panicking and calling for a bearish trend, I see the opposite. This is exactly what we want to see before the next big move.
Here’s what I cover:
-Total Market Cap, BTC, BTC CME Gap, ETH, and XRP analysis
-Why fear in the market = opportunity
-The final possible sweep in December before the next leg higher
-My current XRP position and what I’m watching next
The market rewards patience, not panic — this is the time to stay focused and think smart.
#Crypto #Bitcoin #Ethereum #XRP #BTC #ETH #Altcoins #CryptoTrading #ICTStrategy #MarketAnalysis

XRPUSDT.P - November 7, 2025XRPUSDT.P is showing early signs of a short-term bullish reversal after rebounding from the ascending trendline support near the $2.16–$2.18 zone. A buy limit is positioned around $2.219, aiming for a move toward the $2.283 partial profit zone and the $2.336 profit level.
A confirmed breakout above $2.283 would validate bullish continuation, while a drop below $2.158 would invalidate this setup and signal renewed downside pressure.
Risk Assessment: Moderate — structure leans bullish, but sustained strength above the partial profit level is needed for confirmation.

XRP. USDTRipple performs best on the weekly timeframe, and this is not just my opinion, all signs point to an upward trend.
ripple pushing custody as a service because when banks custody your coins on top of xrp they are not dumping they are parking. so yeah market is red but a 40b enterprise building rails around a 20 something billion token smells like future upside to me too.

how to Stop Your Money Losing Value??Have you ever felt that despite your hard work, your purchasing power is fading? This is an invisible war, a war where your cash is on the losing side. But there are practical ways to protect your assets and even grow them in the long term.
Hello✌️
Spend 3 minutes ⏰ reading this educational material.
🎯 Analytical Insight on Ripple:
XRP is testing a strong support while moving on the descending channel. A confirmed breakout with solid volume could drive a 20% rally, targeting 2.80$. 📊🚀
Now , let's dive into the educationa l section,
🛡️ Understanding the Invisible Enemy
Inflation is the primary enemy of your capital. This phenomenon slowly but surely erodes the value of your money. When the bank interest rate is lower than the inflation rate, you are effectively losing your wealth. The main goal is to find a way to achieve returns higher than the inflation rate.
🌍 The Mindset of a Preserver
The first step is to shift your mindset from a "saver" to an "investor". Your money should work for you, not the other way around. This mindset forces you to always look for opportunities that not only preserve but also increase the value of your assets.
📈 Smart Diversification
Never concentrate all your assets in one investment class. A mix of different assets such as stocks, commodities, and digital assets can form a strong shield against market fluctuations. The principle of diversification significantly reduces the risk of losing your entire capital.
⚙️ The Art of Risk Management
Preserving capital takes priority over making profits. Only enter trades with capital whose loss would not affect your current lifestyle. Setting a stop-loss for every investment position is a necessity, not an option. This protects you from negative market surprises.
🧠 Mastering Psychology
Fear and greed are two powerful and destructive emotions in the market. The fear of missing out causes you to lose golden opportunities, and greed pushes you to hold investments at price peaks. To succeed, you must overcome these emotions and stick to your strategy.
🔍 Identifying Opportunities with Trading views Tools
This section focuses on the practical search for assets with potential. Analytical tools can provide you with a better perspective for this task.
Market Scanner: Use this tool to screen thousands of assets based on specific technical criteria. You can find assets that have crossed an important moving average or are consolidating within a specific range.
Creating Charts: Create different charts for one asset and use indicators in combination. Comparing an asset's performance against others can reveal its strengths and weaknesses.
Sharing Feature: Share your ideas and analyses with the large community of users and benefit from their feedback. This helps you see hidden aspects of a situation.
🎯Top Recommendations for Action
First, have a written trading plan for yourself and do not take any action without it. Second, always withdraw a portion of your profits from the market and convert them into lower-risk assets. Third, never stop learning; markets are dynamic, and yesterday's strategies may not work tomorrow.
🚀 Final Word
Preserving the value of money is not an event; it is a continuous process. This path is paved with education, consistent analysis, and emotional control. By using the right tools and adhering to principles, you can protect your assets against inflation.
✨ Need a little love!
We pour love into every post your support keeps us inspired! 💛 Don’t be shy, we’d love to hear from you on comments. Big thanks , Mad Whale 🐋
📜Please make sure to do your own research before investing, and review the disclaimer provided at the end of each post

Lingrid | XRPUSDT Downside Pressure AcceleratingBINANCE:XRPUSDT trades below the descending trendline inside a clearly defined downward channel, keeping the broader structure bearish. Price action has recently tested the $2.44 zone but failed to sustain a breakout, signaling continued weakness. As long as the pair stays under $2.50 resistance, a retest toward $2.00 support remains the likely path. Momentum indicators align with a slow drift lower, reinforcing short-term bearish control.
⚠️ Risks:
A sudden Bitcoin rally could lift altcoins and negate the bearish setup.
Positive regulatory news around XRP may trigger unexpected volatility.
U.S. macro data or risk sentiment shifts could strengthen USD demand dynamics.
If this idea resonates with you or you have your own opinion, traders, hit the comments. I’m excited to read your thoughts!

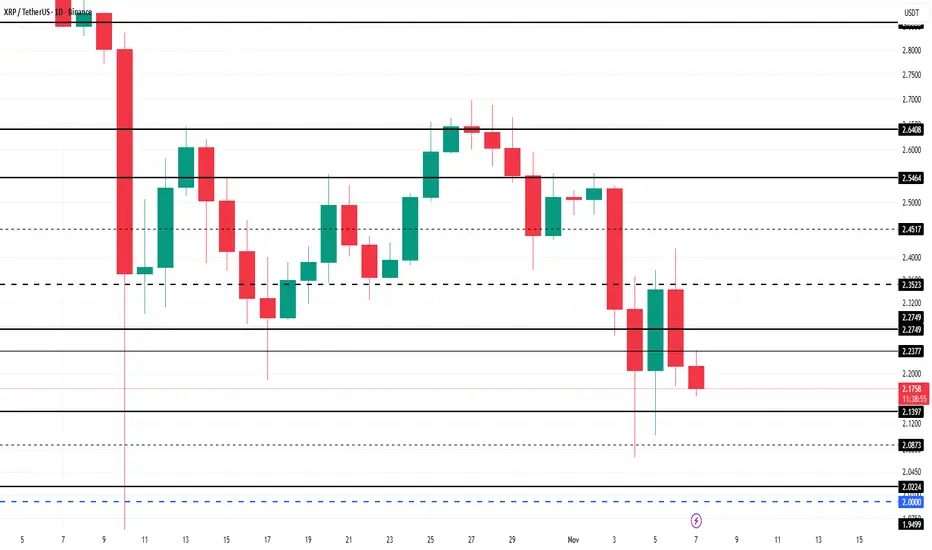
XRP Price Is 9% From Crashing To $2, Can It Be Avoided?At the time of writing, XRP is priced at $2.21, trading below the key resistance at $2.27. If long-term holders begin selling aggressively, the altcoin could fall toward $2.00, marking a 9% decline from current levels.
A drop to $2.00 would require XRP to break through supports at $2.13 and $2.02, both critical levels for short-term stability. If these fail to hold, the altcoin could experience accelerated losses.
However, if investor sentiment strengthens, XRP could rebound above $2.27 and aim for $2.35. A decisive break beyond $2.54 would confirm recovery and invalidate the current bearish outlook, signaling renewed bullish control.

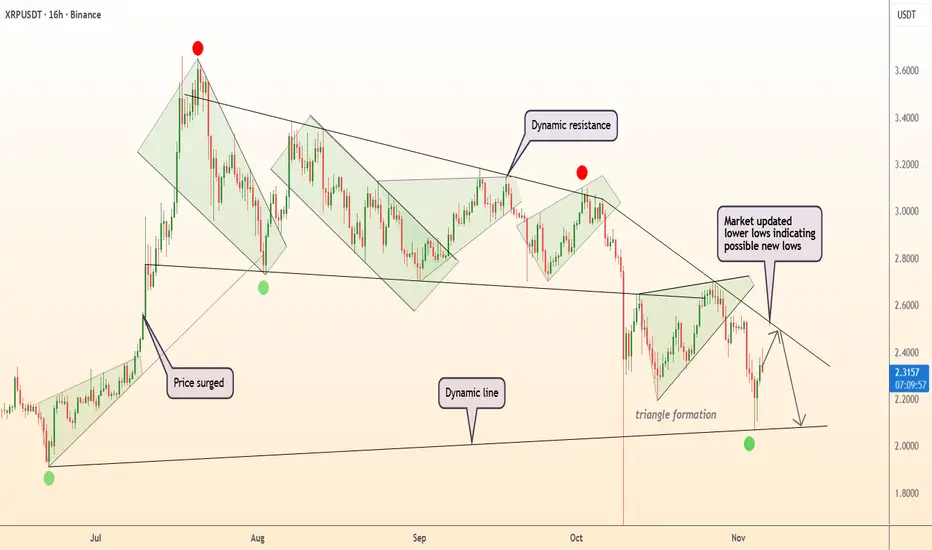
DeGRAM | XRPUSD keeps a descending structure📊 Technical Analysis
● XRP/USD remains below the dynamic resistance line, forming a series of lower highs and lower lows that reinforce the bearish structure. The recent rejection from $2.60 and continuation within the descending pattern point to possible retests of lower supports.
● A breakdown below the $2.20–$2.00 zone could accelerate selling pressure, confirming a move toward new lows within the broader downtrend channel.
💡 Fundamental Analysis
● Recent market uncertainty and reduced risk appetite among crypto investors continue to weigh on altcoins, with XRP showing weaker recovery compared to peers.
✨ Summary
● Key resistance: $2.60. Support: $2.00. A sustained move below $2.20 could extend the decline toward $1.90.
-------------------
Share your opinion in the comments and support the idea with a like. Thanks for your support!