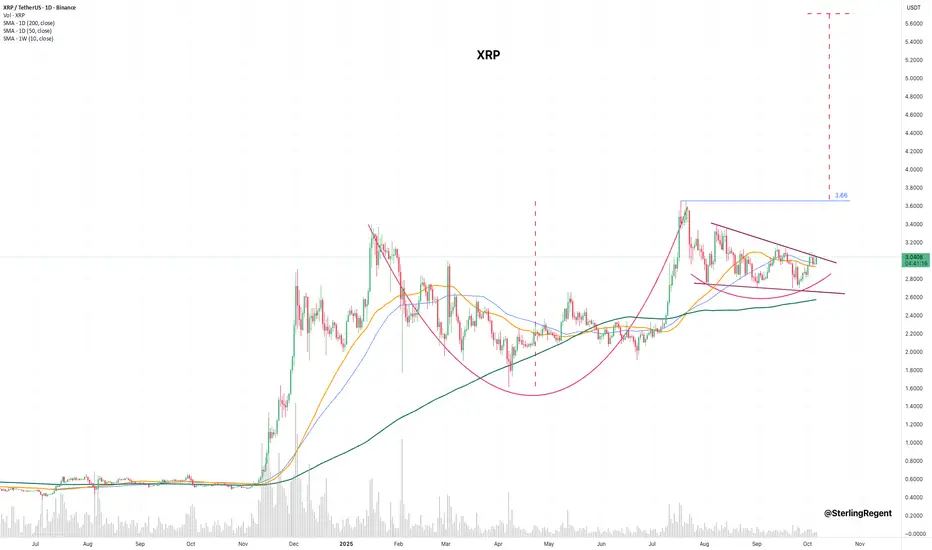
Ripple. Strong pattern at the end of its formation.This is likely a solid Cup and Handle pattern in XRP.
Trade ideas
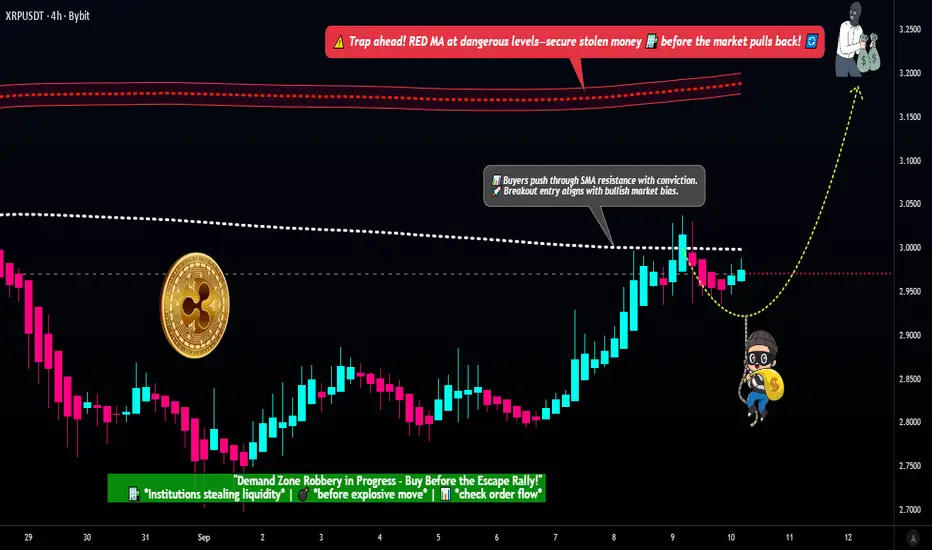
XRP/USDT — Breakout Pending! Will Thief Layers Unlock Profits?🔥 XRP/USDT "RIPPLE VS TETHER" Thief Plan (Swing/Day Trade)
🎯 Trade Setup
Plan: Bullish (Pending Order Plan)
Entry: Breakout at 328 SMA ➝ $3.0000 ⚡
🛎 Set alarm in TradingView to catch the breakout easily.
Thief Strategy = Layered Entries:
$2.9300
$2.9500
$2.9800
$3.0000
(You can increase layers based on your own strategy).
Stop Loss: Thief SL ➝ $2.8800 (after breakout). Adjust SL to your risk preference.
Target (TP): Escape before trap ➝ $3.2000.
Note: Targets & stops are flexible. Risk management is your responsibility.
📊 XRP/USDT Real-Time Data (10 Sept 2025)
Current Price: $2.97
24h Change: -1.11%
Trading Volume: High (4.4B+ XRP traded)
📈 Retail & Institutional Sentiment
Retail Sentiment (Greed 60/100)
Optimism on ETF speculation & rebound momentum.
High social/media buzz fueling greed.
Institutional Sentiment (Neutral–Cautious)
Whales accumulated 340M XRP near $3.20–$3.30 = long-term confidence.
But $1.9B liquidations since July = short-term caution.
😨 Fear & Greed Index
XRP-Specific Score: 60/100 🟢
Volatility: Greed
Volume: Greed
Whale Activity: Extreme Fear (selling pressure)
Order Book: Extreme Greed (buying demand)
Overall Crypto Market: 51/100 (Neutral)
📉 Fundamental & Macro Analysis
Fundamental Score: 7/10
✅ ETF approval speculation (Grayscale/Franklin Templeton).
✅ Ripple expanding RLUSD stablecoin into Africa.
⚠️ Risks: SEC lawsuit uncertainty + Ripple’s centralization issue.
Macro Score: 6/10
Global crypto cap $3.85T (+2.5% weekly), but under 50D avg.
U.S. inflation release = key volatility trigger this week.
🐂 Why This Thief Plan?
Bullish Case (60%)
ETF approval hype (90%+ probability).
Whale accumulation + strong institutional positioning.
Historical September strength (+87% avg. gains).
Bearish Case (40%)
Resistance failure at $3.20.
Whale sell-offs + profit taking.
Crypto-wide sentiment still neutral.
💎 Key Takeaways
High volatility expected around ETF & macro news.
Short-term breakout = fast profit chance with thief layering.
Long-term = bullish bias if ETF approvals confirmed.
👀 Related Pairs to Watch
$BTC/USD (Overall market direction)
$ETH/USD (Altcoin leader)
$SOL/USD (Key altcoin sentiment)
✨ “If you find value in my analysis, a 👍 and 🚀 boost is much appreciated — it helps me share more setups with the community!”
#XRP #Ripple #Crypto #CryptoTrading #USDT #Bitcoin #Ethereum #ThiefTrading #SwingTrade #DayTrading #Breakout #TradingView
XRP/USDT Market Report + Strategic Entry Levels🚀 XRP/USDT Market Report & Layered Trading Plan (Day/Scalping Trade) 📊
Current Price Snapshot 💰
XRP/USDT is trading at $2.81, down slightly 0.04% over the last 24 hours amid broader market consolidation. Daily volume is strong at over $3B, showing steady interest. Market cap sits around $167B, ranking XRP in the top 4 cryptocurrencies. Support has held near $2.80 over the past week, with potential for a rebound if key levels break.
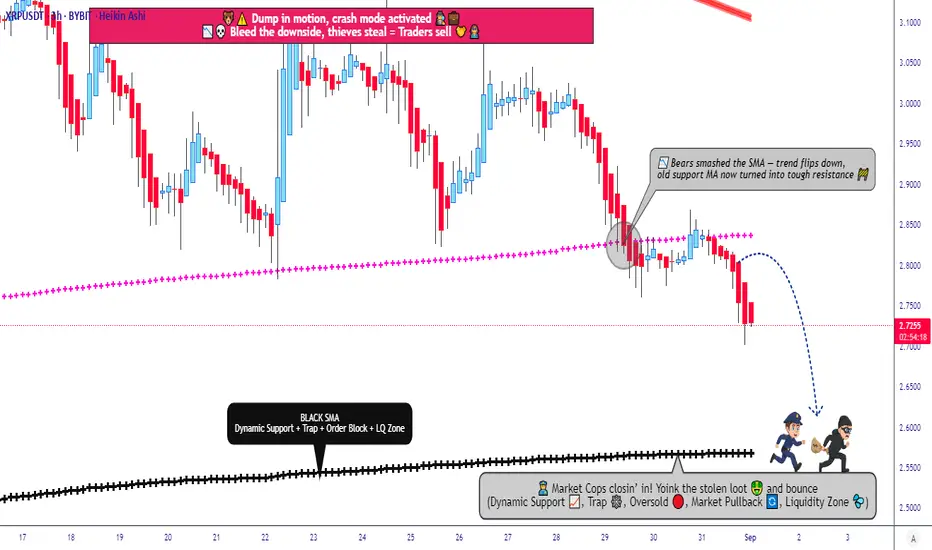
📈 Trading Plan: Bearish (Layered Strategy)
Entry : Any price level; use multiple limit orders (layering strategy) for controlled exposure. Example layers: 2.7500 | 2.7700 | 2.8000 | 2.8200. Adjust layers based on your own risk/reward preference.
Stop Loss 🛑: Suggested 2.8800. Adjust according to your personal strategy.
Target 🎯: 2.5700. Use smart exits and scale out of positions based on market momentum.
✅ Layered entries help reduce risk while maximizing opportunity. Ideal for scalping/day trades.
😊 Investor Mood & Sentiment
Overall Bullishness: 65%
Retail Traders: 70% bullish – excitement over payments utility, ETF expectations, partnerships.
Institutional Traders: 55% bullish – whale accumulation + cautious optimism, with some profit-taking.
Fear & Greed Index ⚖️: 48 (Neutral) – market steady, volatility at 4.27%. Consolidation phase ideal for strategic positioning.
🏗️ Fundamental Score: 85/100
Strengths: High adoption (300+ partners, $1.3T yearly transactions), fast XRPL settlements (3-5s), low fees, escrowed supply cap, burned fees reduce circulating supply.
Weaknesses: Competition from stablecoins like USDC could cap growth if banks shift focus.
🌍 Macro Score: 75/100
Bullish Drivers: Fed rate cuts, crypto-friendly policies, ETF approvals likely.
Challenges: Trade tensions, inflation, emerging market pressures.
Net positive: adoption in Asia/Africa outweighs headwinds for now.
🔮 Overall Market Outlook
Bullish (60% probability) 🟢 – potential to test $3.35 resistance, with $4 possible if ETF news hits.
Key Watch: Break above $3.00 confirms strength. Buy dips near $2.72 support for upside.
🗂 Related Pairs to Monitor
ETH/USDT | BTC/USDT | LTC/USDT | ADA/USDT
#XRPUSDT #Ripple #CryptoTrading #Scalping #DayTrade #LayeredStrategy #CryptoAnalysis #MarketReport #CryptoSentiment
XRP Price Fails Breakout Following $950 Million SellingAt the time of writing, XRP is trading at $2.96, maintaining its position just above the $2.94 support level. The altcoin was poised to break out of its descending wedge pattern, but that attempt has failed for now, suggesting further weakness.
If the selling trend persists, XRP could extend its decline. The token risks dropping to $2.85 or lower toward $2.75, testing the lower boundary of the wedge pattern. Such a fall would confirm bearish dominance.
However, if investors regain confidence and halt the ongoing sell-off, XRP could stage a recovery. A successful rebound past $3.02 may open the path to $3.12 or higher, potentially invalidating the bearish outlook.


#XRP/USDT looking extremely bullish#XRP
The price is moving within a descending channel on the 1-hour frame, adhering well to it, and is heading for a strong breakout and retest.
We have a bearish trend on the RSI indicator that is about to be broken and retested, which supports the upward breakout.
There is a major support area in green at 2.93, representing a strong support point.
We are heading for consolidation above the 100 moving average.
Entry price: 2.96
First target: 3.02
Second target: 3.06
Third target: 3.10
Don't forget a simple matter: capital management.
When you reach the first target, save some money and then change your stop-loss order to an entry order.
For inquiries, please leave a comment.
Thank you.

XRP 1H Analysis - Key Triggers Ahead☃️ Welcome to the cryptos winter , I hope you’ve started your day well.
⏰ We’re analyzing XRP on the 1-Hour timeframe .
👀 On the 1-hour timeframe, XRP recently completed a solid bullish rally, reaching resistance around $3.06, before retracing toward its local support zone near $2.94. The coin has tested its top level about three times, getting rejected each time under selling pressure. After the latest rejection and rebound from the $2.94 zone, a short-term trigger has formed around $2.98 — a breakout above this level could significantly increase the likelihood of a resistance breakout.
🧮 The RSI oscillator shows that after ranging below the 50 zone, it has now crossed above it and is heading upward. A 1-hour candle close above the trigger zone would confirm bullish momentum; otherwise, the move risks failing.
🕯 The recent candle structure on the 1-hour chart has been relatively range-bound, partly due to low market activity during holidays. However, with increasing volume and the larger size of recent bullish candles, there’s potential for stronger upward continuation.
🧠 For XRP positions, traders can consider low-risk entries once a candle closes above the marked trigger zone in this analysis. Rising volume and strong candle closures may fuel volatility and expand long opportunities.
❤️ Disclaimer : This analysis is purely based on my personal opinion and I only trade if the stated triggers are activated .

BTC Hits New ATH… But What Happens Next? (History Says This)Bitcoin has finally taken out its all-time high — exactly as predicted in my previous analysis.
Now the real question is… what happens next?
In this video, I break down what this breakout means for BTC, TOTAL, and ALTs, and why the weekly close will be critical.
Historically, every time Bitcoin takes out all-time highs, we see strong bearish pressure shortly after — and this time might be no different.
Here’s what I cover:
- Bitcoin hits a new all-time high: what’s next?
- Historical patterns after ATHs
- What to expect from the weekly close
- XRP short update (still running)
- My BTC targets and what I’m watching next
- Altcoin rally incoming?
Stay patient, stay disciplined, and remember — the market rewards those who can manage risk and read structure.
⚠️ Disclaimer: This video is for educational purposes only and does not constitute financial advice. Always do your own research before trading or investing in cryptocurrency.
#Crypto #Bitcoin #BTC #XRP #CryptoAnalysis #ICTTrading #Altcoins #CryptoMarketUpdate #BitcoinATH

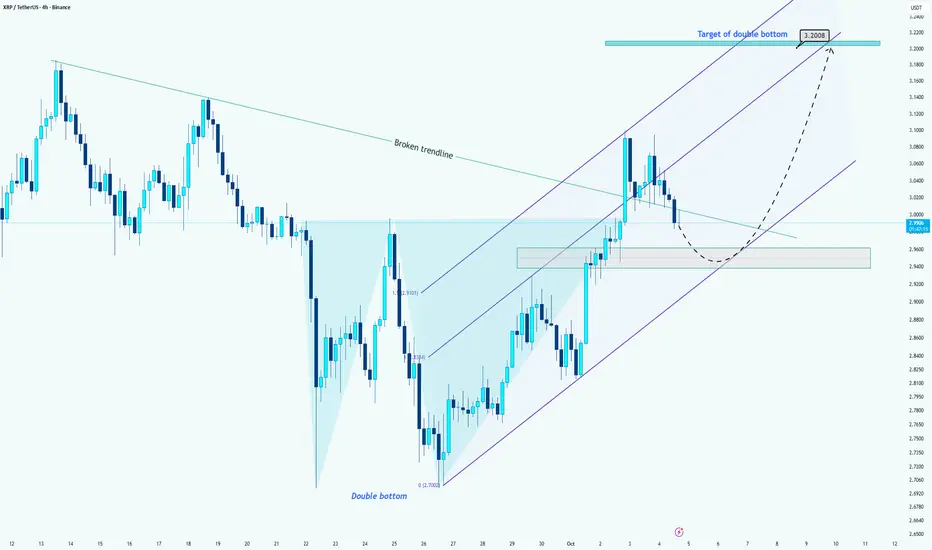
XRP/USDT –> Double Bottom Formation Confirmed!Hi guys!
After breaking above the descending trendline, XRP has confirmed a double bottom pattern around the 2.70 area.
Currently, the price is moving inside an ascending channel, but after facing resistance near 3.10, it has entered a correction phase. The 2.94–2.96 area now acts as a key support zone, aligning with both the previous neckline and the channel’s midline.
If this support holds, we can expect the price to bounce upward and resume its bullish momentum toward the 3.20 area, which represents the target of the double bottom.
However, if the 2.94 support breaks down, we might see a deeper correction toward the lower channel boundary before any continuation move.
🎯 Targets:
First target: 3.20 USDT (double bottom projection)
Extended target: 3.30 USDT (upper channel resistance)
BTC FAKE HIGH?Total market cap has created a new all-time high... but Bitcoin hasn’t.
Could this be a fake high before a massive sweep and reversal?
In this pre-weekly outlook, I break down what I’m seeing across the market — including BTC, TOTAL, and XRP — and why I believe this move up might be the trap before the drop.
Here’s what I cover:
- TOTAL market cap breaks all-time high — what it means
- Why BTC might sweep its all-time high next
- Fake move scenario and why I’m still expecting downside
- Why this is NOT the start of alt season
- XRP short +80% update from my previous call
I’ll be waiting for the weekly close for confirmation, but the structure is clear — don’t get fooled by short-term pumps.
#Crypto #Bitcoin #BTC #XRP #CryptoAnalysis #ICTTrading #CryptoMarketUpdate #Altcoins

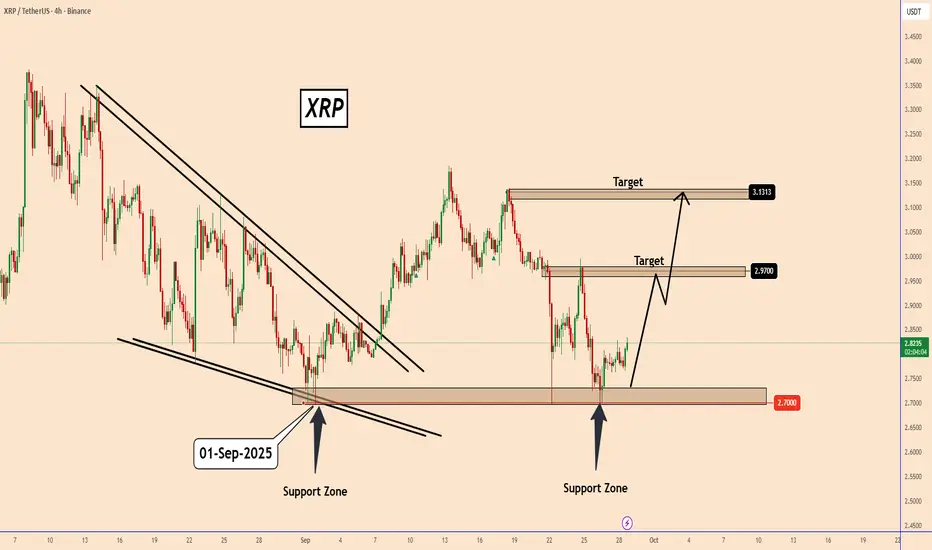
XRP: Bounce From Support Targets 3.13
XRP: Bounce From Support Targets 3.13
Price tested the support zone around 2.70 and bounced higher.
This shows buyers are stepping in to protect the level.
First target is at 2.97, where price may face resistance.
If momentum continues, the next target is around 3.13 that corresponds also to a strong structure zone again where XRP was rejected during the previous days.
As long as the price stays above the support zone, the short-term outlook remains bullish.
It is a bit risky overall considering BTC is not taking any direction yet, but as long as we can monitor the price, we should hold this zone.
You may find more details in the chart!
Thank you and Good Luck!
❤️PS: Please support with a like or comment if you find this analysis useful for your trading day❤️
WHAT EVERY A HAPPY PERSON SHOULD KNOW #XRP technical analysis for **XRP/USDT** (4-hour chart)
---
## **1. General Overview**
* **Timeframe:** 4-hour (mid-term outlook)
* **Current Price:** Approximately **$3.02**
* **Market Structure:** Symmetrical Triangle within a broader bullish trend (*Bullish Continuation Pattern*)
* **Projected Weekly Target:** **$18 – $24**
---
## **2. Geometric and Pattern Analysis**
### **Main Pattern:**
The recent market structure reveals a **symmetrical triangle** forming after a strong upward movement (from $0.50 to $3.50).
This consolidation represents a healthy corrective phase before potential continuation.
📏 **Measured Move Calculation (Short-Term Target):**
📈 **Medium-Term Flagpole Projection:**
Thus, short-term targets lie around **$4.3**, while the mid-term projection reaches **$6.0**.
---
## **3. Ichimoku Cloud Analysis**
| Ichimoku Component | Current Status | Interpretation |
| ----------------------- | ---------------------------- | ---------------------------- |
| **Kumo (Cloud)** | Price trades above the cloud | Strong bullish trend |
| **Tenkan-sen (blue)** | Above Kijun-sen (red) | Positive short-term momentum |
| **Kijun-sen (red)** | Gradually rising | Mid-term trend strengthening |
| **Chikou Span (green)** | Above both price and cloud | Confirms bullish structure |
| **Future Cloud** | Turning green and expanding | Continued uptrend expected |
✅ **Ichimoku Summary:**
The structure remains **bullishly aligned** across both the 4-hour and weekly timeframes, supporting trend continuation.
---
## **4. RSI (Momentum) Analysis**
* **RSI (14):** Approximately **60**
* RSI recently crossed above 60, indicating the onset of bullish momentum.
* A positive divergence is observed between price and RSI lows.
📊 **Interpretation:**
When RSI stabilizes above 60 in the 4-hour timeframe—particularly during a breakout from a symmetrical triangle—it typically precedes **30–40% medium-term rallies** in XRP’s historical data.
---
## **5. Support and Resistance Levels**
| Type | Level (USDT) | Analysis |
| ----------------------------- | ------------ | ----------------------------------- |
| **Key Support 1** | 2.70 | Triangle base + Kijun level |
| **Key Support 2** | 2.35 | Channel bottom |
| **Immediate Resistance** | 3.50 | Upper boundary of triangle |
| **Next Resistance** | 4.30 | Short-term target |
| **Medium-Term Target** | 6.00 – 6.50 | Completion of the flag pattern |
| **Long-Term (Weekly) Target** | 17 – 24 | Extension of the macro bullish wave |
---
## **6. Possible Scenarios**
| Scenario | Activation Condition | Probability | Target |
| ----------------------------- | ----------------------------------- | ----------- | --------------------- |
| **Bullish (Primary)** | Sustained close above $3.20 | 75% | $4.3 → $6.0 |
| **Neutral (Range)** | Consolidation between $2.70 – $3.20 | 20% | No clear trend |
| **Bearish (Low Probability)** | Breakdown below $2.70 | 5% | Pullback toward $2.30 |
---
## **7. Confluence Analysis**
| Indicator | Status | Implication |
| ------------ | ----------------------- | ----------------- |
| Price Action | Breakout confirmed | Bullish |
| Ichimoku | Price above cloud | Bullish |
| RSI | Above 60 | Bullish |
| Trendline | Upward slope maintained | Bullish |
| Volume | Gradually increasing | Confirms momentum |
✅ **Scientific Conclusion:**
All technical indicators and structural elements across multiple timeframes are **mutually supportive of a bullish continuation**.
---
## **8. Final Assessment**
XRP currently exhibits a **valid breakout** from a symmetrical triangle within a strong uptrend.
The scientific multi-layer analysis suggests the following:
* **Strong Support:** $2.70
* **Breakout Zone:** $3.20 – $3.50
* **Next Targets:** $4.3 → $6.0 → $8.5
* **Long-Term Projection:** $18 – $24 (consistent with weekly pattern targets)
---
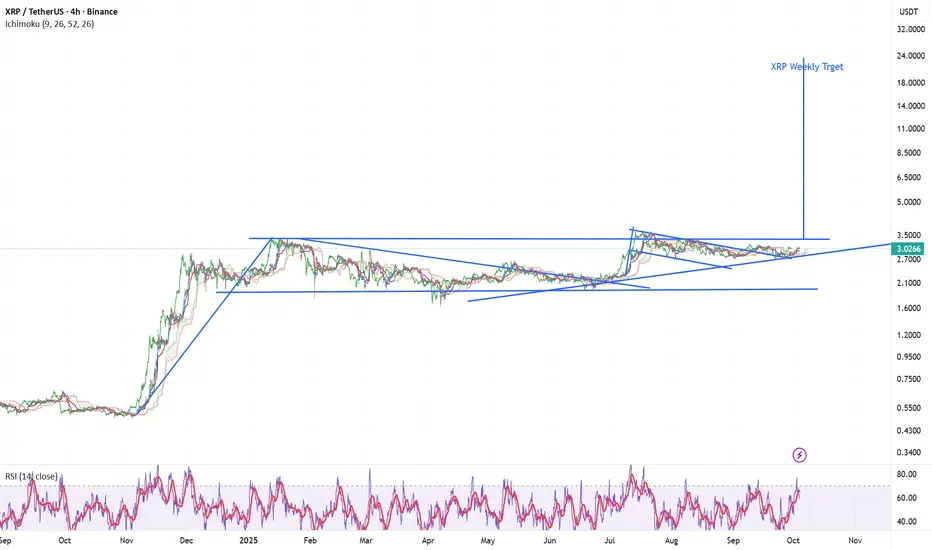
WHAT EVERY HAPPY PERSON SHOULD KNOW #XRP
## 🧩 1. Chart Structure Overview
* **Timeframe:** Weekly (macro perspective)
* **Current Price:** ≈ $3.03
* **Structure Type:** Symmetrical triangle / bull pennant continuation pattern.
* **Major Breakout Zone:** Around **$3.30 – $3.50**
* **Previous Impulse:** From $0.45 → $3.50 (≈ +670%)
* **Current Phase:** Consolidation before potential breakout.
## 🧠 2. Chart Pattern Analysis (Geometric + Measured Move)
### Pattern Type:
* A **bullish pennant** formed after a large upward impulse.
* The flagpole height (approx. $3.00) gives a **measured target**:
➡️ **Scientific projection (using measured move):**
**Target Zone = $11.5 – $13.0**
## ☁️ 3. Ichimoku Cloud Analysis
| Ichimoku Component | Observation | Interpretation |
| ------------------------------------ | ----------------------------- | ------------------------------------- |
| **Kumo (Cloud)** | Price well above future cloud | Strong bullish bias |
| **Tenkan-sen (blue)** | Above Kijun-sen (red) | Short-term bullish alignment |
| **Kijun-sen (red)** | Rising gradually | Mid-term momentum improving |
| **Chikou Span (green lagging line)** | Above price and cloud | Confirms bullish structure |
| **Future Cloud** | Turning green and thickening | Long-term bullish continuation likely |
✅ **Ichimoku Summary:**
XRP remains in a **confirmed bullish environment**, with **trend continuation probable** over the next 3–6 months.
## 📈 4. RSI Analysis (Momentum Oscillator)
* **RSI (14)** ≈ 57 → Neutral-to-bullish range.
* RSI is **forming a higher low** while price consolidates → **bullish divergence**.
* Historically, XRP’s weekly RSI crossing **60–65** has signaled large impulsive waves.
📊 **Momentum interpretation:** The RSI is coiling and may soon break above 60, which typically precedes **multi-week rallies** in XRP.
---
## 🧮 5. Trendline and Support/Resistance Levels
| Type | Level (USDT) | Observation |
| ------------------------ | ------------ | ----------------------------------- |
| **Major Support** | 2.35 – 2.50 | Horizontal + Cloud base |
| **Intermediate Support** | 2.85 | Bullish trendline support |
| **Breakout Resistance** | 3.35 – 3.50 | Pennant resistance |
| **Next Resistance** | 5.20 | Historical weekly close (2021 high) |
| **Macro Target** | 11.5 – 13.0 | Based on measured flagpole |
## 🧭 6. Volume and Wave Context
* The prior uptrend shows **high volume impulse**, followed by **volume contraction** — typical of wave 2 or 4 consolidation.
* The current pennant fits the structure of **Wave 4** in Elliott Wave theory, implying the next move is **Wave 5 extension**, often equal to Wave 1 × 1.618.
🔭 7. Projection Scenarios
| Scenario | Condition | Probability | Target |
| --------------------- | ------------------------ | ----------- | ------------------- |
| **Bullish Breakout** | Weekly close above $3.50 | 70% | $5.0 → $8.0 → $12.0 |
| **Neutral Range** | Stays between $2.6–$3.3 | 20% | Accumulation phase |
| **Bearish Breakdown** | Weekly close below $2.35 | 10% | Drop to $1.80–$1.50 |
## 🧠 8. Summary (Scientific Synthesis)
* **Dominant Pattern:** Bullish pennant on weekly frame
* **Trend Strength:** Positive (confirmed by Ichimoku + RSI)
* **Key Confirmation:** Weekly candle close above **$3.50**
* **Next Resistance Targets:** $5.20 → $8.00 → $12.00
* **Stop Loss for Swing Setup:** Below $2.35
* **Risk/Reward Ratio:** ≈ 1 : 4 (excellent for mid-term)
## 📊 9. Verdict
XRP is **technically preparing for a major continuation wave**, supported by multi-layer evidence:
* Structural pennant pattern
* Ichimoku cloud breakout confirmation
* RSI momentum rebuild
* Wave geometry extension targets between **$8 – $12**
If confirmed by a **weekly close above $3.50**, it would signal the start of XRP’s **next macro impulsive wave** toward its long-term projection zone.

Price Poised for Bullish Flag Surge!$XRP/USDT chart shows an accumulation phase from April to June, followed by a breakout in July. Price is now testing a key zone, acting as support. If it holds, we could see more bullish momentum, especially with the triangle breakout. A break above 3.20 signals further upside.
If not, a retest of lower levels like the accumulation zone is possible. Watch for confirmation at this level.
DYOR, NFA

XRP BUYXRP has being moving within a bullish structure and also has a trend in trends of a inverse head & Shoulders within it.
There is also a clear retest above the diagonal resistance trend-line, so if the candle closes above the trend-line above the retest point(3.0136) then, we expect a huge move upwards all the way to that take profit which is 4.4636.
If you are an aggressive trader, you can enter now.If you are a conservative trader and need an extra confirmation, you can wait until the current candle closes and then enter then.

XRP Price Action – Accumulation Before GrowthXRP is currently navigating a phase defined by liquidity-driven swings and rapid sentiment shifts. After the market endured a heavy decline, buyers have re-emerged, showing resilience through aggressive rebounds. This behavior reflects a deeper pattern: sellers are losing efficiency in driving the market lower, while buyers are treating each dip as an opportunity to accumulate.
In the short term, the market appears to be balancing between two forces — the need for a corrective retracement to secure liquidity, and the desire of participants to push price into higher zones. This tug-of-war often results in shallow pullbacks, where temporary declines are quickly absorbed. Such behavior highlights that speculative capital is rotating back into XRP, aligning with broader risk-on sentiment across digital assets.
If this pattern holds, the near-term trajectory favors gradual expansion, with the asset likely aiming for higher valuations. However, investors should remain aware that short-term corrections are less about trend reversals and more about the mechanics of liquidity collection.

Xrp Update XRP
On Bitget, XRP’s technical summary shows a mix: Buy is slightly favored via moving averages, but oscillators are more neutral to cautious.
Barchart’s technicals indicate XRP is trading below its 20-day MA, with the 50-day MA also above price — a sign that current trend pressure is to the downside.
Investing’s XRP technicals (OKX data) provide detailed buy/sell lineups, suggesting mixed momentum depending on which indicator you lean on.
Insight: XRP is at a crossroads. It faces resistance from the MAs above, and support zones below are now more important. If XRP can muster strength and break past these averages, a push upward is possible, but a failure here may lead to more correction.

XRP OUTLOOK XRP Breaks 1hr resistance , that is a good Bullish signal to go long targeting daily order block

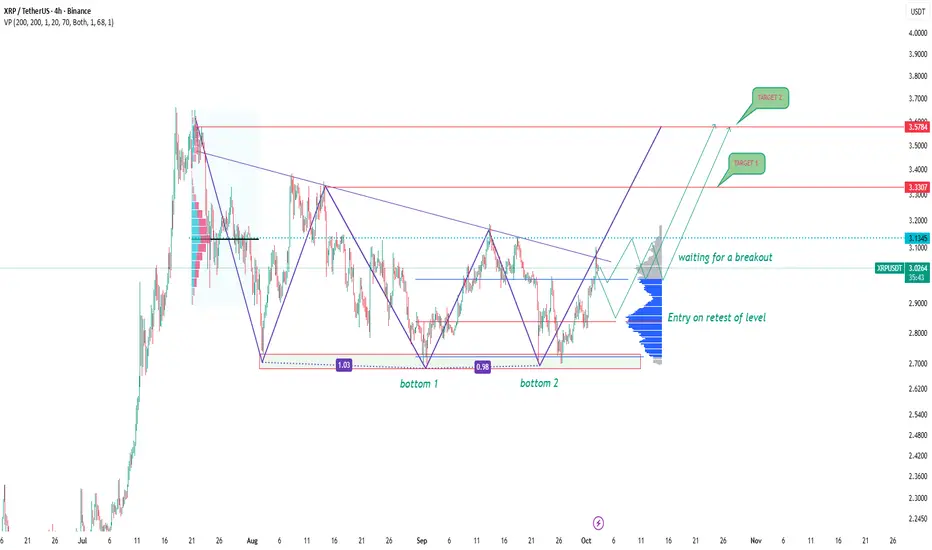
XRPUSDT: double bottom and waiting for a breakoutOn the 4H chart, XRPUSDT is shaping a double bottom around the 1.00 level, and the price is now approaching the key resistance area at 3.14–3.32. A breakout above this zone would be a strong confirmation that the bearish phase is losing momentum.
Technically, the scenario suggests a breakout above 3.14, followed by a retest, and then continuation toward 3.32 and 3.57. This fits the classic pattern where accumulation turns into momentum-driven buying.
From a fundamental perspective, XRP still draws attention thanks to Ripple’s legal battle with the SEC and the use of the token in cross-border transactions. Positive headlines can accelerate the rally, though broader crypto market corrections or regulatory pressure could put the brakes on growth.
This is exactly the kind of setup where expectations and reality may diverge. The structure looks bullish, but without a confirmed breakout, the market can easily roll back. Better to wait for confirmation and trade with discipline.
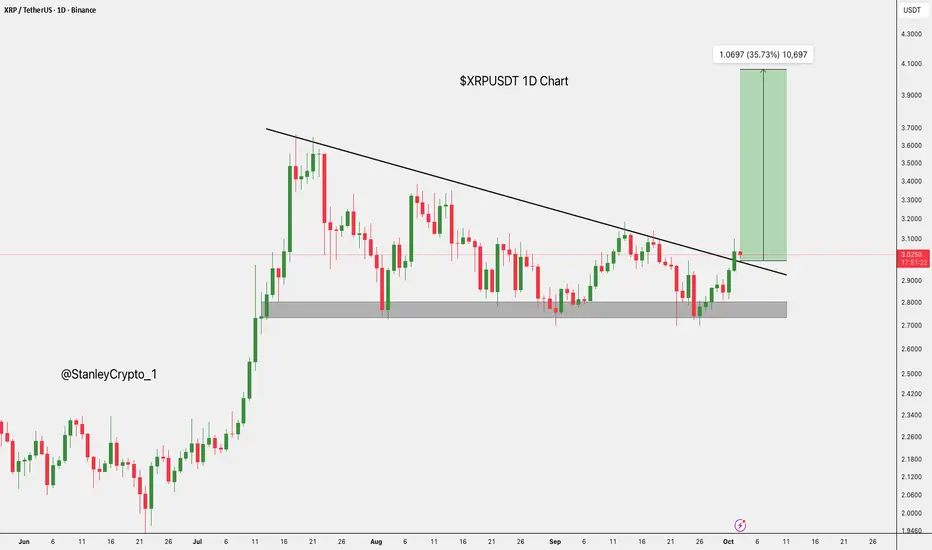
$XRP Breaks Out: 35% Upside Potential Ahead.CRYPTOCAP:XRP has broken above the downtrend, with strong support between $2.70 and $2.85.
If the breakout holds, it could target $4.10, a 35% upside.
Watch for a retest of the breakout zone to confirm further gains.
DYOR, NFA
XRP on the moon!As you can see, the chart's trendline has been broken, as indicated by the shown take profits (TPs).

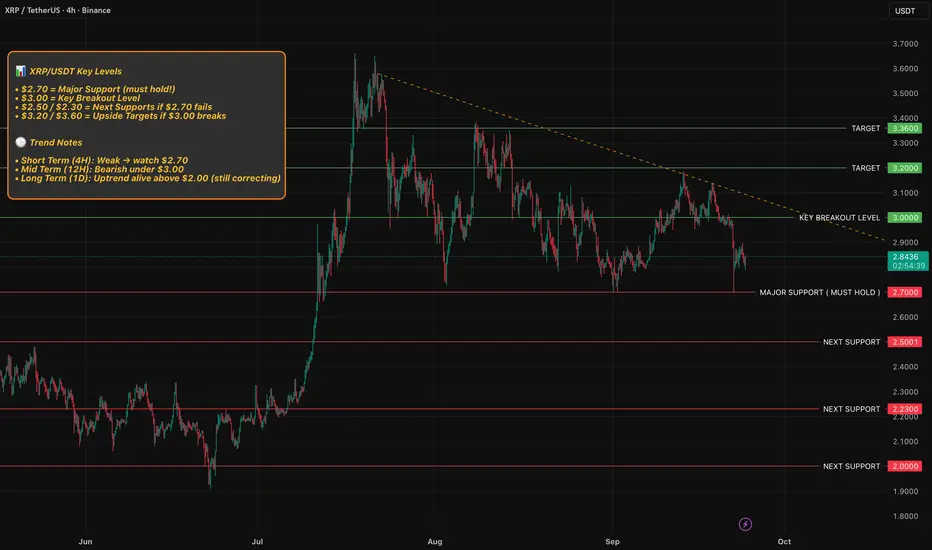
XRP is at a MAJOR decision point !
📊 XRP/USDT Key Levels
• $2.70 = Major Support (must hold!)
• $3.00 = Key Breakout Level
• $2.50 / $2.30 = Next Supports if $2.70 fails
• $3.20 / $3.60 = Upside Targets if $3.00 breaks
🕒 Trend Notes
• Short Term (4H): Weak → watch $2.70
• Mid Term (12H): Bearish under $3.00
• Long Term (1D): Uptrend alive above $2.00 (still correcting)
Thank you for reading my idea, let me know your thoughts and please support by leaving a simple comment as this helps me stay motivated and keep going.
xrp/USDT Technical Outlook📈 XRP / USDT Technical Outlook
Live & Technical Signals:
TipRanks shows XRP’s 20-day EMA and 50-day EMA above current price, giving “Sell” signals on these averages.
Barchart reports that the 5-day MA is ~ 2.891, 20-day ~ 2.945, and 50-day ~ 2.991—price is trading under those, indicating resistance overhead.
Many indicators (RSI, MACD, etc.) on Investing.com are mixed, with a neutral bias overall.
Support & Resistance Zones:
Resistance: ~$3.00 – $3.15
Support: ~$2.70 – $2.80
Below that, a drop toward ~$2.40–$2.50 is possible if support fails
Scenarios to Watch:
🔻 Bearish: A close below $2.70–$2.80 could open the path toward $2.40–$2.50
🔺 Bullish: A decisive break above $3.00–$3.15, especially with volume, could target $3.30+
