Imagine not using SL and losing everything The crypto market saw a major downward push and lot of people lost a lot
So many don't use stop loss when trading
Personally I'll never trade without stop loss
If the market doesn't move your direction and hit your stop loss it's fine
The market will always give you lots of opportunities just find another trade
stop loss is very important
Trade ideas
XRP/USDT – Bullish Breakout With 35% Upside PotentialCRYPTOCAP:XRP on USDT market pair is showing good strength here after finally breaking out of that descending trendline resistance that’s been holding since mid-July (57 days).
We also had a falling wedge breakout and price is now consolidating just above the old resistance, which has flipped into support. That’s usually a strong continuation sign.
The retest around $2.90–$3.00 held up perfectly, lining up with the 100 EMA, which makes that zone solid support.
I’m watching $3.35 and $3.68 as the first targets as long as its above demand zone.
Bigger picture, XRP could stretch toward $4.02 (around +35% from here), which lines up with the mid-range resistance from earlier in the year.
What do you think? Alts season looming?
#XRP #ALTSEASON

Bearish divergence on the 1WLast time XRP experienced such a bearish divergence at 1W, the price dropped to touch the 100 EMA.
This next drop will take a few weeks, coinciding with the dynamics of the markets and Bitcoin.
It will be a good opportunity to take advantage of the next rally to 3.6 and the subsequent ATH.
Enjoy your journey.

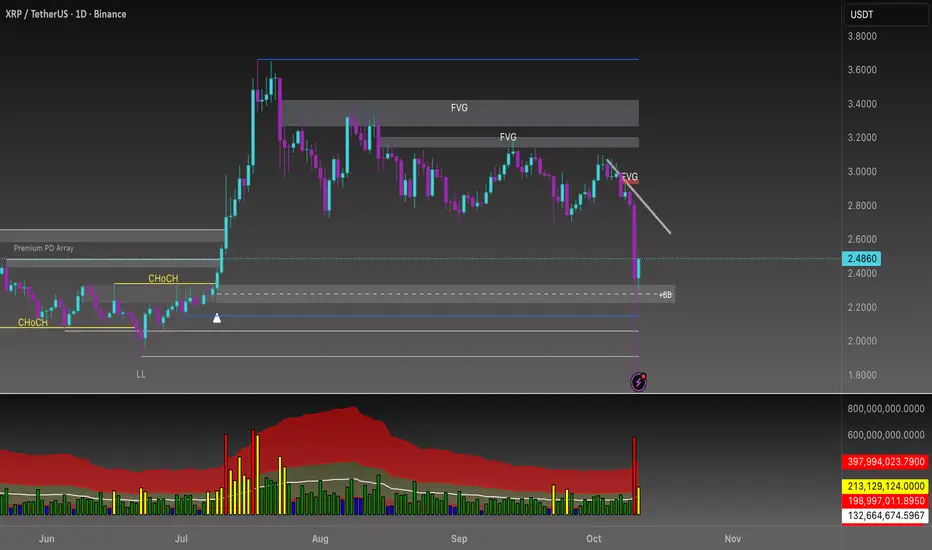
Beyond the Chart - XRP AltCoin Market AnalysisThe trendline I previously drew for BINANCE:XRPUSDT continues to hold strong. 💪
Price has formed a Breaker Block around 2.2900, and I expect a correction toward the trendline 🎯first targeting the 2.7294 area.
XRP’s reaction here will decide the next phase:
• 📈 If a bullish candle closes above the trendline, my next target will be the upper FVG zone.
• 📉 If a bearish candle closes below it, I’ll be watching the 2.3021 area as the next downside target.
Xrp Long/Buys I bought Xrp in spot first at 2.3000 at Trendline break. Than at 2.7000 when it rejected support at daily timeframe. Now there’s a resistance Trendline if it breaks on daily you can buy on spot.
Targets are given on chart and I’m expecting Xrp to go and tap 5.000 in future , advising to buy on spot.

XRP back to realityOne of the worst shitcoins of them all, short it, avoid it, whatever you do don't buy at least in a year.
GL

XRP Long to 3.40s I like the recapture on XRP relative to the POC on the volume profile. I like how it is congruent with emas. Looks pretty strong.
Want to see it recapture 3.02 or the POC successfully, and not fail a retest. Afterward im long to 3.40 where I'd trim and then add more on a pullback.
That area of the recent impulse is low in volume, more business to be done there IMO.
Could even add into the position on the retest of the existing POC.
This trade idea invalidates if it trades below 2.80 and cant reclaim paired with high volume. If that occurs I'd favor trading the lower thin profile and do business there. Not willing to get short, only willing to buy currently. This includes trading into 2.30s to 2.40s.
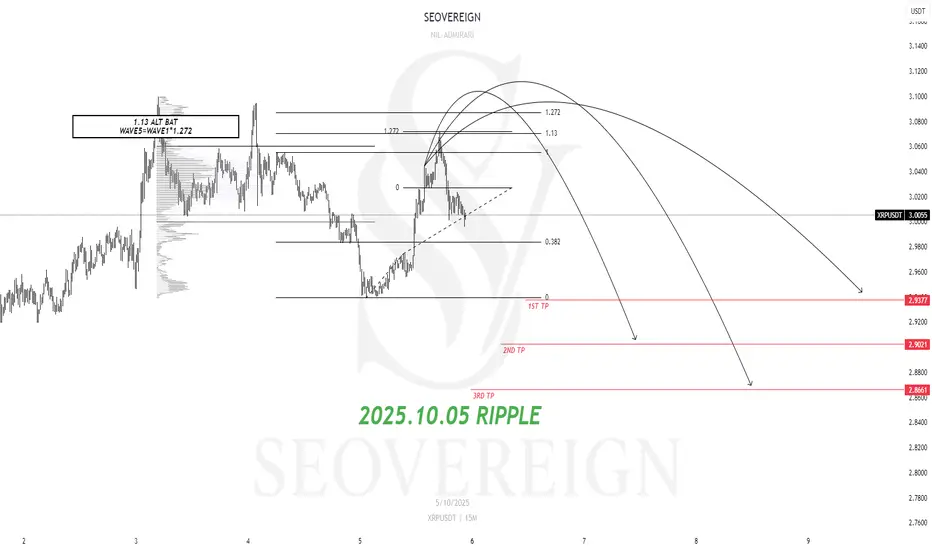
[SeoVereign] RIPPLE BEARISH Outlook – October 05, 2025Hello everyone,
I hope you are all having a peaceful day.
Today, I am writing to share my bearish (short) outlook on XRP as of October 5th.
The rationale is as follows.
The 1.13 Alternate Bat (ALT BAT) pattern is a harmonic variation that places the PRZ (Potential Reversal Zone) at the 1.13XA level—an extension beyond the conventional Bat pattern. This zone represents an area where price has likely become overextended, increasing the probability of a corrective reversal. It is generally recognized as a region where strong reversal signals tend to emerge.
In addition, WAVE5 = WAVE1 × 1.272 indicates an “extended fifth wave” in Elliott Wave Theory, suggesting that the final wave often terminates around the 1.272 extension level. This structure frequently appears near the end of an overheated market phase, just before the trend shifts direction.
When these two signals coincide or align closely in price, the area can be interpreted as a strong reversal confluence, where the harmonic PRZ and wave extension target overlap.
Accordingly, the average target is set at 2.90USDT.
As price action unfolds, I will provide updates on position management within this idea.
Thank you for reading.
XRP Daily – Can the 0.236 Fib Hold Again?XRP Daily – Testing Support at the 0.236 Fib Level
XRP is once again trading in the green support area that has held since the beginning of August.
This zone aligns with the 0.236 Fibonacci level and forms the base of a descending triangle, with the series of lower highs creating its upper boundary.
Price has also lost the 50MA, and from a system perspective, the structure confirms a short-term downtrend, with Price < MLR < SMA < BBcenter.
If this triangle breaks to the downside, the next significant support sits at the 200MA at $2.60.
Momentum indicators remain weak:
RSI is below its moving average and trending downward, while MACD has already turned red, showing fading strength.
With the broader market showing signs of consolidation after BTC ATH,
XRP reaction here could reveal how altcoins handle pressure at key supports.
For now, this support zone remains key; losing it would confirm a bearish breakout from the triangle pattern.
Bias: Short-term bearish, watching the 0.236 Fib and 200MA as critical levels for reaction.
Always take profits and manage risk.
Interaction is welcome.

XRPUSDTBased on the XRP/USDT chart, the price is moving in a bearish direction. If the price breaks below the blue trendline, it could drop to around $2.60. However, if the support holds, the price may rebound toward $2.90.

Did BTC Just Confirm the Move I’ve Been Warning AboutIn the last few videos, we called it perfectly — Bitcoin took out its all-time high, swept the previous week’s high, and now things are getting very interesting.
This move was expected, but what happens next could change everything…
In this video, I break down:
BTC structure and why this next phase is critical
Total Market Cap and what it’s telling us about overall sentiment
ETH showing signs of weakness
My XRP short still running strong (now +180%)
How this setup could lead to the next major move across the crypto market
We might still see one more push higher, but the bigger picture hasn’t changed — patience, risk management, and understanding structure are everything right now.
As always, this isn’t financial advice — it’s about learning to see the market for what it really is, not what we want it to be.

XRP Holds Strong Support – Possible Rebound AheadXRP Holds Strong Support – Possible Rebound Ahead
XRP is currently testing a major support zone around 2.70, which has already held strong several times in the past (as shown by the previous reactions in early September and late September).
As long as the price stays above this support, there’s a good chance for a bullish rebound.
If buyers step in, XRP could start moving higher toward the next resistance levels.
Key Targets:
2.97
3.13
3.30
For now, the support zone remains key, and the market needs to confirm a rebound before a stronger move begins. Considering that BTC can rise further, the chances of the next upward move may increase further.
You may find more details in the chart!
Thank you and Good Luck!
❤️PS: Please support with a like or comment if you find this analysis useful for your trading day❤️

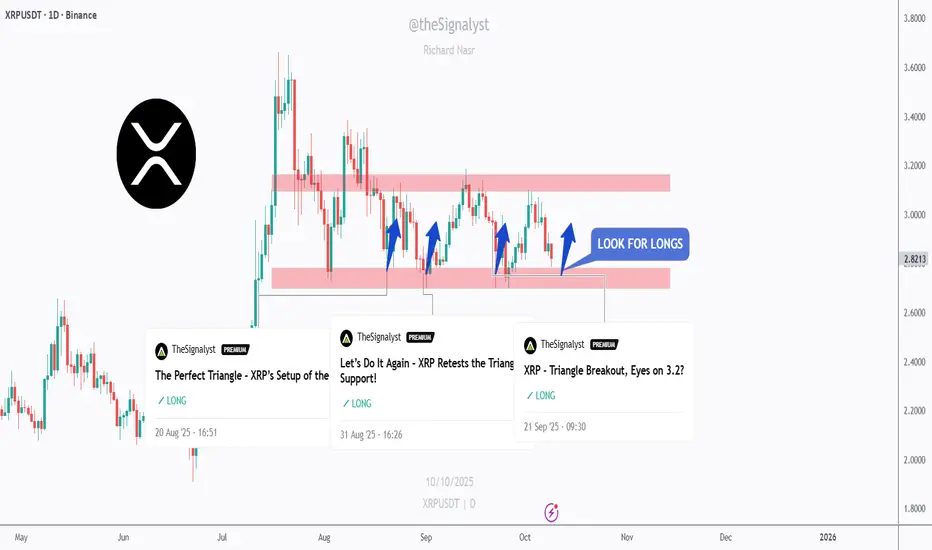
$XRP – Let’s Do It Again!!XRP is once again retesting its daily support zone around $2.60–$2.80, the same level that triggered multiple bullish impulses in recent months.
As long as this red support zone holds, I’ll keep looking for long setups targeting the $3.10–$3.20 supply area.
A daily close below $2.60 would invalidate the setup and shift focus toward the $2.30 support before any potential rebound.
It’s the same play, same level, and the same structure. Let’s see if XRP delivers again! 💪
⚠️ Disclaimer: This is not financial advice. Always do your own research and manage risk properly.
📚 Stick to your trading plan regarding entries, risk, and management.
Good luck! 🍀
All Strategies Are Good; If Managed Properly!
~Richard Nasr
XRP Analysis🚨 CRYPTOCAP:XRP Analysis 🚨
There are equal lows (DOL) sitting near the previous week’s low — liquidity waiting to be swept 👀
📉 I’m expecting a sweep there, with two bullish Order Blocks resting below.
Will wait for confirmation to long once price taps into those OBs✅

XRP Update📊 CRYPTOCAP:XRP Update
CRYPTOCAP:XRP is testing the red resistance zone 🔴
If it breaks out, the first target will be the green line level 🟢

A Massive Altcoin Explosion Is ComingAltcoins are on the verge of a huge surge, and market moves will be fast.
If you want to catch this opportunity before everyone else, this guide is for you.
The tools and strategies below will help you make smarter trading decisions.
Hello✌️
Spend 2 minutes ⏰ reading this educational material.
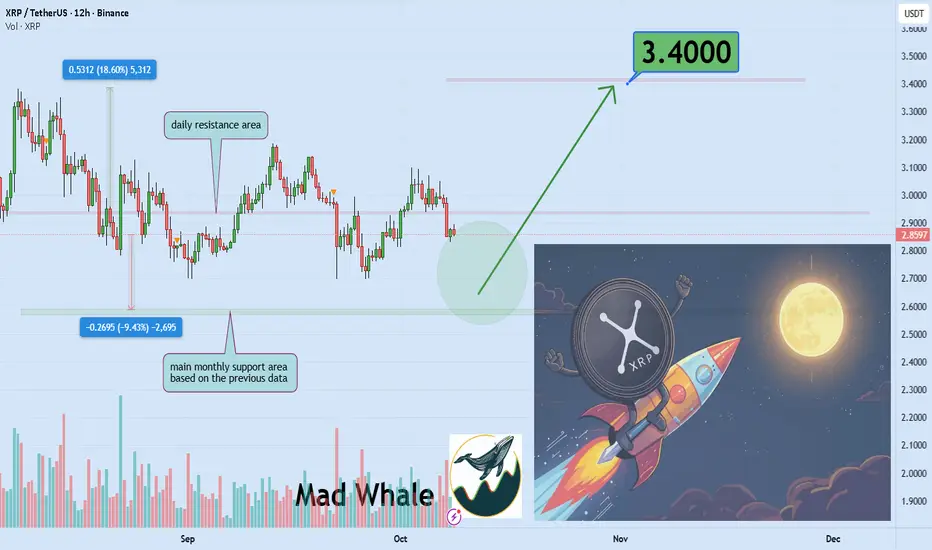
🎯 Analytical Insight on Ripple:
BINANCE:XRPUSDT is approaching a critical monthly support zone, backed by strong market volume. If this level holds, XRP could potentially rally 18% toward the $3.40 target, signaling renewed bullish momentum. 📈🚀
Now , let's dive into the educational section,
🔥 Explosive Altcoin Trends
Altcoin trading volumes have spiked unusually high.
High volumes often signal upcoming explosive moves.
Fear and greed play a central role in rapid price changes.
FOMO drives impulsive buying and fast market waves.
Whale movements can steer the market in their favor.
Short squeezes are ready to trigger in some altcoins.
💹 Market Psychology
Collective trader behavior moves prices unexpectedly.
Spotting areas where most traders are emotionally influenced is key.
Fear leads to panic selling, greed to impulsive buying.
Professional traders use market psychology to anticipate moves.
Understanding this psychology helps prevent major mistakes.
📈 Profitable Opportunities
Strong support zones highlight safe entry points.
Combining technical analysis with indicators improves decision accuracy.
Staggered entries and risk management reduce psychological pressure.
Short-term profit targets increase the chance to capitalize quickly.
Smaller altcoins can also create explosive waves.
Checking potential breakout zones before entry is essential.
🛠 TradingView Tools & Indicators
Volume Profile
Shows where liquidity is concentrated.
Helps identify strong support and resistance areas.
RSI
Highlights overbought and oversold conditions.
Signals the right time to enter or exit trades.
MACD
Indicates main trends and potential reversals.
Combining these three tools makes your analysis professional and reliable.
Even beginners can make better decisions by following these indicators.
Advanced traders can improve precision using multiple timeframes.
📝 Summary
Altcoins are ready to surge, and market psychology is the key.
Using TradingView tools and managing emotions is the best strategy.
Smart entry and risk management prepare you to seize explosive opportunities.
💡Key Trading Recommendations
Check trading volumes and potential breakout zones before entering.
Control your emotions and avoid impulsive decisions.
Use multiple indicators together to anticipate market moves.
🌟 Golden Opportunity to Level Up
Continuous practice with indicators and market psychology prepares you for explosive altcoin waves.
✨ Need a little love!
We pour love into every post your support keeps us inspired! 💛 Don’t be shy, we’d love to hear from you on comments. Big thanks, Mad Whale 🐋
📜Please make sure to do your own research before investing, and review the disclaimer provided at the end of each post
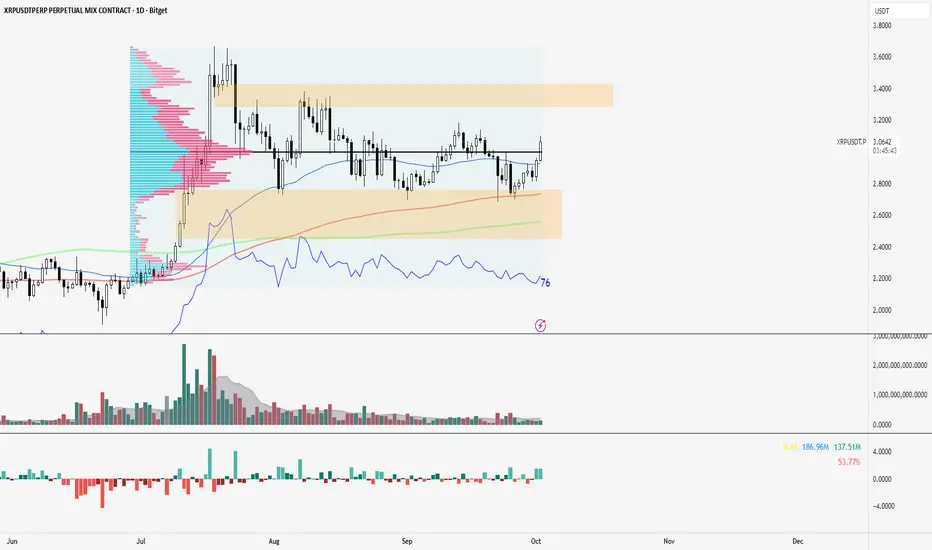
Beyond the Chart - XRP AltCoin Market Analysis 🚀 BINANCE:XRPUSDT XRP/USD AltCoin Market 🚀
XRP stuck between ⚙️ Accumulation ($2.80–$2.85) and 💰 Distribution ($3.00–$3.10) zones.
Descending triangle 🔻 hinting possible breakdown if $2.80 fails — eyes on $2.65 next.
But a clean breakout + hold above $3.05 could flip bias bullish → $3.20–$3.40 🟢
🌐 Macro View:
ETF delays 🏦 + U.S. shutdown ⚠️ keep pressure on alts.
Still, crypto inflows 💸 remain strong — extreme negativity could fuel a contrarian bounce.
🎯 Setups
📈 Long: Breakout + retest above $3.05 → 🎯 $3.20 / $3.40
📉 Short: Breakdown below $2.80 or rejection from $3.05 → 🎯 $2.70 / $2.55
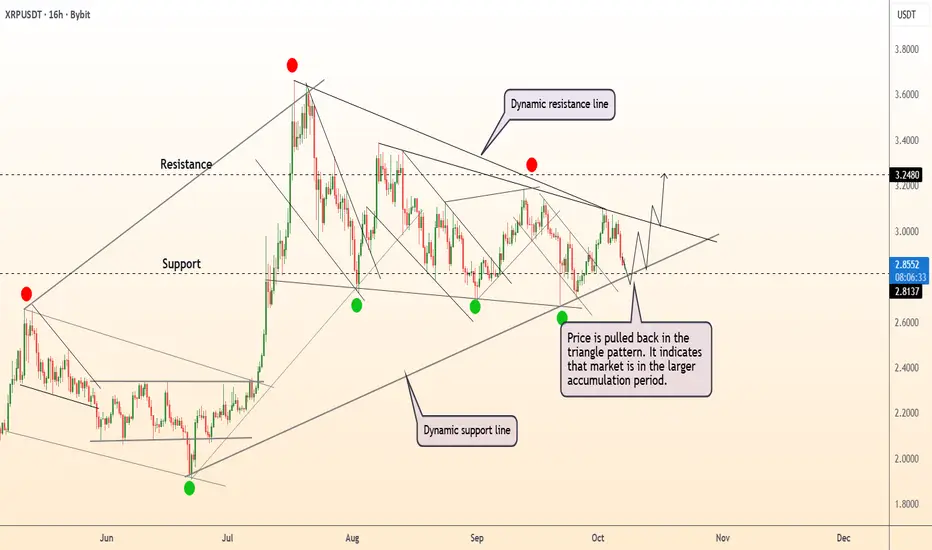
DeGRAM | XRPUSD is testing the support level📊 Technical Analysis
● XRP/USD is consolidating within a symmetrical triangle, showing a sequence of higher lows near the dynamic support line — a sign of steady accumulation. A breakout above $2.85–$2.90 would confirm bullish continuation toward the $3.25 resistance.
● The overall structure indicates a contracting phase within a larger bullish setup, with price respecting the long-term rising trendline since May.
💡 Fundamental Analysis
● Ripple’s ongoing expansion into cross-border settlements and improving market sentiment for altcoins support accumulation before potential breakout.
✨ Summary
● Accumulation inside triangle; breakout above $2.90 could target $3.25. Structure and fundamentals favor mid-term bullish momentum.
-------------------
Share your opinion in the comments and support the idea with a like. Thanks for your support!
Is BTC going to nuke?!Once again, the analysis played out perfectly — Bitcoin took out its all-time high, swept the previous week’s high, and now we could be setting up for a major drop.
In this video, I break down:
- Why I believe BTC could nuke from here
- The possibility of one last push up toward 128K before the drop
- ETH structure showing clear signs of weakness
- Total Market Cap forecast
- What this means for ALTs
- My XRP short still running — currently +140%
We could get one more fake move to the upside, but overall, I’m preparing for what could be a major correction. Stay patient and don’t get trapped chasing green candles.
#Crypto #Bitcoin #BTC #ETH #XRP #CryptoMarketUpdate #ICTTrading #Altcoins #CryptoAnalysis #BitcoinCrash

Buy XRPUSDT NowThe pair XRPUSDT has moved to a key zone and it is aligned with my buy idea. I am sure XRP will rise to $3.1500 soon.

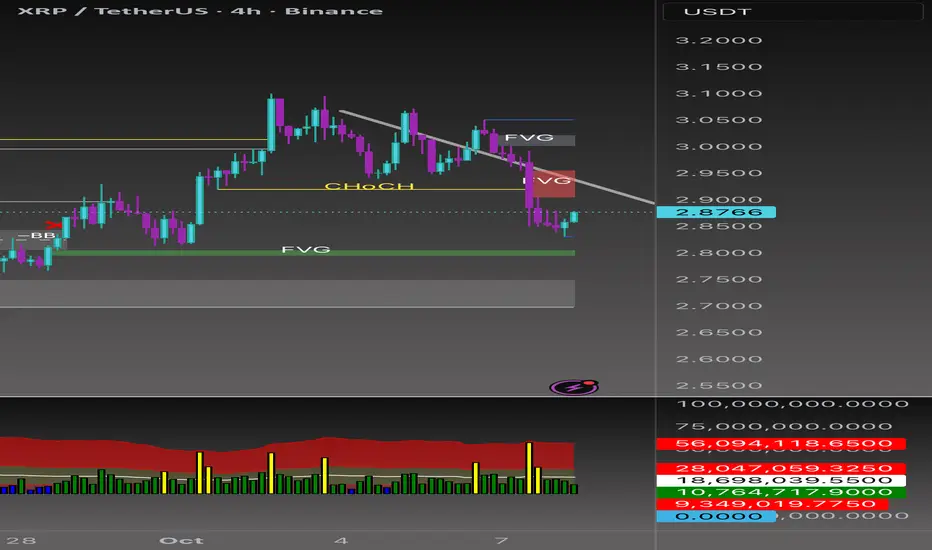
XRPUSDT Flow Map| Price In Bearish SentimentHi there,
XRPUSDT is bearish on the H1 timeframe. The current price is reacting bearishly against the resistance line at 2.9929, with strong bearish pressure at the 3.0102 resistance line. The price has reached the H4 trendline and is breaking it.
The trendline is supported by the H4 support line, but it will not hold due to the bearish high on September 24. The break of the trendline will trigger a move down to the 2.9029 target area and extend to the open area at 2.8500, driven by the dominant bearish pressure from the H4 bearish trendline.
Additionally, the RSI is in a bearish zone at 39.47, below its EMA, which is also decisively bearish at 48.13.
Happy Trading,
K.
_
Not trading advice

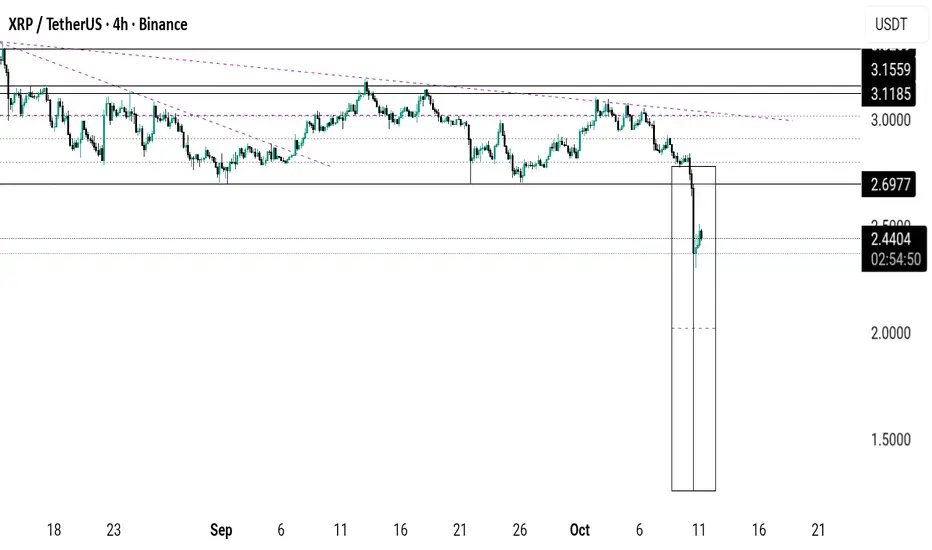
XRP - 20% move is COMING!! BIG OI rise!!XRP - 20% move is COMING!! BIG OI rise!!
open interest increased by 154m Xrp coins
many times fater such thing price did significant move
in a case of break donw it could reach 2.4

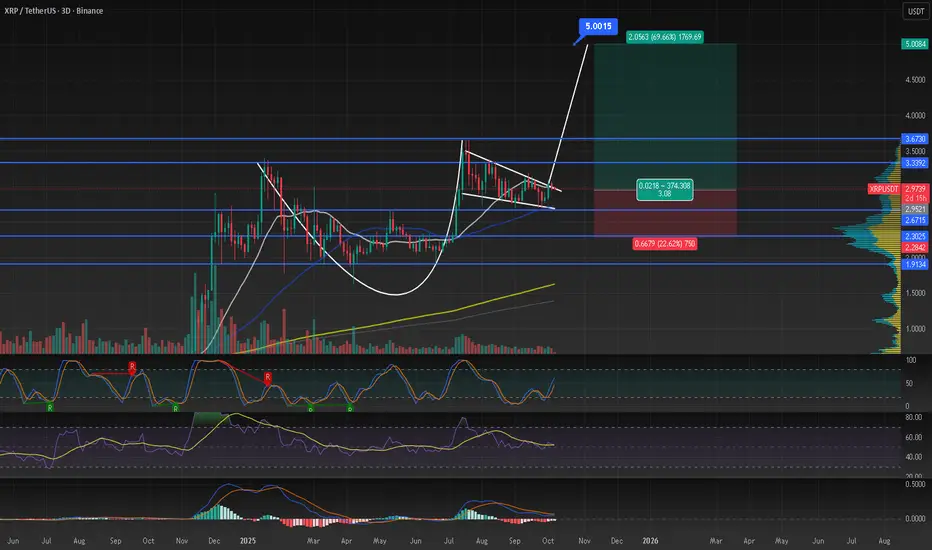
xrp cup and handle to $5cup and handle on the 3d tf
trying to break out the falling wedge
rsi is curving up
as long we dont lose 2.6 we could continue to the upside
lets see, time will tell
I am long and you?