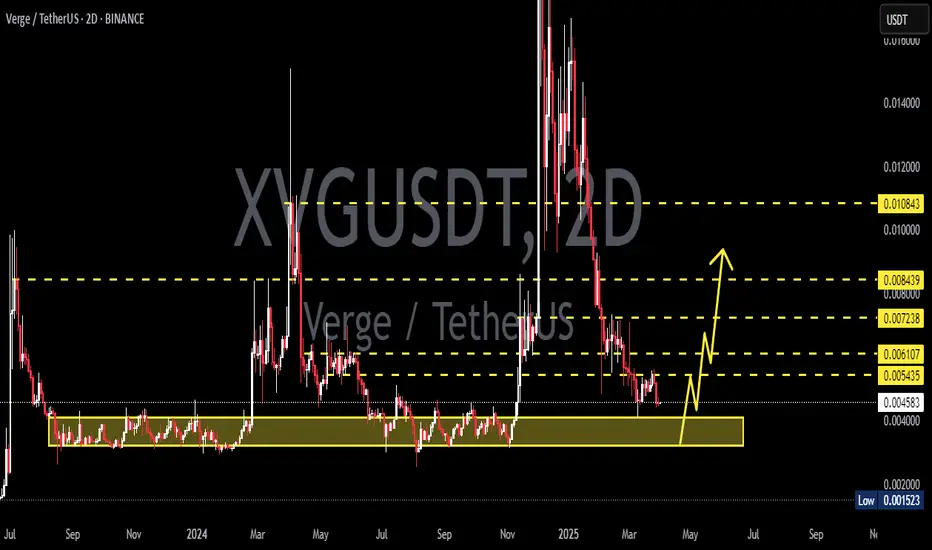
XVGUSDT 2DXVG ~ 2D Analysis
#XVG Buy gradually from here with a short -term target of at least 15%+. This is the previous accumulation area.
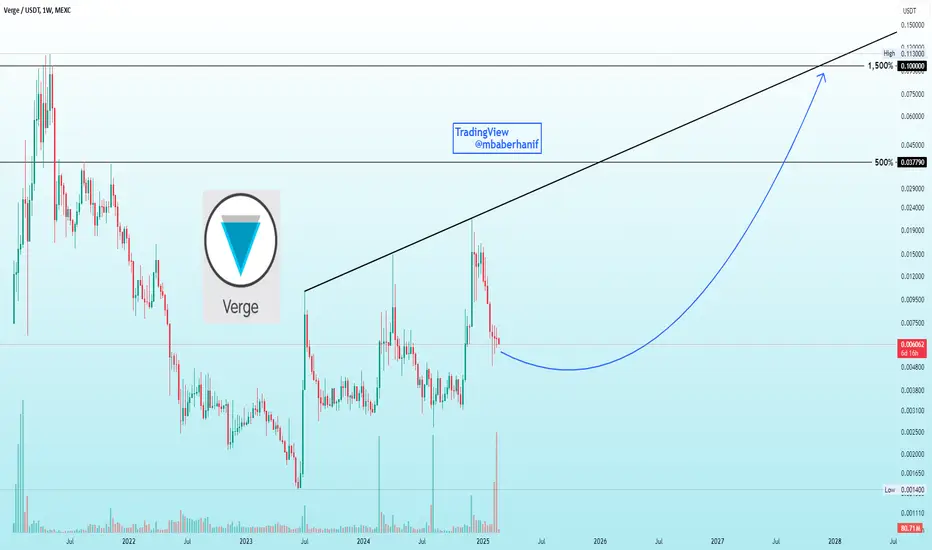
XVG | Will this coin skyrocket 500% to 1,500%?Hey everyone! If you missed OM Coin, which saw more then 36,500% increase in value over the course of a year – trading at $0.025 in December 2023 and recently reaching a high of around $9.17- this is an example of such huge gains. Some people thought it was impossible in 2023, but it already happene
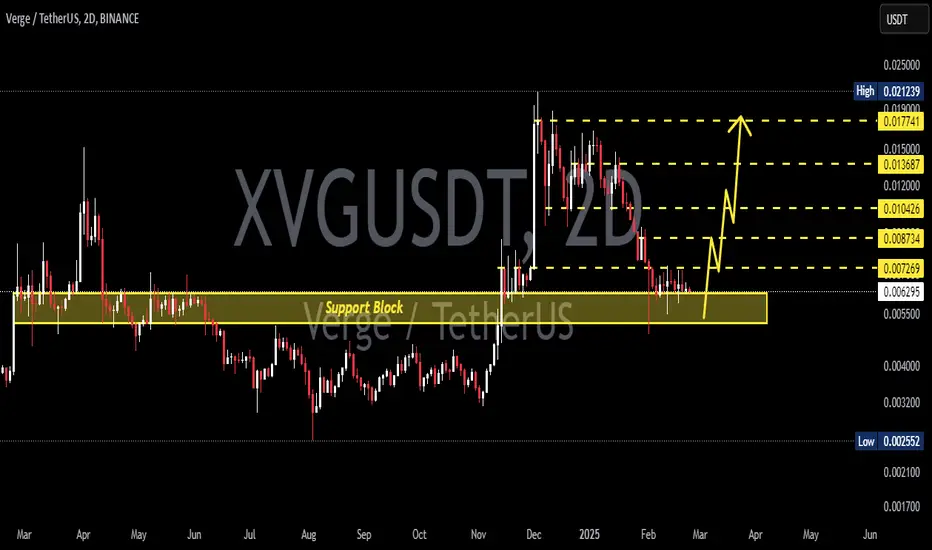
XVGUSDT 2DXVG ~ 2D Analysis
#XVG Support blocks that you might be able to consider to start buying back from here. with a minimum target of 15%+
Verge: Highest Volume EverOn the 19th of February XVGUSDT produced the highest volume ever on the daily timeframe.
See chart below:
This occurrence can signal the start of a new market phase.
Good afternoon my fellow trader....
Here we can see a consolidation channel that is more than two years long. Each time this chann

XVG - on the "VERGE" of breaking out!Hello TradingView Family / Fellow Traders. This is Richard, also known as theSignalyst.
📈 XVG has been in a correction phase trading within the falling blue channels.
🏹As XVG approaches the lower bound of the channels, which lines up perfectly with the demand zone marked in red, it would be an a

Xvg : verge : is on the verge of breaking higherXvg has formed a nice channel to the downside.
I think she will pump hard.
Time for her to get back at 10 cents .
Soon all time highs , it is the year of OGs.
She will follow xrp.

#XVG/USDT Analysis 📈 #XVG/USDT Analysis 📈
SGX:XVG is holding strong at the 4H bullish Order Block and showing potential for a long entry.
📌 Resistance: PWH $0.014538

XVG/USDTKey Level Zone: 0.013030 - 0.013460
HMT v4.1 detected. The setup looks promising, supported by a previous upward/downward trend with increasing volume and momentum, presenting an excellent reward-to-risk opportunity.
HMT (High Momentum Trending):
HMT is based on trend, momentum, volume, and market

Prepare to BUY Spot XVGUSDT (D1 Cycle)
🌟 XVGUSDT is entering a new D1 cycle – A great opportunity for short-to-mid-term gains! 🌟
🌍 Market Overview:
XVGUSDT is showing strong bullish potential on the D1 timeframe. This creates a strategic entry to capitalize on the upward movement once the bottom is confirmed.
📊 Trade Plan:
📌 Entry

*XVG* IS AWESOMEhello friends
This token has been modified after hitting a higher ceiling.
Now we can buy step by step with capital and risk management and move to the goals we specified.
*Trade safely with us*

See all ideas
Summarizing what the indicators are suggesting.
Oscillators
Neutral
SellBuy
Strong sellStrong buy
Strong sellSellNeutralBuyStrong buy
Oscillators
Neutral
SellBuy
Strong sellStrong buy
Strong sellSellNeutralBuyStrong buy
Summary
Neutral
SellBuy
Strong sellStrong buy
Strong sellSellNeutralBuyStrong buy
Summary
Neutral
SellBuy
Strong sellStrong buy
Strong sellSellNeutralBuyStrong buy
Summary
Neutral
SellBuy
Strong sellStrong buy
Strong sellSellNeutralBuyStrong buy
Moving Averages
Neutral
SellBuy
Strong sellStrong buy
Strong sellSellNeutralBuyStrong buy
Moving Averages
Neutral
SellBuy
Strong sellStrong buy
Strong sellSellNeutralBuyStrong buy
Displays a symbol's price movements over previous years to identify recurring trends.