XVG/USDTOver 323days formed huge classic box text book pattern indicating strong zone we can see final shakeout its time for reversal targeting 200% for this structure
Market insights

XVGUSDT BUYXVGUSDT – 1D | Range → Expansion Cycle, Swing Plan with Targets
XVG has been respecting a very clear “range → expansion” behaviour on the daily chart.
Each time price spends a long period inside a horizontal range, it is followed by a sharp vertical expansion leg. The previous cycles are marked on the chart, and the current structure is again trading inside a similar range.
As long as price holds above the current range low, my bias is for one more expansion from this base.
Swing idea from the current range
Entry zone: around 0.0061 – inside the range and above the local demand/OB.
Invalidation (SL): below 0.0047 – a clean daily break under this level means the range support has failed and the idea is invalid.
Risk from entry ≈ -22%.
First target (TP1): 0.0087 – retest of the range high / first liquidity pocket.
Reward from entry ≈ +40%, giving roughly 1 : 1.8 R:R.
If the market repeats previous “range → expansion” cycles and macro conditions stay supportive, I am looking at the following higher-timeframe expansion targets:
TP2 – “NEXT” level: 0.0293 – major HTF supply zone from the last impulsive sell-off and a logical area to secure large profits if an expansion starts.
TP3 – final extension: 0.0374 – upper resistance and full measured-move objective for a complete range expansion.
These levels are scenario targets, not guarantees. I will reassess the structure at each target and adjust risk accordingly. This is a personal trading plan, shared for educational purposes only and not financial advice.

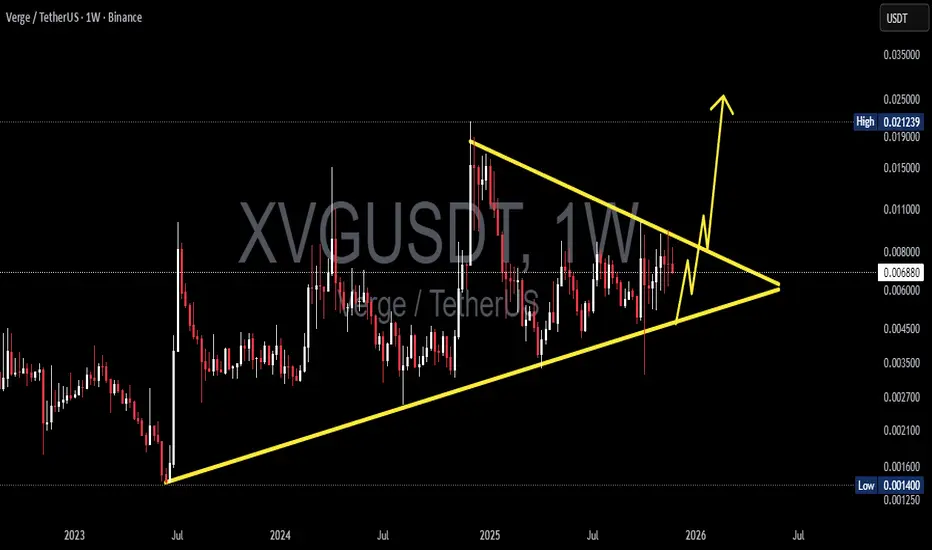
XVG/USDT — Symmetrical Triangle Nearing Breakout?XVG is approaching one of its most critical technical moments in the last two years. Price has been compressing inside a large Symmetrical Triangle since mid-2023, defined by:
1. Higher Lows showing steady accumulation from smart money, and
2. Lower Highs showing persistent supply pressure.
Both trendlines are now converging tightly into the Apex, creating a classic volatility squeeze — a condition where markets typically unleash a powerful breakout or breakdown once the compression phase is complete.
For XVG specifically, this setup is rare and historically tends to result in explosive volatility.
In short:
The next move could define XVG’s direction for months ahead.
---
Pattern Explanation
The Symmetrical Triangle on the Weekly chart signals a buildup of energy.
Shrinking volume + tightening candle range = compression before expansion.
This type of pattern often ends with a sharp directional move, not a gradual drift.
XVG rarely forms long-term triangles, making this squeeze even more significant.
This is a classic “calm before the storm” structure.
---
Bullish Scenario (If Breakout Occurs)
A bullish continuation will be confirmed if XVG closes a weekly candle above the upper trendline.
1. Bullish Trigger
Weekly close above 0.0075–0.0080
noticeable volume increase.
2. Follow-Through
A retest of the broken trendline turning into support strengthens the breakout.
3. Bullish Targets
Target 1: 0.011 – 0.015 → historical resistance
Target 2: 0.020 → psychological supply zone
Target 3 (Measured Move): 0.026 – 0.028
If fully realized, the upside potential ranges from +150% to +300%.
---
Bearish Scenario (If Breakdown Happens)
Weekly close below 0.0040–0.0045 triggers the bearish case.
1. Bearish Trigger
Breakdown + selling volume spike.
2. Bearish Targets
Target 1: 0.0030 → minor support
Target 2: 0.0014 → historical bottom
A breakdown would send XVG back into deep-discount territory, though so far the structure shows stronger bullish pressure via consistent higher lows.
---
Overall Summary
XVG is entering the final stage of a 2-year compression pattern. With almost no room left inside the triangle, the market is preparing for a decisive breakout or breakdown.
Historically, when XVG reaches this kind of pattern maturity, the move that follows tends to be fast, aggressive, and highly directional.
The next 1–2 weekly candles could shape the trend all the way into 2026.
#XVGUSDT #XVG #Verge #CryptoBreakout #TrianglePattern #VolatilitySqueeze #PriceAction #WeeklyChart #AltcoinAnalysis #CryptoTechnicalAnalysis
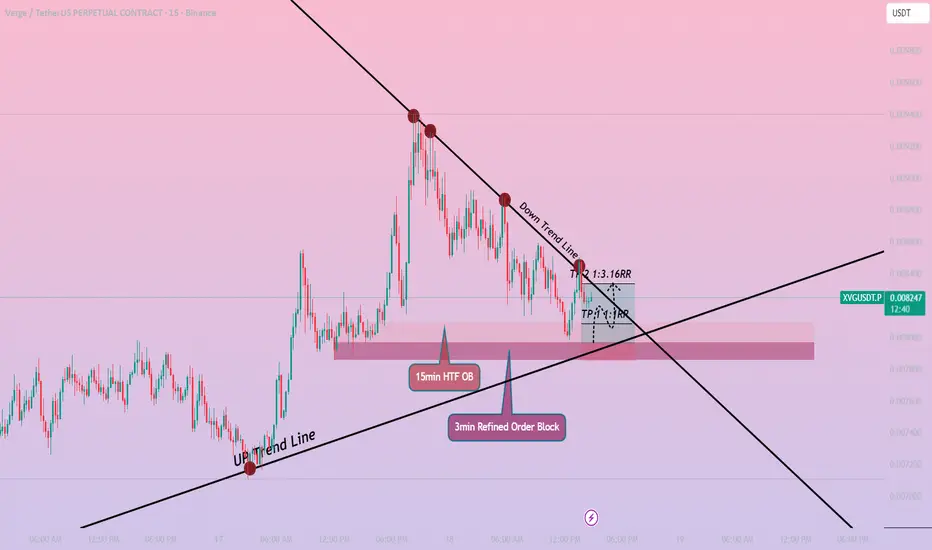
XVG/USDT Analysis using Trendlines and OB'sIn this XVG/USDT setup, the market is showing a clear HTF bullish structure on the 15-minute timeframe, while the LTF (3-minute) is still in a corrective downtrend. This type of HTF–LTF mismatch usually indicates that the market is searching for liquidity before aligning back with the major trend.
To understand the direction more accurately, I combined Price Action and SMC, especially focusing on order blocks, trend shifts, and liquidity sweeps.
HTF (15m) Analysis
Price is still respecting bullish structure.
The last valid 15m demand/Order Block lies between 0.008095 – 0.007851.
Market recently tapped into this range, indicating potential accumulation and a high chance of a continuation move to the upside.
LTF (3m) Analysis
3m trend is currently in a controlled downtrend, forming clean impulsive and corrective legs.
A refined 3m OB is identified between 0.007968 – 0.007851.
This refined OB aligns perfectly with the deeper 15m OB, giving a high-probability confluence zone.
If this zone holds, a bullish shift on LTF is expected.
Trade Plan
I entered based on the expectation that price will shift bullish after filling the 3m OB and aligning with the 15m HTF trend.
Entry: 0.007967
Stop Loss: 0.007851
TP 1: 0.008084 (1:1 RR)
TP 2: 0.008334 (1:3.16 RR)
Verge · XVG Market LookVerge BINANCE:XVGUSDT is now pressing into a big resistance zone that has stopped price for more than two years. The trendline under the price keeps rising, and that means buyers are getting stronger. Sellers in that zone look weaker. Volume is also picking up, which usually shows interest before a big rally.
This setup is ascending triangle. If XVG closes a weekly candle above the full resistance block with strong volume, the next move can be fast because there is not much supply sitting above that level.
For now, the chart is squeezing tighter and the demand zone keeps holding. These signs often show that a breakout is getting closer.
If you follow a basic plan, it is easy. Wait for a clean close above resistance. No guesswork. No rushing in early. Get in when you have confirmation.
TheCryptoFire

XVGUSDT Analysis — Ready for a Spot Buy👋 Welcome to TradeCityPro!
Let’s move on to the analysis of XVG, another privacy-focused coin similar to XMR, and take a closer look at its current market structure.
🌐 Overview of Bitcoin
Before starting the analysis, let me remind you once again that we’ve moved the Bitcoin analysis section to a dedicated daily report at your request — allowing us to discuss Bitcoin’s trend, dominance, and overall market sentiment in greater detail each day.
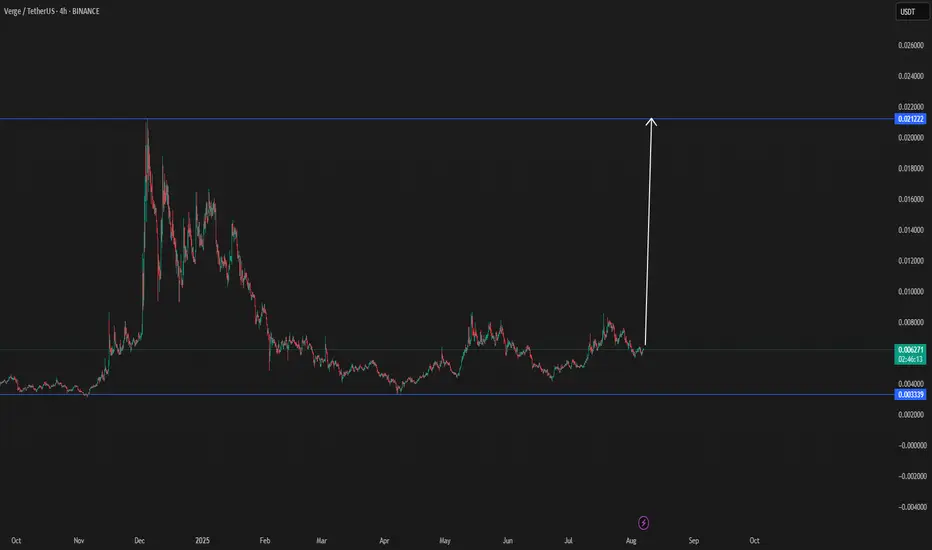
In the weekly timeframe, price was heavily rejected from 0.034978, falling all the way down to 0.001, marking a massive 90% correction.
However, in the new calendar year, the market has consistently formed higher lows compared to the previous year, and price is currently oscillating around a solid weekly trendline.
For a spot buy, our trigger is completely clear:
After the breakout of 0.008828, we can enter the position and target 0.0152, following the bullish move.
Our risky stop-loss is currently set at 0.004460, while the safer, more reliable stop-loss level is 0.003247.
📝 Final Thoughts
Stay calm, trade wisely, and let's capture the market's best opportunities!
This analysis reflects our opinions and is not financial advice.

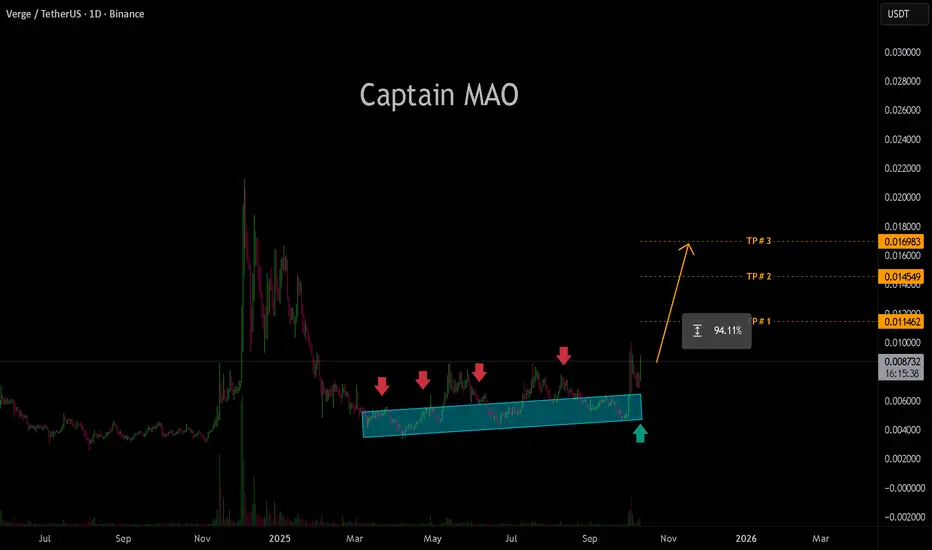
#XVG — Third catch from the same zone! 5-2025XVG is hovering near i t $0.0049. A hold above this could lead to potential targets at $0.008 and $0.012. Our last two trades in XVG delivered around +250% / 350% profits, so it's worth keeping a close watch. The main support to monitor is $0.0029.
2-2024
9-2024
When we recommend adding a coin to your watchlist, it's typically due to forming a pattern, nearing a historical bottom, or approaching a strong support level. It may also show increased trading volume, reversal candles, or be in an accumulation stage. While we haven't observed a bullish reaction yet, we advise monitoring it until an optimal entry point emerges.
PS:
We avoid trading coins associated with gambling, prostitution, human trafficking, etc.
Note:
This is not financial advice but an analysis of coin movements. Conduct your own research and practice risk management before making any investment decisions. Remember, the cryptocurrency market carries significant volatility and risks.
Best wishes to all,
we ask Allah reconcile and repay.

Xvg bullish She will be the one to start this alt season.
No one can't convince me that bull run is over .
There will be an altseason . This is the right time for them to take us out of investments . Panic selling is working .Everyone is scared . What if bitcoin goes to 60k? Alts will die !!!
This is what everyone thinks .
I dont think the same.
Something that has never happend before , will happen during this bull run.
We will get that alt season, But when we do everyone is already too tired and won't believe ,they will think it is just another pump and dump .It has worked perfectly for them to make us not believe in alt season .
Get rich quick does not exist ,and everyone got in crypto because of that dream .People are now witnessing that crypto is not easy.
Once everyone starts thinking : that's it ,it is over , "i am going to sell because bitcoin is going down,and alts will die " ,that is the right moment to start putting the money in to the crypto projects .
See you in 2026 .
Hope everyone makes it out of this battle.

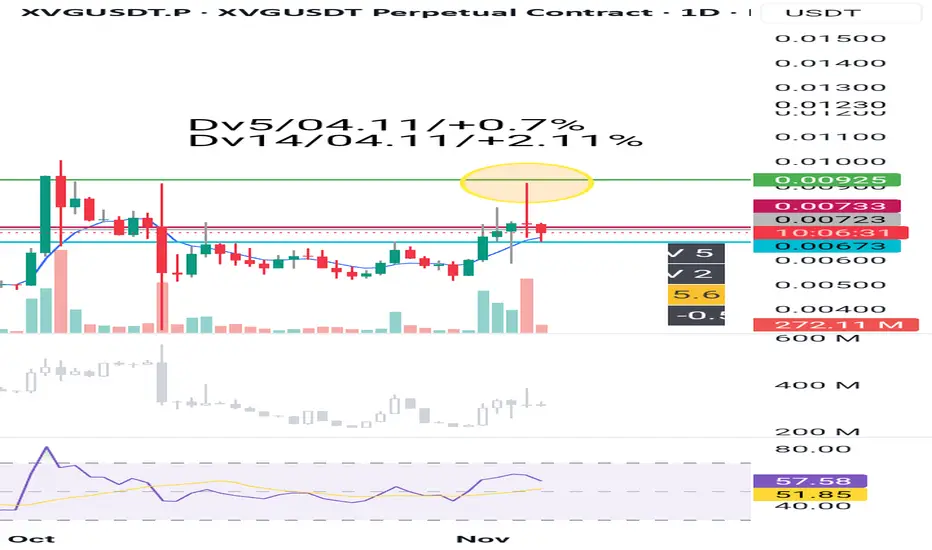
XVGWe missed our take profit by a bit, so I closed the trade manually! Result: +12.85%
Gray line - entry point
Red line - mandatory stop loss
Green line - approximate take profit
Black text above the green line - current data at the time of publication (volume/date/intraday price movement)
XVGWe are moving the deal to breakeven
...
Gray line - entry point
Red line - mandatory stop loss
Green line - approximate take profit
Black text above the green line - current data at the time of publication (volume/date/intraday price movement)

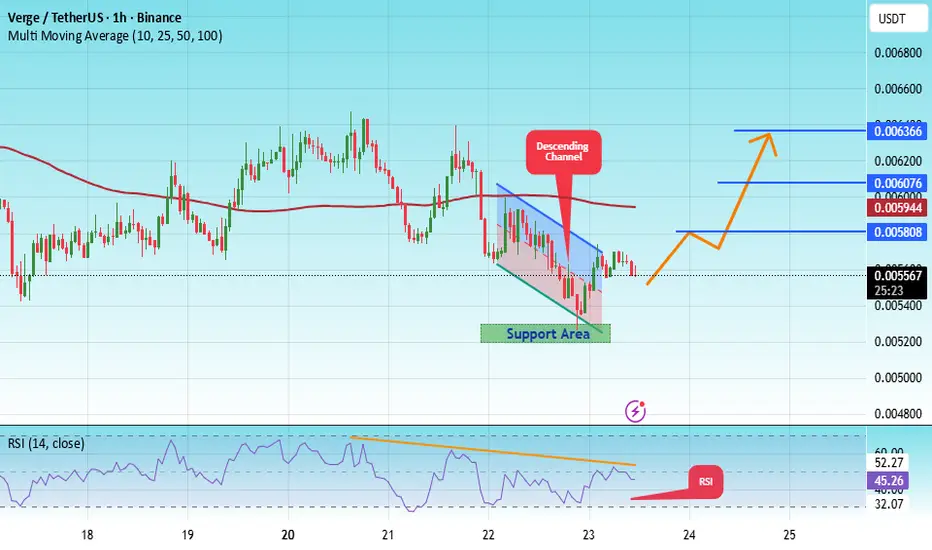
#XVG/USDT — Symmetrical Triangle at Apex: Breakout?#XVG
The price is moving within a descending channel on the 1-hour frame, adhering well to it, and is heading for a strong breakout and retest.
We have a bearish trend on the RSI indicator that is about to be broken and retested, which supports the upward breakout.
There is a major support area in green at 0.005234, which represents a strong support point.
We are heading for consolidation above the 100 moving average.
Entry price: 0.005558
First target: 0.005582
Second target: 0.006076
Third target: 0.006366
Don't forget a simple matter: capital management.
When you reach the first target, save some money and then change your stop-loss order to an entry order.
For inquiries, please leave a comment.
Thank you.
XVGUSDT 1D#XVG is currently trading within a symmetrical triangle on the daily chart. Consider buying around the current level and near the support at $0.006335, which aligns with the daily SMA200. In case of a breakout above the triangle resistance, the potential upside targets are:
🎯 $0.009441
🎯 $0.010829
🎯 $0.012805
🎯 $0.015322
⚠️ Always remember to use a tight stop-loss and maintain proper risk management.

XVGUSDT Forming Falling WedgeXVGUSDT is showing a strong technical setup with the formation of a falling wedge pattern, often recognized as a bullish reversal indicator. This pattern suggests that selling pressure is tapering off while buyers are beginning to accumulate at lower levels. Once a breakout occurs above the wedge resistance line, XVGUSDT has the potential to experience a sharp rally, possibly leading to gains of 90% to 100%+. This pattern formation, coupled with supportive market sentiment, positions XVG for a promising upside move.
Trading volume for XVGUSDT remains steady, reflecting consistent market activity and investor participation. The volume pattern reinforces the credibility of this setup, as healthy volume typically accompanies reliable breakout signals. A surge in volume during the breakout would further validate bullish momentum and could accelerate price action significantly.
Investors have begun to take more interest in XVGUSDT, particularly as the project continues to regain visibility in the broader crypto space. The combination of strong technical structure, improving sentiment, and good liquidity makes XVG a coin to watch closely in the near term. If this momentum continues, XVGUSDT could deliver a substantial rally, creating attractive trading opportunities for both short-term and position traders.
✅ Show your support by hitting the like button and
✅ Leaving a comment below! (What is You opinion about this Coin)
Your feedback and engagement keep me inspired to share more insightful market analysis with you!

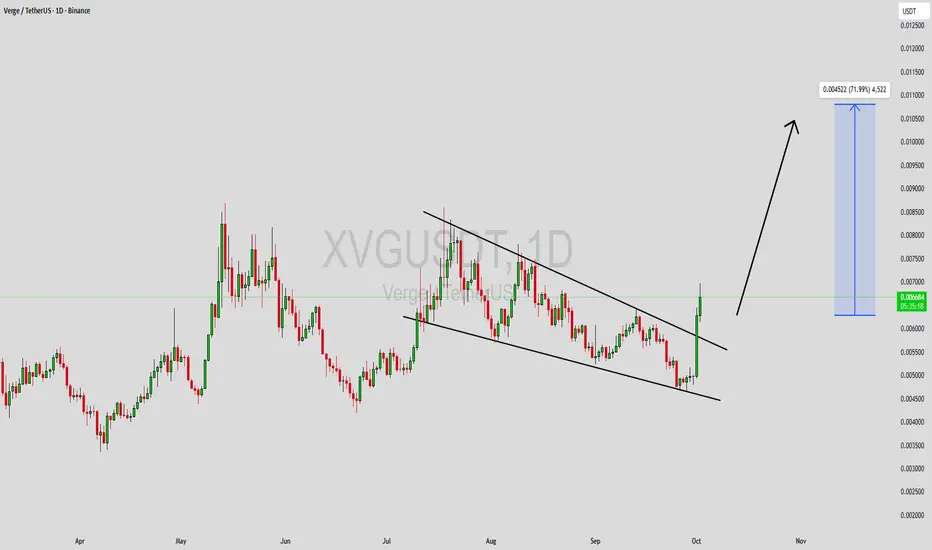
XVGUSDT Forming Falling WedgeXVGUSDT is showing strong bullish potential after forming a clear falling wedge breakout, a pattern that typically signals a reversal from bearish to bullish momentum. This structure suggests that sellers are losing control and buyers are stepping in with confidence. The breakout from the wedge indicates renewed market optimism, which could drive XVG’s price significantly higher in the coming sessions.
Trading volume is showing healthy activity, confirming genuine participation from market players. XVG has successfully retested the previous resistance zone, now acting as support, which strengthens the probability of a continuation toward higher levels. Based on current momentum and market behavior, a potential gain of 50% to 60%+ seems achievable as long as the bullish structure holds and volume remains steady.
Investor sentiment around XVGUSDT is improving, with traders eyeing this setup as a possible start to a stronger uptrend. If XVG continues to attract buyers at these key technical levels, it could trigger a sustained upward move and reclaim previous highs. Traders should monitor the support zone closely, as maintaining it will be crucial for confirming this bullish continuation.
✅ Show your support by hitting the like button and
✅ Leaving a comment below! (What is You opinion about this Coin)
Your feedback and engagement keep me inspired to share more insightful market analysis with you!

XVG/USDT – Range Breakout Supported by Strong Buy Pressure and VAfter an extended period of sideways movement, XVG has finally broken out of its consolidation range, signaling a shift in market dynamics. The breakout is being supported by increasing buy pressure and rising volume, confirming the strength behind the move.
Xvgusdt buy opportunityXVGUSDT is showing a strong move within a rising channel following a well-defined rounding bottom reversal. The focus is on the neckline of the rounding bottom, where wave 5 of the channel is expected to complete before a possible correction. This correction could evolve into either a cup and handle or an inverse head and shoulders (iH&S) pattern, time will reveal the structure. Watch the highlighted demand zone for potential accumulation opportunities.

XVGUSDT UPDATE#XVG
UPDATE
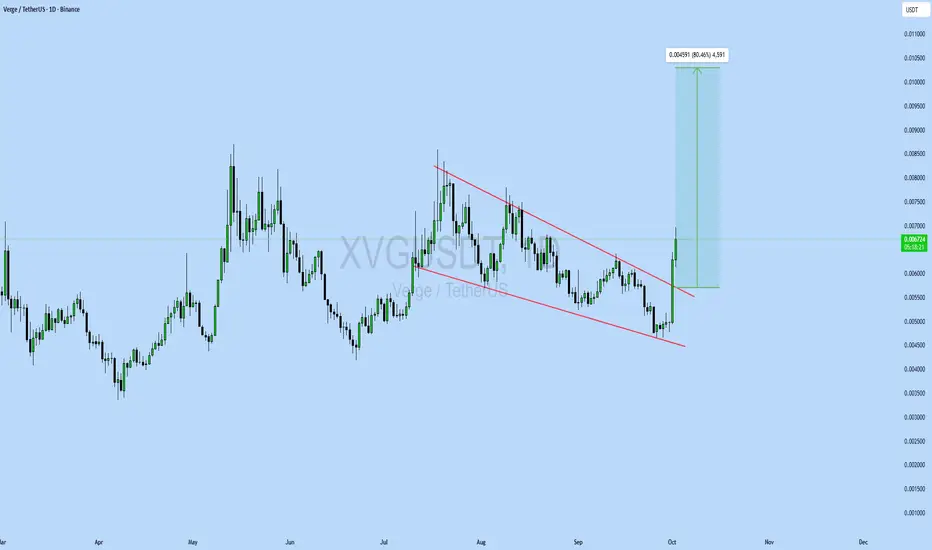
XVG Technical Setup
Pattern: Bullish falling wedge breakout
Current Price: $0.00672
Target Price: $0.01131
Target % Gain: 80.46%
SGX:XVG has broken out of a falling wedge pattern on the 1D timeframe. The breakout signals strong bullish momentum with a target near $0.01131, offering around 80% upside potential. Continuation structure looks favorable if momentum sustains. Always use proper risk management.
XVGUSDT Forming Falling WedgeXVGUSDT is forming a falling wedge pattern, a well-recognized bullish reversal signal in technical analysis. This structure indicates that selling pressure is gradually weakening while buyers are starting to gain momentum. With consistent volume supporting the move, the probability of a strong breakout is increasing, making this pair an attractive setup for traders looking for medium-term opportunities.
The current chart structure suggests an expected gain of around 60% to 70% once the breakout confirms. A decisive move above the wedge resistance could trigger rapid upward momentum, attracting more traders and investors to join the rally. This type of pattern often precedes strong bullish runs, especially when supported by healthy market activity.
Investor interest in XVGUSDT is growing, and with solid trading volume and improving sentiment, this coin has the potential to see significant movement in the coming sessions. If momentum continues to build, XVG could become one of the standout performers among mid-cap crypto pairs.
✅ Show your support by hitting the like button and
✅ Leaving a comment below! (What is You opinion about this Coin)
Your feedback and engagement keep me inspired to share more insightful market analysis with you!
XVG/USDT LONG SET-UPBINANCE:XVGUSDT
Waiting for a small retracement
FVG = Buying Area
keep an eye , spot buy only

XVG/USDT — Symmetrical Triangle at Apex: Breakout?Pattern & Overview
The XVG/USDT daily chart is forming a symmetrical triangle — descending resistance from the Dec 2024 high and ascending support from the April 2025 low. Price is now around 0.00743 USDT, nearing the apex, indicating reduced volatility and an increased chance of a sharp breakout soon.
Pattern characteristics:
Higher lows (rising support line) suggest accumulation.
Lower highs (descending resistance) indicate continued supply overhead.
Volume usually contracts within the pattern; a valid breakout is often confirmed by a volume spike.
---
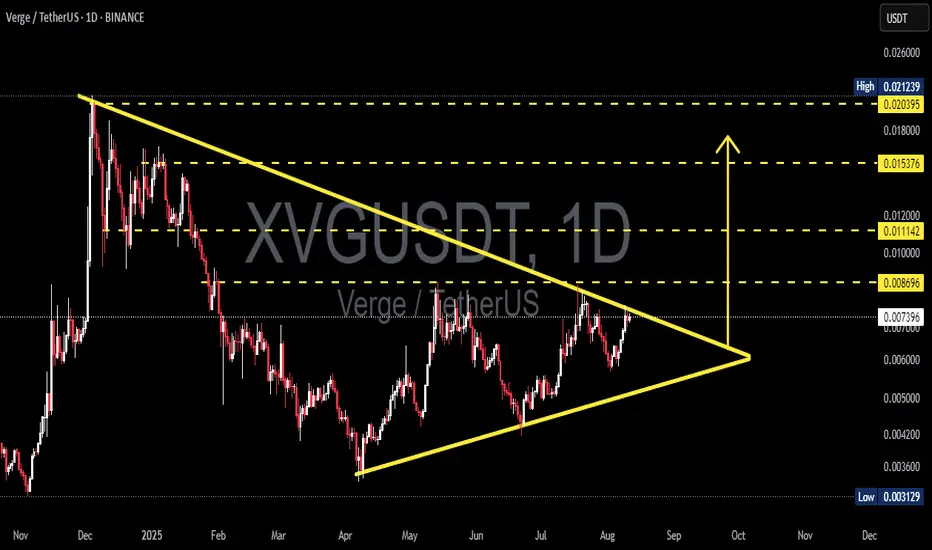
Key Levels (marked on chart)
Resistances / potential upside targets: 0.008696 (immediate), 0.011142, 0.015376, 0.020395, up to ~0.02124 (high).
Critical supports / breakdown levels: ascending trendline (~0.005–0.0055 zone) and historical low at 0.00313.
---
Bullish Scenario (confirmation & targets)
Confirmation: daily close above the descending resistance + increased buy volume. Ideally, wait for a daily close above 0.0080–0.0087 (breakout zone) before adding positions.
Measured targets (from current ~0.007428):
Target 1: 0.008696 → +≈17.1%
Target 2: 0.011142 → +≈50.0%
Target 3: 0.015376 → +≈107.0%
Example trade plan:
Conservative entry: after daily close > 0.0087.
Conservative stop: below breakout retest / under 0.0066 → stop ≈ -11.15%; R:R to Target 1 ≈ 1.5:1, to Target 2 ≈ 4.5:1.
Aggressive entry: buy now (~0.00743), stop below ascending trendline (~0.0055) → stop ≈ -25.96%; R:R to Target 1 ≈ 0.66:1 (higher risk).
---
Bearish Scenario (confirmation & targets)
Confirmation: daily close below the ascending trendline (~0.005–0.0055 zone) with increased sell volume. If confirmed, price could drop toward:
First support: 0.0050 → ≈-32.7% from current price.
Strong support: 0.0042 → ≈-43.5%.
Worst-case retest of historical low: 0.00313 → ≈-57.9%.
Short/Cut-loss strategy: wait for a confirmed close below support, then enter on a pullback/retest with stop above the retest level.
---
Risk Management
Symmetrical triangles can have false breakouts — always wait for confirmation (daily close + volume).
Limit risk per trade (e.g., 1–2% of capital). Adjust position size based on stop distance.
Take profits in stages: e.g., 30–50% at first resistance, another 30% at second resistance, trail the rest.
Keep an eye on news, listings, or on-chain events — crypto reacts strongly to short-term fundamentals.
> XVG is forming a contracting symmetrical triangle on the daily chart. Higher lows vs. lower highs — price is approaching the apex.
Bullish: daily close above 0.0080–0.0087 with volume → targets 0.0087 / 0.0111 / 0.0154 (+17% / +50% / +107% approx).
Bearish: daily close below rising support (~0.005–0.0055) → possible drop to 0.005 / 0.0042 / 0.00313 (-26% to -58% approx).
Wait for confirmation, manage your risk, and scale out profits. 📉📈
#XVG #Verge #XVGUSDT #Crypto #TechnicalAnalysis #Triangle #Breakout #Altcoins #RiskManagement
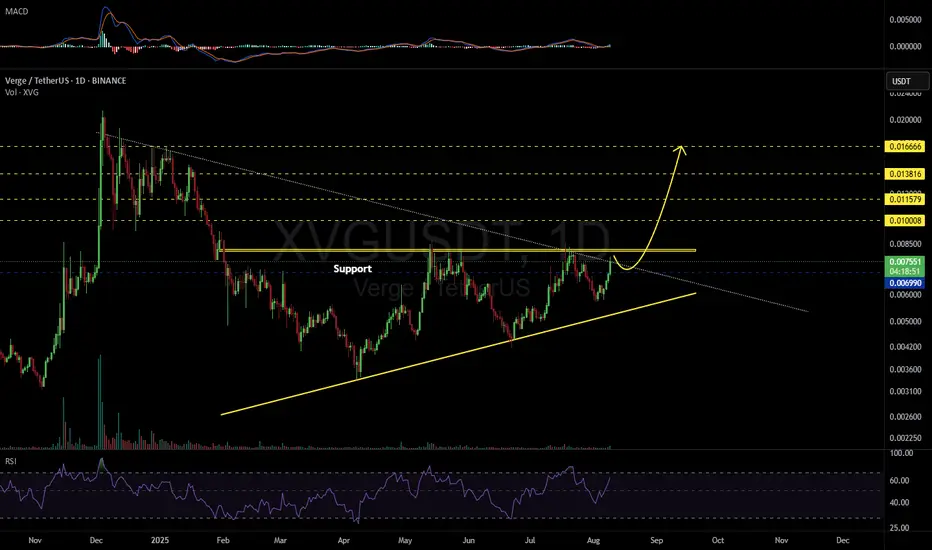
XVGUSDT 1D#XVG is moving inside an ascending triangle on the daily timeframe. Consider buying at the current price and near the support level of $0.006990.
In case of a breakout above the triangle resistance, the potential targets are:
🎯 $0.010008
🎯 $0.011579
🎯 $0.013816
🎯 $0.016666
⚠️ As always, use a tight stop-loss and apply proper risk management.
XVG (VERGE) BACK TO OLD TIMES up $0,01There is new data that shows an increase in interest of the verge increase.
This could mean a new return to the up $0,01 price action
I did expect before the floki increase from start to end, and expecting verge to taking the same way.
Last break was able to do in 2 days and 16H
Xvgusdt buy opportunity you don't want to miss!!!!Xvgusdt is currently trading within a potential ascending setup following a 5-leg drop, signaling a potential upward breakout.
We have identified a clear setup for potential accumulation and recommend establishing a stop loss level to manage risk in the event of a reversal.
Your engagement is valuable, so if you find this setup helpful, please consider liking the post and sharing your comments.
Thank you for your support.
