Market insights

YFIUSDT 2/3/2021Note: NOT A FINANCIAL ADVICE TO BUY/LONG OR SELL/SHORT
____
I'm still hoping that this will be realized but needs to wait a bit longer. Hoping it will happen.
---_
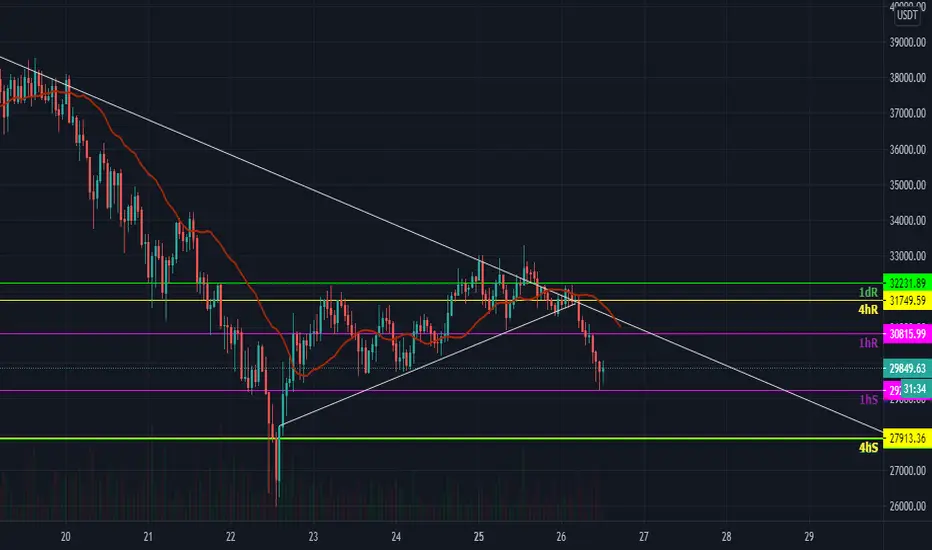
1D
Seems like, there is a good chance for a bullish confirmation later.
Needs to break $ 32,856.40
4HR
Still on consolidation. Only daily chart is good to see.
1HR
It really need to broke $ 32,856.40.
____
Note: NOT A FINANCIAL ADVICE TO BUY/LONG OR SELL/SHORT

YFI finished its coffee break?One of the best investments I did; $YFI
Use to follow it in my tweets. This is a snapshot of what I did saw in its history as I was monitoring. Next steps may make history as the powerful pattern start to form completely .
Interesting to watch.


See you at the crossroads. 18k or 55k YFIHighlighted areas to watch. Daily bearish divergence or consolidating?
Not financial advice.
Support the legalizedhustler


YFIUSDT 1/30/2021Note: NOT A FINANCIAL ADVICE TO BUY/LONG OR SELL/SHORT
______
TA
1D
4HR
1HR
Elliot Wave Counts
____
Note: NOT A FINANCIAL ADVICE TO BUY/LONG OR SELL/SHORT


YFIUSD ://BUY THE DIPS_TAKE PROFITbuy the dip only 30k of these n big yfi curve news pending n in progress
_HGM

YFI/USDT - nice short setupMost of the altcoins are still above 21 daily MA, but YFI is not one of them and short term, I am bearish. We have impulse rejection off 40k and I think we will be continue down, finishing ABC corrective cycle, somewhere around 20k. I am already in position.

YFIUSDT_Daily: Analysis Upadte***********************************************
Price : 28,716 USDT
Entry LVL: 28,500 -28,700 USDT
Support Zone: 25,000 -26,000 USDT
Expected Return: 30%- 58%
Reward/Risk: 3.8
TP_LVL I: 23,000 USDT
TP_LVL II: 43,000 USDT
SL: 143 Sat
***********************************************


YFIUSDTmy opinion it's going to up till 35-37 k to complete head and shoulder pattern than fail to 12 and 8 k

🆓Yearn.Finance/USDT Analysis (27/1) #YFI $YFIYFI is in a correction to $22-23k zone, which is a good buy zone and we can expect a strong rally to $32k, $44k and even $65k in February.
📈BUY
-Buy: 22k-23k$. SL B
📉SELL
-Sell: 32k-33k$. SL A
-Sell: 43k-45k$. SL A
-Sell: 65k-67k$. SL A
♻️BACK-UP
-Sell: 22k-23k$ if B. SL A
-Buy: 16k-17k$. SL B
-Buy: 32k-33k$ if A. SL B
❓Details
Condition A : "If 1D candle closes ABOVE this zone"
Condition B : "If 1D candle closes BELOW this zone"


YFI/USD - Trying its luck at $36k!YFI has found some good support on the ascending wedge and we seem keen to push higher to $36k.
We have some resistance before that is feasible, so let's see if we can pass the dotted diagonal which serves as immediate resistance.
Indicators on 4h are looking good to me, therefore short term bias is bullish. ETH and BTC also managed to hold at support and reverse higher, which is bullish, at least for now. See my ideas below for that.
Like and follow if you liked this idea!

$YFI/USDT 1h (Binance Futures) Falling wedge breaking outYearn.finance is looking bullish again, let's scalp the break-out!
Current Price= 29695.6
Buy Entry= 29702.4 - 29340.2
Take Profit= 31037.9 | 32369.3 | 34772.9
Stop Loss= 27964.7
Risk/Reward= 1:1 | 1:1.87 | 1:3.43
Expected Profit= +10.42% | +19.44% | +35.74%
Possible Loss= -10.42%
Fib. Retracement= 0.5 | 0.786 | 1.272
Margin Leverage= 2x
Estimated Gain-time= 120h

Crypto|YFI/USDT|LongLong YFI/USDT
Activation of the transaction only when the blue zone is fixed/broken.
The idea is to work out the resistance level .
* Possible closing of a trade before reaching the take/stop zone. The author can close the deal for subjective reasons, this does not completely cancel the idea and is not a call to the same action, you can continue working out the idea according to your data, but without the support of the author.
+ Maybe right now we will go even lower, then it's okay, the idea is not activated and simply canceled.
The "forecast" tool is used for more noticeable display of % (for the place of the usual % scale) of the price change, I do not put the date and time of the transaction, only %.
Blue zones - activation zones.
Green zones - take zones.
The red zone - stop zone.
Working out the stop when the price returns to the level after activation + fixing in the red zone.
Orange arrow - the direction of take.
Blue arrow - neutral scenario without activating the trade.
The red arrow - the direction of the stop.
P.S Please use RM (risk management) and MM (money management) if you decide to use my ideas, there will always be unprofitable ideas, this will definitely happen, the goal of the system is that there will be more profitable ideas at a distance.

YFIUSDTYFI has shows bearish signals if u have this assets its the best time (if u are not a HODLER and a mid-term or lower term trader) to cash them and wait for the pattern to be completed
its all abut advanced price action checked in the famous time frames not the customs
