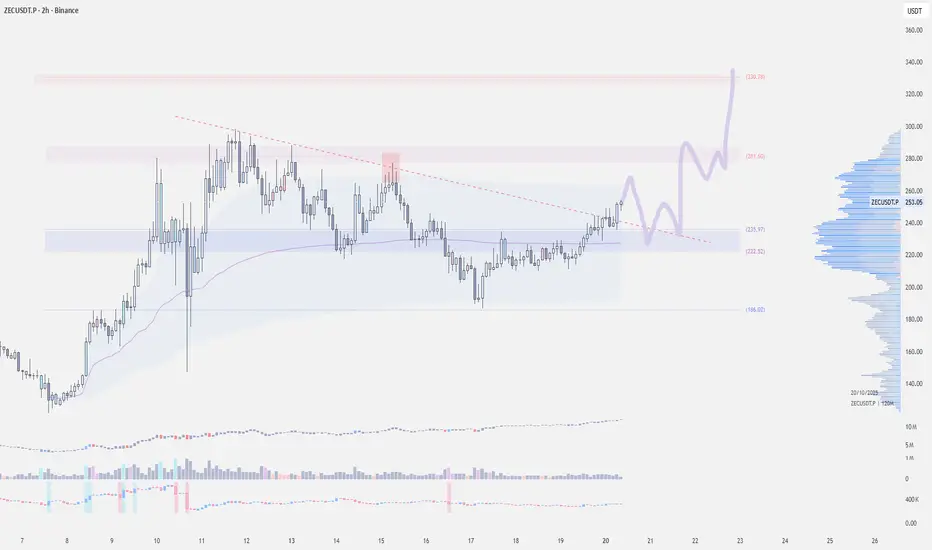
Check if 224.47-260.42 can be supported
Hello, fellow traders!
If you "Follow" us, you'll always get the latest information quickly.
Have a great day.
-------------------------------------
(ZECUSDT 1M chart)
You might be wondering why it's rising, but you don't need to know why.
Because it's already rising.
It's a sharp rise, breaking above the important support and resistance area of 56.29-78.91.
The key is whether the price can hold above the Fibonacci 1.618 (338.52) level.
If not, we need to check for support near 220.20, the previous DOM (60) indicator level.
Since the chart was broken by a surge, I believe the next support period is crucial.
-
(1W chart)
The next volatility period is expected to be November 3-23, around the week of November 10.
-
(1D chart)
As mentioned earlier, since the chart was broken by a surge, I think we can calculate the next volatility period based on the next support period.
Until then, we need to see how the price moves after this volatility period, which runs around October 21 (October 20-22).
Looking at the current 1D chart, the HA-High ~ DOM(60) range is forming between 224.47 and 260.42. Therefore, we need to see if it can find support within this range and rise.
If it falls below 220.20, it could fall to around 115.72, so we should consider a response plan.
-
Thank you for reading to the end.
I wish you successful trading.
--------------------------------------------------
Market insights

$ZEC: From Rebound to Breakout?ZEC’s fundamentals continue to strengthen. Its integration with Router Protocol enhances cross-chain interoperability — a step that bolsters Zcash’s long-term outlook even as privacy adoption remains niche.
Following a sharp pullback, Zcash has rebounded 37% from the $187 demand zone. The move reaffirmed support above the anchored VWAP and marked a breakout from diagonal resistance, signaling improving momentum.
Technically, the $270 zone stands as the next major resistance. A rejection there could lead to a retest of $230 but maintaining price action above $200 — where a short-term consolidation previously formed — the overall structure remains healthy.
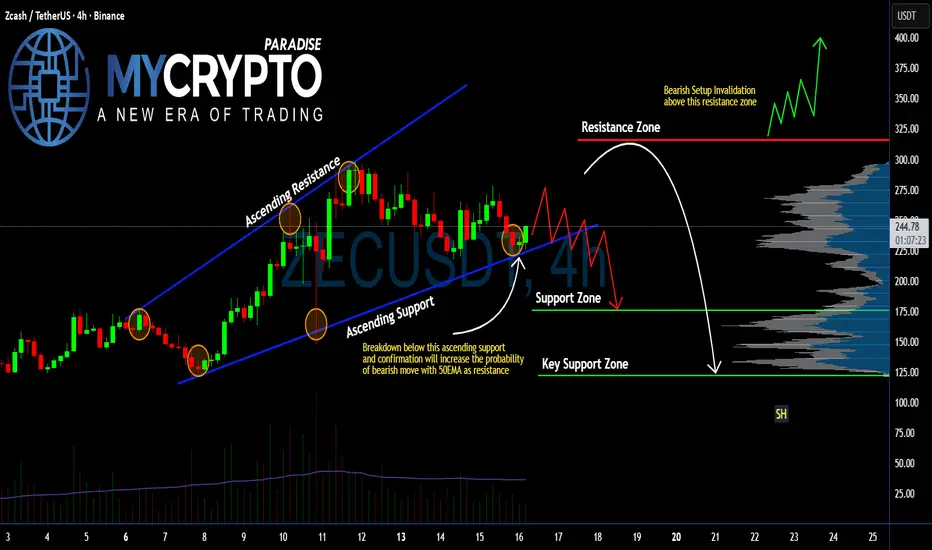
#ZEC Ready to Collapse? Breakdown Here Could Trigger Panic Sell Yello Paradisers! Are you really paying attention to what’s brewing on #ZECUSDT? Because if not, you might be blindsided by what could be a brutal move down. Let's get into the #ZEC setup:
💎#Zcash has been trading inside an Ascending channel, but the momentum is clearly fading. The last bounce off the ascending support was weak, and now we are testing that same ascending support again, but this time, with growing selling pressure.
💎Current price of #ZEC is around $242, and the situation is getting critical. A confirmed breakdown below this ascending support will flip the structure bearish and open up a clean setup toward significantly lower levels. The 50 EMA, which is now acting as dynamic support, will act as resistance. It will only accelerate the downside if this breaks.
💎If this breakdown plays out and is followed by a failed retest of the broken trendline, we could easily see price dump into the Support Zone around $175, and possibly even fall into the Key Support Zone near $121, where stronger buyers may finally step in.
💎On the flip side, the bearish setup is invalidated only if #ZECUSD breaks back above the Resistance Zone at $316. That would shift momentum in favor of the bulls and could spark a sharp rally.
Trade smart, Paradisers. This setup will reward only the disciplined.
MyCryptoParadise
iFeel the success🌴
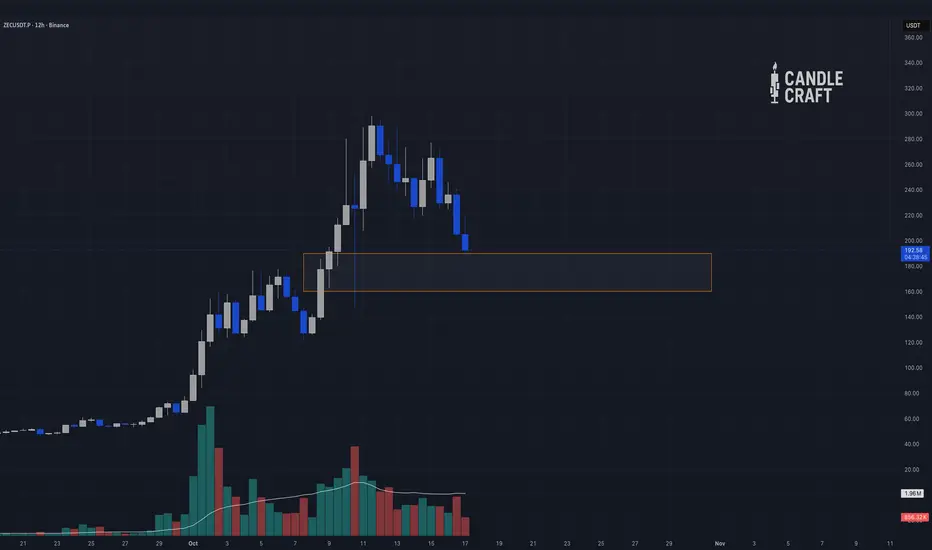
ZECUSDT — The Quiet Strength Nobody’s Talking AboutWhile other altcoins got obliterated back to dust, ZEC quietly refused to die.
Look closer. That massive pump wasn’t random hype — it built on a deep multi-year base, then finally broke through all historical supply like butter. Now we’re simply retesting that breakout zone, not collapsing.
What looks scary on the 12H chart is, on the macro view, just a controlled pullback into a region that’s both structurally sound and psychologically loaded — the orange box between ≈170–190 USDT.
This is the same area where breakout traders took profits and patient hands are now waiting to reload.
This isn’t a dead project gasping for air; it’s one of the few survivors from multiple bear cycles that still holds its macro structure.
While other charts scream exhaustion, this one whispers continuation — if the market holds.
🧩 Our logic:
→ The 2-day and weekly candles both confirm the first proper retest of a long-term breakout.
→ If Bitcoin doesn’t nuke the entire field, ZEC has a clean path to re-establish strength from this base.
→ Ideal strategy: Spot accumulation or ≤5× leverage entries inside the orange box.
Patience is the edge here.
ZEC doesn’t need hype — it just needs time.
And when this thing wakes up again, most traders won’t even realize it’s already halfway gone.
Candle Craft | Signal. Structure. Execution.
ZEC breakout of multi years resistance !ZEC / USDT
We noticed a Strong move this week
Price broke multi-years resistance line (2024/2022/2020) which is a huge breakout for this coin !
Simple thing , Holding above line = bullish
Invalidation: candle close below it

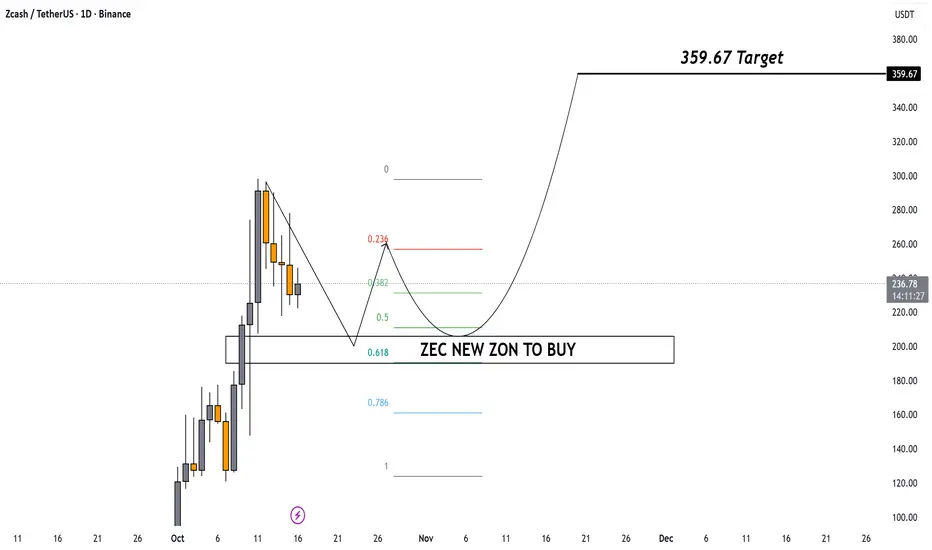
ZEC Strong Bullish Setup Loading
After a sharp rally, ZEC is cooling off — and a perfect buy zone is forming near the 0.5–0.618 Fibonacci levels 👇
🟦 ZEC NEW ZONE TO BUY = Prime entry opportunity before next leg up🚀
Cup & handle structure forming — breakout brewing!
🎯 Target: $359.67
#ZECZEC has recently seen a spike while the market was dumping. You need at least three touches before a breakout on a resistance level. The question to be asked, how long it will consolidate at this level or will it revisit it previous support. Only time will tell stay tuned.

ZEC peakedZcash had a very good run but all good times come to an end.
It is breaking down. I dont want to be a buyer here or even higher.
All Info in the Chart.
No trading advice - my opinion

ZECUSDT – Bullish Flag Pattern: Consolidation Before Breakout?Overview
After a powerful rally that pushed ZEC from around $100 to nearly $300, the market has entered a healthy consolidation phase — forming a clean Bullish Flag Pattern on the 4H timeframe.
This pattern often represents a pause within a strong uptrend, where smart money accumulates positions quietly before the next major breakout.
As long as price remains within this downward-sloping channel (yellow zone), the structure still reflects controlled consolidation inside a broader bullish context.
---
Pattern Identification
Primary Pattern: Bullish Flag
Characteristics: A downward-sloping parallel channel following a sharp upward impulse
Technical Implication: Typically signals a continuation pattern, suggesting that the uptrend is not yet over
Confirmation: A 4H candle close above the upper boundary of the flag, supported by rising volume
---
Key Technical Levels
Upper Flag Resistance: $289 – $298
→ A breakout and 4H close above this zone confirms bullish continuation
Mid-Zone Support: $271
→ Serves as a balance level within the consolidation range
Lower Flag Support: $261
→ Acts as invalidation for the flag; a breakdown below could trigger short-term correction
---
Bullish Scenario
If ZEC breaks out above the flag and closes firmly above $298, the next leg of the rally could begin.
Confirmation: 4H close > $298 with strong bullish volume
Target 1: $320 – $340
Target 2 (Measured Move): $480 – $490, based on the length of the previous flagpole
Invalidation: 4H close back below $261
💡 Bullish Flags often lead to explosive continuation moves — once confirmed, momentum can accelerate rapidly.
---
Bearish Scenario
If price fails to hold support and breaks down below $261, it could shift into a short-term correction phase.
Confirmation: 4H close < $261
Target 1: $220 (previous demand area)
Target 2: $190
Invalidation: Close back above $289 cancels the bearish bias
---
Conclusion
ZEC is currently in a calm but critical stage — consolidating after a major impulse, with a textbook Bullish Flag forming at the top of the move.
A confirmed breakout above $289 – $298 would strongly suggest that the next bullish leg is about to unfold.
Patience and confirmation are key: true breakouts are often preceded by quiet compression like this one.
---
#ZEC #ZECUSDT #BullishFlag #CryptoAnalysis #TechnicalAnalysis #ZECBreakout #PriceAction #CryptoTrading #MarketStructure #SwingTrade #ChartPattern

ZECUSDT — D1 Peak Confirmed! Should You Cash Out?⚠️ ZECUSDT — D1 Peak Confirmed! Should You Cash Out?
We bought ZEC early around $43, and it has now rocketed nearly 7× from our base entries.
Not only that — we also caught multiple pullback buys along the way.
📈 Macro Setup (W & M Trend)
ZEC remains in a strong uptrend across Weekly and Monthly charts.
The most recent Weekly wave base formed near $48, confirmed on Sept 1, 2025 — the true starting point of this powerful rally.
🧩 Daily Wave (D1 Structure)
On the Daily chart, the wave base was confirmed around $58 on Sept 24, 2025.
After that, we had two great pullback entries:
Sept 28, 2025: $55–56
Oct 6, 2025: $171
Each one printed healthy profits before today’s D1 Peak Confirmation.
💰 Action Plan
Cash Out short-term pullback positions — protect the gains.
Hold the core Weekly positions for the next resistance zone at $360–$400.
Expect a D1 correction soon, as the market cools off after a huge run.
🎯 Summary
ZEC has given us abundance.
D1 peak = confirmed, correction phase incoming.
Lock in the pullback profits, stay patient with the Weekly ride to $360–$400.

Albeit Risiing Interest on Zcash The Asset is Poised to Retrace $ZCASH is set to retraced to the 50% Fib level before picking liquidity up to the $500-800 range. The asset has surged roughly 300% for the past weeks from a low of $40 to $238.
While the asset is currently overbought, growing interest from VC and Institutional bodies spike.

ZecHigh Probability of Liquidity Hunt: The market structure strongly suggests a high probability of price being drawn into a "liquidity hunt" to the downside. Large market participants are likely incentivized to push price into the 218.00-216.00 range to trigger stop-losses and liquidations, allowing them to fill large orders at more favorable prices or to capitalize on the ensuing volatility.
Potential for Cascade Effect: Should the 220.00 level fail to hold, a rapid descent into the 218.00 and then 216.00 zones is a high probability. The sheer density of these clusters implies that if triggered, a liquidation cascade could accelerate the move, creating significant selling pressure.
Long Entry
212
215.5
218
Tp
220
221.6
223
226

Don’t Chase Green — ZEC’s 165–185 Reload vs 285 BreakoutZEC is in vertical expansion after a multi-year base break. We map decision zones and let price confirm.
1W
• +350% in three weeks; clean break of the 2022–2024 base (≈$30 → $80) and engulf of $120–130 supply.
• In price discovery until next HTF resistance band $260–280.
• Weekly volume highest since 2021 → true impulse confirmed.
2D
• Two candles show exhaustion wicks, no structural break.
• Momentum extreme; a mean reversion toward $180–190 is likely and ideal for re-entry if defended.
12H
• Local parabolic channel intact.
• $160–175 demand base (FVG + prior imbalance).
• Reclaim > $240 resumes markup into $270 → $310 extension.
📈 Orderflow / Derivatives
• POC: ≈ $190
• Open Interest: ≈ $210M (+90% week-over-week) → leverage inflow
• Funding: +0.08–0.10% on Bybit → crowded longs
• CVD: positive — spot absorption still present
• Liquidations: clusters below $175 and above $260 → prime hunt zones
⸻
⚔️ Sweep Zones / Execution Boxes
🔶 Resistance Sweep Zone — $260 → $285
• Break > $285 with OI rising → price discovery into $310–340.
• Wick rejection + funding cool-off → short-term top → pullback to $190 POC.
🟩 Support Sweep Zone — $165 → $185
• Flush into band with OI reset & CVD turn positive = re-entry zone.
• Break < $165 = parabola ends → $125–140 mid-range rebuild.
⚫ Deep Liquidity Zone — $120 → $140
• Historical weekly supply flip.
• Defend → macro bullish continuation; lose → revert to range cycle.
⸻
🧭 Interpretation
ZEC sits in speculative escape velocity (privacy narrative + supply squeeze). Risk is elevated with funding and OI stretched. Prefer pullbacks into $190 → $175 with OI flush for continuation plays. As long as 12H closes > $160, macro bias stays bullish.

Zecs and drugzZec is parabolic so you need to zoom in to see the details of the chart oO - The price has been crashing thru the fibs and is currently on the uptrend support of the Gann 1x4 fib ray just beneath the 200% fib - Zec is accumulating for the next push to the 300% fib
For the price to hit the top of the chart Zec candles have to hold the parabolic channels of the Gann fib rays where it currently is - Basically it needs to stay vertical, if the candles start tracking to the right and lose the parabola it would be a bearish signal that the rally was over

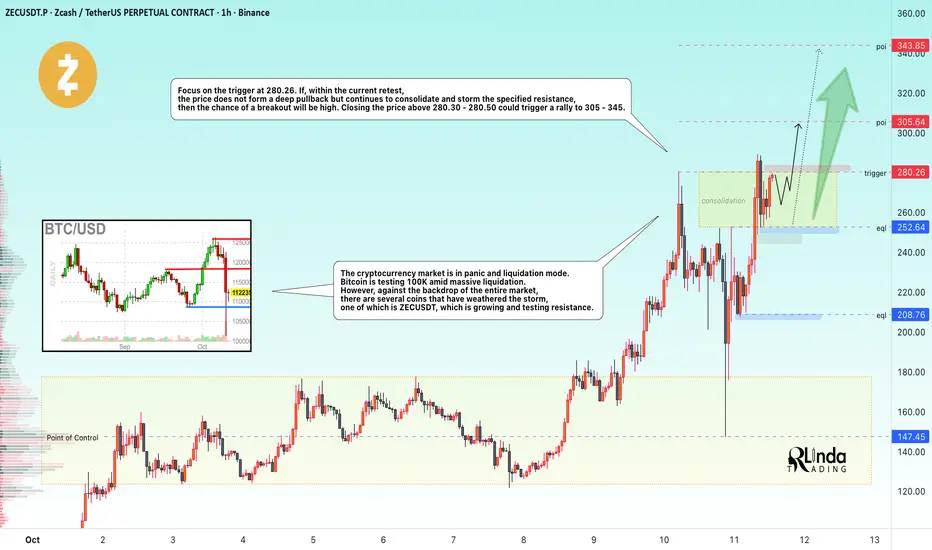
ZECUSD → The altcoin exception that is growingBINANCE:ZECUSDT withstood the blow of the global decline that affected the entire cryptocurrency market, liquidating long positions worth $10 billion. But even in such a situation, there can be exceptions ;)
The cryptocurrency market is in panic and liquidation. Bitcoin is testing 100K amid massive liquidation. However, against the backdrop of the entire market, there are several coins that have withstood the blow, one of which is ZECUSDT, which is growing and testing resistance
ZEC was also hit by the decline, but after testing the control point in the area of maximum volume density 145-155, the market aggressively and quickly bought up the altcoin, indicating bullish strength at the moment.
Resistance levels: 280.30, 305.65
Support levels: 242.64, 208.76
Focus on the trigger at 280.26. If, during the current retest, the price does not form a deep pullback but continues to consolidate and storm the specified resistance, then the chance of a breakout will be high. A closing price above 280.30 - 280.50 could trigger a rally to 305 - 345.
Best regards, R. Linda!
ZEC: intraday tradingWithin a day, you can trade from local zones. The indicator shows the direction of priority trades well.

ZEC VS XRPCRYPTOCAP:ZEC VS CRYPTOCAP:XRP comparison 📊
CRYPTOCAP:XRP created the same pattern just before tapping the ATH zone and that was only 30-40% away that time..
Now exactly same pattern is repeating in CRYPTOCAP:ZEC too...
Any breakout above this blue circle is a buy in $ZEC..
this can go another 50-60% UPSIDE more from here afer the ATH tap...
thats it this was the alpha for today 😉
i can be highly wrong on this one but just sharing my analysis what am watching on charts here...

ZEC is breaking out!Massive double bottom for ZEC with a strong breakout, price can continue to rise till 200$ in the following weeks.

Phemex Analysis #108: ZCash (ZEC) Went Parabolic—Is $300 Next?In a matter of weeks, PHEMEX:ZECUSDT.P ripped from the double-digits into the mid-$200s, putting privacy coins squarely back in focus. As of now, ZEC hovers near $245–$260, with an intraday range that’s stretched as high as the upper-$270s—the kind of wide tape that rewards disciplined plans and punishes hesitation.
With momentum heated and volatility elevated, here’s a clear if/then map for the next leg.
Possible Scenarios
1) Bullish Continuation — squeeze through the high-$260s, eyes on $277 → $300
What to watch: A decisive push back through $260–$270 with rising volume. That reclaims the top of today’s range and puts the $277 spike back in play; above there, round-number gravity favors a $300 test.
Pro Tips:
Entry: Add on a strong 1H/4H close > $268–$270, or a break-and-retest that holds.
Risk: Initial stop just below the reclaimed zone (e.g., $255–$258).
Targets: $277 (recent peak), then stagger into $295–$305 if momentum persists.
2) Retest & Accumulation — cool off into $210–$230, rebuild for another run
What to watch: A controlled pullback (shrinking candles, softer volume) into $230 or as deep as $210–$215. This lets funding reset and late longs get flushed without breaking market structure.
Pro Tips:
Entry: Scale bids near $230 → $215 only if selling pressure is waning.
Risk: Place protective stops a tier below your lowest ladder (e.g., $204–$206).
Re-trigger: Re-add on a reclaim of $240–$245 with volume.
3) Bearish Reversal — lose $210 on heavy sell volume, open a slide to $185 → $168
What to watch: A daily close under $210 with expanding volume, turning today’s lower bound into resistance. That exposes $185 (prior congestion) and even the mid-$160s (today’s intraday low region) in a sharper unwind.
Pro Tips:
Defense first: Cut risk on a decisive break < $210.
Patience: Don’t knife-catch; look for capitulation (wide wick + volume spike) then base-building before re-entries.
Invalidation to flip long: Strong reclaim of $210–$215 after the flush, with momentum divergences.
Conclusion
ZEC’s tape is hot, the ranges are wide, and the levels are clean. Trade what the market gives you:
If the high-$260s break and hold → ride the $277 retest, then stalk $300.
If we cool into $230–$215 on light volume → consider accumulation for the next push.
If $210 snaps on heavy selling → stand aside and wait for $185 → $168 stabilization.
Stay nimble, size sanely, and let the levels—not the adrenaline—drive your decisions.
🔥 Tips:
Armed Your Trading Arsenal with advanced tools like multiple watchlists, basket orders, and real-time strategy adjustments at Phemex. Our USDT-based scaled orders give you precise control over your risk, while iceberg orders provide stealthy execution.
Disclaimer: This is NOT financial or investment advice. Please conduct your own research (DYOR). Phemex is not responsible, directly or indirectly, for any damage or loss incurred or claimed to be caused by or in association with the use of or reliance on any content, goods, or services mentioned in this article.
$ZEC $404Altcoin season hasn’t started yet and CRYPTOCAP:ZEC has already pumped over 1000% from the bottom. Some short-term pullback is possible, but the structure still suggests room for another 100% move to the upside.

ZEC/USD — Zcash Tests 3-Year Highs, Bulls Target $218–$295ZEC/USD continues its strong rally, reaching a three-year high at $186. Over the past 30 days, Zcash has gained more than 240%, supported by rising trading volume and renewed demand for privacy coins. Bulls are now attempting to secure a weekly close above $158, which would confirm continuation of the bullish trend.
⸻
Technical Analysis
Zcash trades within a broad ascending channel. After consolidating above $158, the next upside targets are aligned with major resistance zones:
• $218 — March 2022 swing high; first strong resistance area.
• $295 — November 2021 high; potential medium-term target.
• $371 — all-time high from May 2021; long-term bullish objective.
If bulls manage to maintain control, momentum could accelerate toward $295–$371 in the coming weeks.
On the downside, a close below $158 would weaken the structure and expose $122 (weekly low) and $78 (December 2024 high) as next support zones.
⸻
Indicator Setup
• Bollinger Bands expanding upward — signaling strong volatility.
• MACD remains positive, confirming bullish momentum.
• RSI above 70, suggesting potential overbought conditions but no reversal signal yet.
⸻
Trading Scenarios
Bullish scenario:
Long positions may be considered above $158, targeting $218, $295, and $371, with stop-loss at $142.
Bearish scenario:
Short positions become valid below $158, targeting $122 and $78, with stop-loss at $170.
⸻
Outlook:
ZEC remains in a strong uptrend but is approaching key resistance. A confirmed breakout above $218 could trigger the next leg higher toward $295–$371.

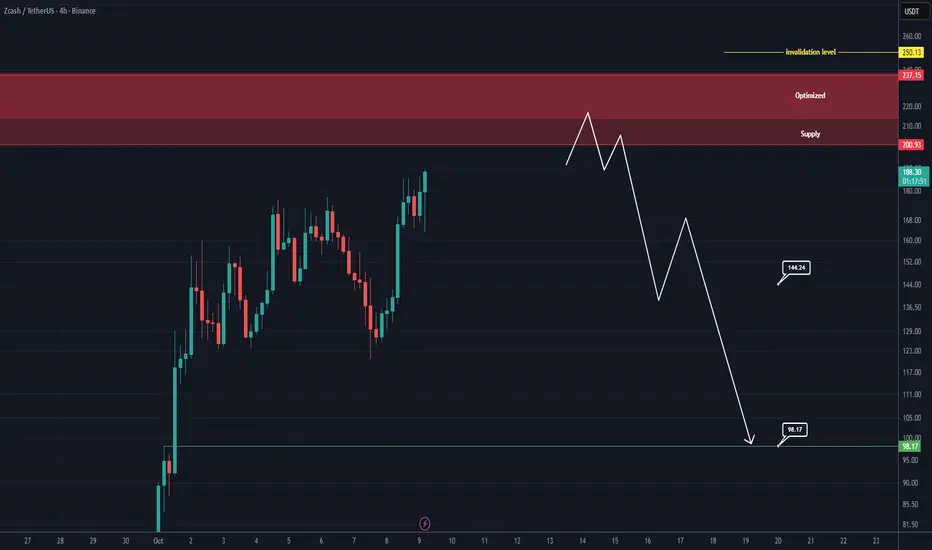
ZEC Analysis (4H)This coin has grown significantly and is now approaching a very strong resistance zone.
The supply zone contains an optimized sub-zone that we’ve labeled as optimized. The closer the candles are to this area, the safer it is to take a sell/short position without a trigger However, if you are risk-averse, wait for the candles to touch this zone, observe the price reaction, and only enter the position after receiving proper confirmation and a trigger signal.
The main targets are marked on the chart.
A daily candle close above the invalidation level will invalidate this analysis.
For risk management, please don't forget stop loss and capital management
When we reach the first target, save some profit and then change the stop to entry
Comment if you have any questions
Thank You
ZEC - Simple Flat Finished, $180+ NextZEC has likely bottomed out here, lower local time frames (1 hour) show an easily identifiable simple flat pattern that's likely just finished out. I cannot long this at the moment as I do not have my trading computer w me, but this is an easy send, may even break $200 from here.
Because this is just a local count and is lacking the broader longer-term count, I can only give this Wave-Count Confidence: Average
Likely you can set a SL at the low we just made with sizeable leverage (not a good idea tho) @ $142
Lower time-frame wave-count for context:
