ZEC Ready for the Next Leg Up: Targets Raised to 540!Hey friends!
Even though my previous idea on ZCash was invalidated due to the breakdown of my invalidation zone, ZCash continues to demonstrate its strong intention to maintain the uptrend.
Moreover, the recent decline turned out to be a perfect bounce from the support zone, which confirms that we can expect ZEC to push even higher than my previous targets.
In my last post, I was confident we’d see ZCash at 480 (with a stretch target of 510), but I had some doubts about the higher one.
Now those doubts are completely gone — I’m convinced we’ll hit 510 and likely go beyond.
I’m raising my targets!📈
🎯Targets:
• Target 1: 480
• Target 2: 510
• Target 3: 540
❌Invalidation zone: 430
If price breaks below this level, the bullish scenario is invalidated.
⚠️Always trade with proper stop-losses and manage your risk!
What do you think — ready for the next leg up? 🚀
Market insights

Zcash Breakout Long IdeaIf you're like me, you missed the "privacy coin" meta narrative that sent Zooko's Zcash CRYPTOCAP:ZEC (and to a lesser extent, monero CRYPTOCAP:XMR ) soaring to prices NOBODY had on their bingo cards.
I haven't traded either of these dino coins since 2019 and 2020, respectively, but here we are. I actually love the renewed interest in privacy because it's true to crypto's cypherpunk origins and fights back against increasing surveillance.
But if you didn't ape Zcash early, like me, you got woefully sidelined, waiting for THIS MOMENT, a better entry point (potentially).
ZEC has retraced and printed a nice double-bottom pattern and now a potential cup & handle beneath a key S/R level. I think this long gets a lot less risky if you wait for a break above resistance + confirmation of S/R flip around that $443 level. Of course, you might get front run and it could just take off, so don't get too cute with it.
While ZEC fully decoupled from the rest of the crypto market during it's epic rally, this trade is probably at least somewhat dependent on BTC's cooperation and continued rally as bulls fight to defend 90k and push higher. IF instead we see a continuation of the downtrend, I think the odds of Zcash rallying are significantly lower.
Potential target levels: $528, $572, $644 and I would keep a tight SL given the shaky market conditions.
happy trades,
CD

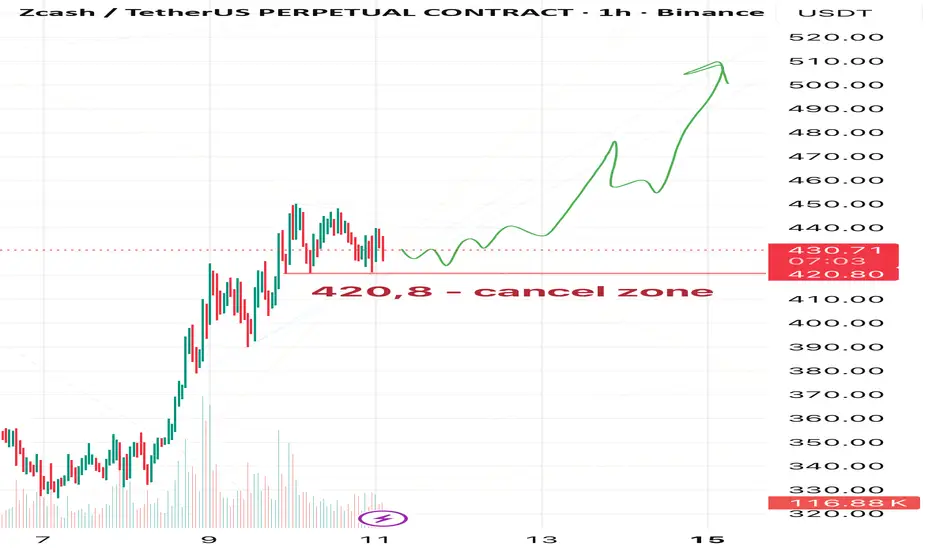
ZEC Breakout in Progress? Hey friends! How’s your trading going? Hope it’s going well and profitably! 🚀
Today I’m taking a look at Zcash (ZEC).
In my opinion, it looks pretty optimistic right now. I’m expecting upside from current levels.
🎯First target around 460,
🎯then 480,
and potentially 510 — but my main goal is 480 (I’ll keep 510 in parentheses for now).
❌Invalidation zone: 420.8 — if price touches this level, the plan gets canceled.
⚠️As always, this is just my personal view and not a trading signal. Trade responsibly, always use stops, and manage your risk!
Like, comment, and subscribe if you’d like to see more reviews on ZEC or other coins.
Let’s discuss in the comments — what do you think about ZEC? 📈
ZEC USDT SHORT SIGNAL---
📢 Official Trade Signal – ZEC/USDT
📉 Position Type: SHORT
💰 Entry Price: 442.33
---
🎯 Take-Profit Targets (Partial Exits):
• TP1: 428.46
• TP2: 415.37
• TP3: 407.28
• TP4: 398.00
---
🛑 Stop-Loss: 454.46
📊 Timeframe: 15m
⚖️ Risk/Reward Ratio: ≈ 3.65 (based on TP4)
💥 Suggested Leverage: 5× – 10×
---
🧠 Technical Analysis Summary
ZEC is exhibiting bearish momentum following a rejection from a key resistance area. The market structure on the 15-minute chart suggests a shift downward, with lower highs indicating increasing selling pressure. The identified take-profit levels align with projected liquidity zones and previous support areas.
The critical downside targets are:
428.46 → 415.37 → 407.28 → 398.00
A sustained break below TP1 (428.46) is expected to accelerate the move toward the subsequent targets.
---
⚙️ Trade Management Rules
✔ Take partial profits at each TP level
✔ Move stop-loss to entry point once TP1 is hit
✔ Trail stop-loss downward as price moves in your favor
✔ Do not re-enter if stop-loss (454.46) is triggered
✔ Confirm bearish structure on the chart before entering
---
📌 TradingView Hashtags
#ZECUSDT #ZEC #CryptoSignal #ShortTrade
#TradingView #FuturesTrading #TechnicalAnalysis
---
Let me know if you need any adjustments or a Persian version.

Next Target of ZECAs previous analysis of ZEC we saw bullish movement to 450. I think a little retracement need to continues going up . 2 point could be another Entry fo buy Setup As mentioned in the chart . The target I'm waiting is 550 for the next days .
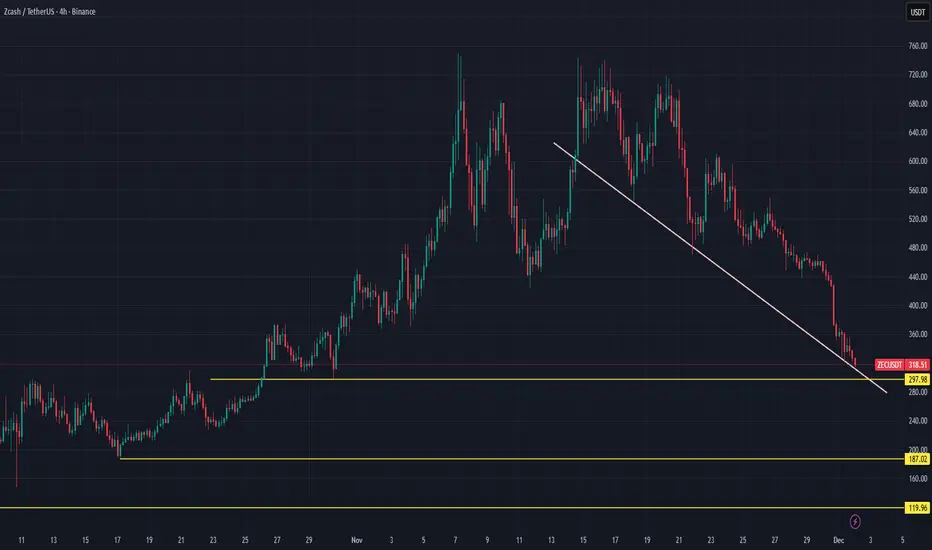
Lingrid | ZECUSDT Critical $300 Level Test After CorrectionBINANCE:ZECUSDT is stabilizing near the critical psychological $300 area after completing a sharp corrective move from the upper resistance zone. Price has reacted from long-term structural support aligned with the lower channel boundary, suggesting sellers are losing momentum after the extended sell-off. The current rebound signals early demand interest, although the market has not yet confirmed a full trend reversal.
As long as $300 continues to hold, the structure favors a gradual recovery or sideways consolidation before a larger move. A sustained bounce from this zone could push price back toward the broken range and descending trendline, turning the move into a corrective upside leg. However, bulls must reclaim key resistance levels to confirm strength beyond a relief rally.
➡️ Primary scenario: support holds above ~$300 → recovery toward mid-range resistance.
⚠️ Risk scenario: decisive breakdown below $300 invalidates the bullish setup and opens the path to deeper support.
If this idea resonates with you or you have your own opinion, traders, hit the comments. I’m excited to read your thoughts!

ZEC: Showing Strong Money FlowHey guys, ZEC is consolidating after an explosive +17.32% rally that took price from $332 to $425 in 24 hours. Now trading at $407.75, we're watching to see if bulls can digest these gains and push for another leg or if we're due for a retracement.
The technical setup leans bullish with strong trend confirmation. ADX at 69.4 signals legitimate momentum, MACD shows a bullish crossover, and price sits above all major EMAs (EMA20 $388, EMA50 $369, EMA200 $378). RSI at 69.1 approaches overbought but still has room, while MFI at 76.9 shows strong money flow despite current volume sitting below average.
Key levels to watch: immediate support at EMA20 $388.31 backed by BB middle band $384.02, with critical support at EMA50 $369.27. Resistance comes in at the 24h high $425.00, then BB upper band $432.08. The 52.6% upper wick signals rejection near $425, making that our key breakout level.
Trading setup: entries $400-$410 zone, stop below EMA20 at $388, targets $425/$445/$465 offering 2.1:1 to 4.2:1 risk/reward. The trend structure shows higher lows (bullish) but also lower highs (bearish), creating compression that typically resolves with a strong move. With 80% confidence and strong buy signals, this looks like a solid momentum continuation play if $388 support holds. How are you playing this move?

$ZEC Pumps, $BTC Dumps — Classic MoveZcash has dropped nearly 54% from the November 15 analysis, when it was trading around $640. We anticipated the breakdown as it broke its parabolic curve, but despite the pullback, ZEC continues to show relative strength compared to the broader market.
A new proposal to replace its old static fee model with a dynamic system is driving renewed interest. This upgrade arrives alongside increased regulatory attention on privacy.
Developers are rolling out a congestion-fee mechanism, and Grayscale is working to transition its ZEC Trust into an ETF — a shift that could attract more institutional flows. With institutions revisiting privacy tech, the key question is whether ZEC can maintain its edge under growing scrutiny.
Technically, whenever ZEC rallies, BTC tends to dip — almost a perfect inverse correlation at times, and price is now hovering around $430. A push toward $460–$470 looks likely, and if it can defend the $380 zone, a retest of $520–$550 is still on the table. If $380 fails, downside opens toward $350–$330.

ZEC - From Exhaustion to Expansion!!!📉ZEC spent days trapped in a clear bearish phase on the left side of the chart, forming lower lows and lower highs. But everything changed once price tapped the major swing low, where buyers stepped in aggressively.
📈Since then, ZEC has been respecting a new rising channel , shifting the market structure from bearish to bullish. As long as price remains inside this channel, the bulls remain in control.
We will be looking for longs around the intersection of:
- the lower blue trendline, and
- the most recent higher-low zone
🏹This is where buyers have consistently reacted before, and where the next bullish impulse could start.
If this structure holds, ZEC may push toward the upper boundary of the channel once again.
Do you think ZEC is gearing up for another leg up? Let me know below 👇
⚠️ Disclaimer: This is not financial advice. Always do your own research and manage risk properly.
📚 Stick to your trading plan regarding entries, risk, and management.
Good luck! 🍀
All Strategies Are Good; If Managed Properly!
~Richard Nasr

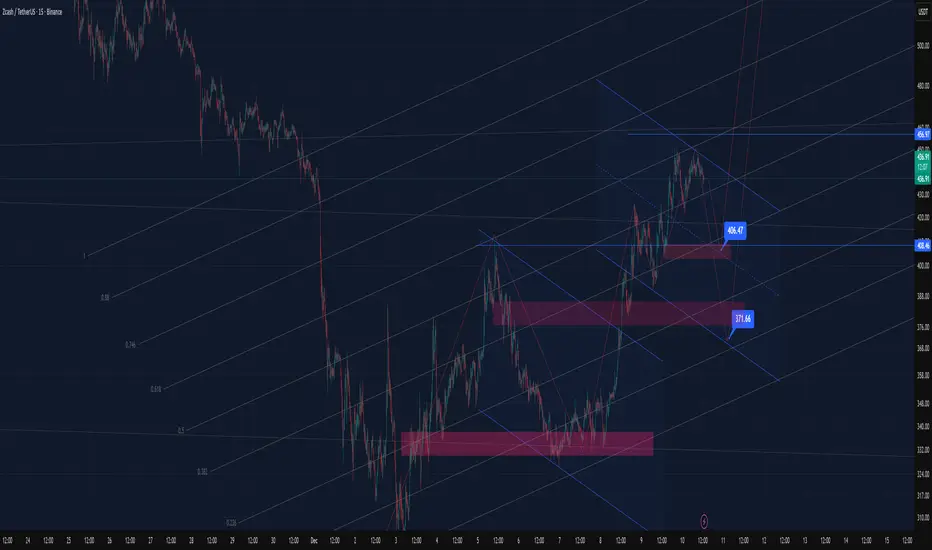
LET'S TEST OUR LUCKI opened a short position based on the overall idea I mentioned earlier. On the mid-timeframe, a very large bearish pattern is forming, and price is moving cleanly within a temporary upward channel. Now it’s just a matter of time to see how lucky I am.

#ZEC/USDT – Potential Long Setup at Key Fibonacci Level#ZEC
The price is moving in a descending channel on the 1-hour timeframe. It has reached the lower boundary and is heading towards breaking above it, with a retest of the upper boundary expected.
We have a downtrend on the RSI indicator, which has reached near the lower boundary, and an upward rebound is expected.
There is a key support zone in green at 296. The price has bounced from this zone multiple times and is expected to bounce again.
We have a trend towards stability above the 100-period moving average, as we are moving close to it, which supports the upward move.
Entry price: 334
First target: 352
Second target: 386
Third target: 430
Don't forget a simple principle: money management.
Place your stop-loss below the support zone in green.
For any questions, please leave a comment.
Thank you.

ZEC UpdateZEC Update:
The $440 level is the key daily breaker that needs to be reclaimed for any meaningful bullish shift.
Before that, I’m watching the $430 zone — expecting price to reject from there as it aligns with structure and previous displacement.
Most likely play:
Tap $430→ rejection → eventually target $440 breaker for confirmation.
Let’s see how price reacts.

Long ZEC — Tiptoeing Through TA - SEC to Decide its FateZEC is crawling back from a major pullback, forming a short-term higher-low structure that almost looks confident. Momentum is improving, but let’s not pretend anything is certain with what’s coming.
Key levels:
Support: 365 → 346 → 326
Demand zone: 385–405 (where buyers magically reappear… usually)
Resistance: 418, then 497, with major supply at 525–580.
Macro helps, with markets expecting an interest-rate cut — because central banks famously love saving risk assets at the last second.
The main catalyst is the Dec 15 SEC Roundtable on Financial Surveillance & Privacy, featuring Zooko Wilcox plus teams from Aleo, Espresso, and SpruceID. Whether regulators decide privacy tech is innovative or terrifying will set the tone. No pressure.
Price stays above demand, but direction remains undetermined until the event. Expect spikes of volatility in the days and even hours leading up to it — traders love drama. A constructive tone could extend the recovery; a restrictive tone risks a clean drop back toward supports.

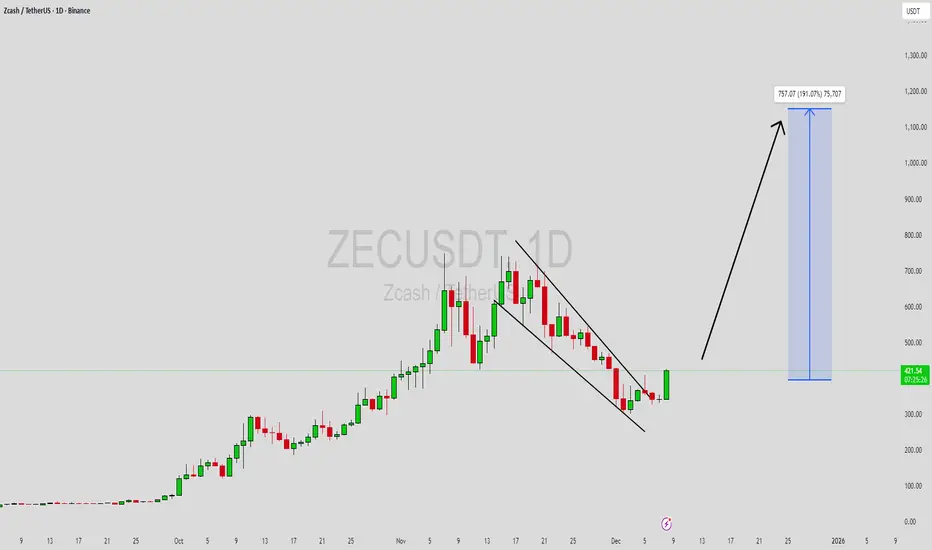
ZECUSDT Forming Falling WedgeZECUSDT is forming a clear falling wedge pattern, a classic bullish reversal signal that often indicates an upcoming breakout. The price has been consolidating within a narrowing range, suggesting that selling pressure is weakening while buyers are beginning to regain control. With consistent volume confirming accumulation at lower levels, the setup hints at a potential bullish breakout soon. The projected move could lead to an impressive gain of around 140% to 150% once the price breaks above the wedge resistance.
This falling wedge pattern is typically seen at the end of downtrends or corrective phases, and it represents a potential shift in market sentiment from bearish to bullish. Traders closely watching ZECUSDT are noting the strengthening momentum as it nears a breakout zone. The good trading volume adds confidence to this pattern, showing that market participants are positioning early in anticipation of a reversal.
Investors’ growing interest in ZECUSDT reflects rising confidence in the project’s long-term fundamentals and current technical strength. If the breakout confirms with sustained volume, this could mark the start of a fresh bullish leg. Traders might find this a valuable setup for medium-term gains, especially as the wedge pattern completes and buying momentum accelerates.
✅ Show your support by hitting the like button and
✅ Leaving a comment below! (What is your opinion about this Coin?)
Your feedback and engagement keep me inspired to share more insightful market analysis with you!
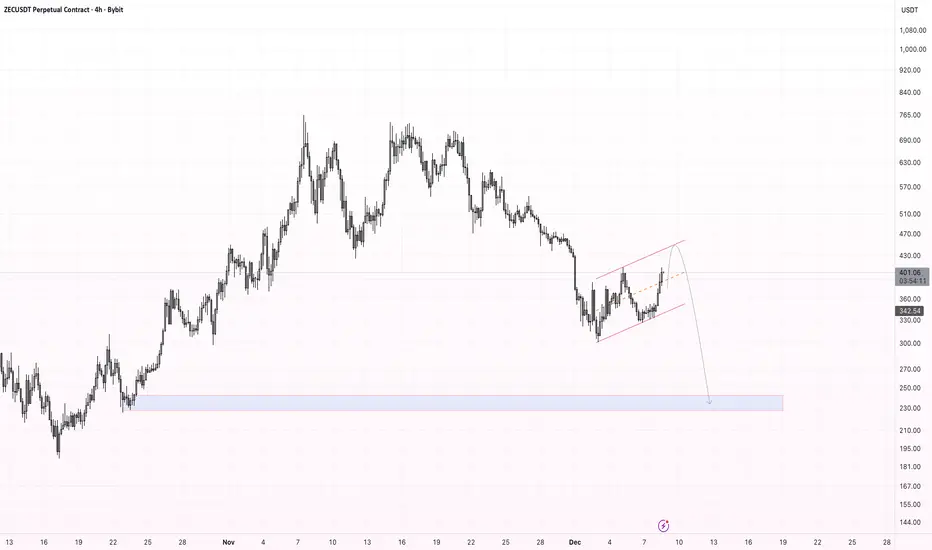
ZEC - forming a clear bearish flag on the 4H timeframe.After a strong impulsive sell-off, the price is consolidating inside an ascending channel, which typically acts as a continuation pattern in a downtrend.
There is still a chance that the market may retest the upper boundary of the flag, but as long as the structure remains intact, the bearish scenario is more likely to play out.
My main target for the next leg down is the $ 240–$230 demand zone, where previous liquidity and support levels are located.
Summary:
Structure: Bearish flag (continuation pattern)
Possible move: Retest of upper channel resistance before reversal
Bearish target: $240–$230
If the flag breaks downward with momentum, continuation of the larger downtrend becomes highly probable.
Today Entry buy setup for ZEC New york sessionI think Today in the New York session Price will be up . and another Entry for ZEC is about 370 to the target 450 .Actually is poling Back to the top of Tokyo session and then go Up and then price is resting. Let see How My Sixth Sense for price prediction.

$ZEC 4HBINANCE:ZECUSDT.P 4H
Clear Double-Bottom structure forming with neckline resistance ahead.
A confirmed breakout and retest of the neckline would validate bullish continuation.
Setup remains valid as long as the two lows hold.
#ZEC #Zcash

ZEC more correction to the downside %28 toward 222$Hi the support and resistances on the chart are based on the previous data and weekly candlesticks if BINANCE:ZECUSDT holds this last support the potential of 28% gain is logical toward $222

ZEC - HYPE IS OVERPrivacy narrative Hype is over on CRYPTOCAP:ZEC 🚨
Money rotation ongoing & HTF momentum is shifting.
After the 2000%+ bull wave, Seeing Another 20 to 40% bearish correction wave looks more than realistic📉

ZEC - BEARISHI warned you many time for CRYPTOCAP:ZEC that the top was probably around the 720$! I shorted this level, also.
Money rotation ongoing -Current price is down 60% from the exact top! 😱
300$ level touched ✅ + That was also the lower level/support I shared in my stream!
What to expect then: 🔴
H4 --> Stuck in a Strong bearish downtrend 📉
Likely a bearish continuation - sell of might continue. (early buyers booking profits exiting liquidities/profits from the previous HYPE)📉
Daily breakout & retest confirmed - suggesting that the main trend shifted from bulls to bear
According to my lines, prices might continue to fall toward the 185 - 200$ level corresponding to the 0.786 fib level from the high to top of the previous 2000%+ bull wave!
🎯Key resistances to be break:
400$ - 410$ resistances & downtrend daily
🎯Lower key supports:
310 - 300$ --> 250 - 212 - 188$ - 180$

ZEC is dancing on thin support lineZec was not able to pass its yearly ATH level (750), with the market worries and privacy hype losing power dropped down below upper trendline and came to the downward trendline support, below the support price can retrace till to 220-230 usdt level. On the upside resistance zone will be around 400-410 level
ZECUSDT Forming Falling WedgeZECUSDT is forming a clear falling wedge pattern, a classic bullish reversal signal that often indicates an upcoming breakout. The price has been consolidating within a narrowing range, suggesting that selling pressure is weakening while buyers are beginning to regain control. With consistent volume confirming accumulation at lower levels, the setup hints at a potential bullish breakout soon. The projected move could lead to an impressive gain of around 90% to 100% once the price breaks above the wedge resistance.
This falling wedge pattern is typically seen at the end of downtrends or corrective phases, and it represents a potential shift in market sentiment from bearish to bullish. Traders closely watching ZECUSDT are noting the strengthening momentum as it nears a breakout zone. The good trading volume adds confidence to this pattern, showing that market participants are positioning early in anticipation of a reversal.
Investors’ growing interest in ZECUSDT reflects rising confidence in the project’s long-term fundamentals and current technical strength. If the breakout confirms with sustained volume, this could mark the start of a fresh bullish leg. Traders might find this a valuable setup for medium-term gains, especially as the wedge pattern completes and buying momentum accelerates.
✅ Show your support by hitting the like button and
✅ Leaving a comment below! (What is your opinion about this Coin?)
Your feedback and engagement keep me inspired to share more insightful market analysis with you!

ZECUSDT 6H#ZEC is moving inside a falling wedge on the 6H timeframe chart. After a heavy correction, it seems to have recovered and is now pressing against the wedge resistance. This is a risky coin, and it could get rejected here and revisit the support level again — which aligns with the lower Bollinger Band as well. You can consider buying a small bag here and another position near the support. In case of a breakout above the wedge, the potential targets are:
🎯 $456.72
🎯 $504.78
🎯 $552.83
🎯 $621.25
🎯 $708.41
⚠️ Always remember to use a tight stop-loss and maintain proper risk management.
