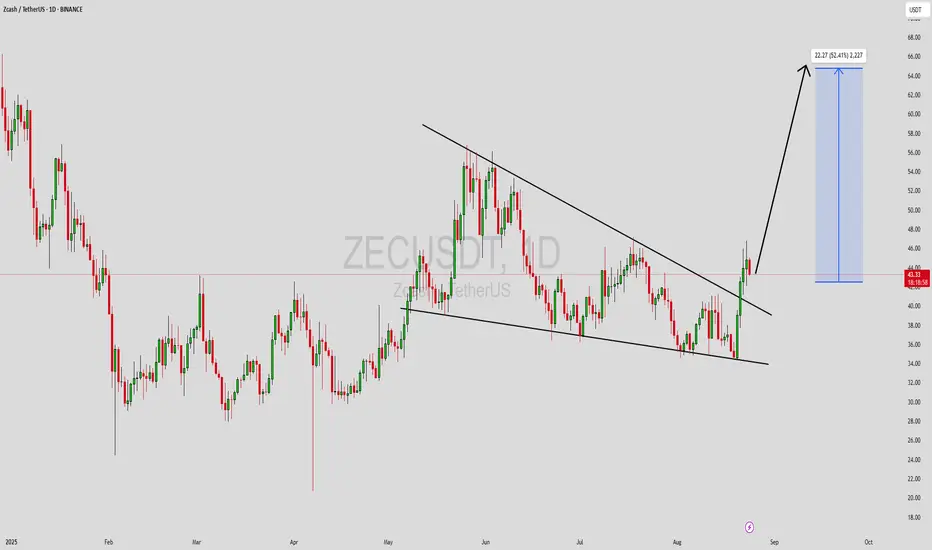
Zcash with Leverage? 336% Easy Higher High Profits PotentialZcash has been in a rising trend for years and this pattern is set to continue. Looking at the daily timeframe, today we have a full green candle coupled with rising volume. ZECUSDT is ready to produce a bullish continuation, the resumption of the long-term uptrend.
The retrace lasted almost three
Related pairs

The key is whether it can find support near 44.46 and rise
Hello, fellow traders.
Follow us to get the latest information quickly.
Have a great day.
-------------------------------------
(ZECUSDT 1M chart)
It appears to have broken away from the long-term downtrend line (1).
However, to initiate an uptrend, the price must remain above the M-Signal ind

ZECUSDT 1D#ZEC has broken above the falling wedge but was rejected from the SMA100 on the daily chart. Consider buying some #ZEC near the support. In case of a successful bounce, the potential targets are:
🎯 $44.54
🎯 $46.92
🎯 $50.31
🎯 $54.63
⚠️ As always, use a tight stop-loss and apply proper risk manageme

ZECUSDT Forming Bullish WaveZECUSDT is showing a bullish wave pattern on the charts, which is typically a continuation signal that highlights strong buying momentum building up in the market. After a period of consolidation, the price appears to be preparing for another upward move, and the bullish wave formation suggests that
ZECUSDT UPDATE#ZEC
UPDATE
ZEC Technical Setup
Pattern : Bullish Wave pattern
Current Price: $43.49
Target Price: $69.50
Target % Gain: 61%
Technical Analysis: ZEC has broken out of the falling wedge on the 1D chart with strong bullish momentum. The breakout candle closed above trendline resistance, confirming

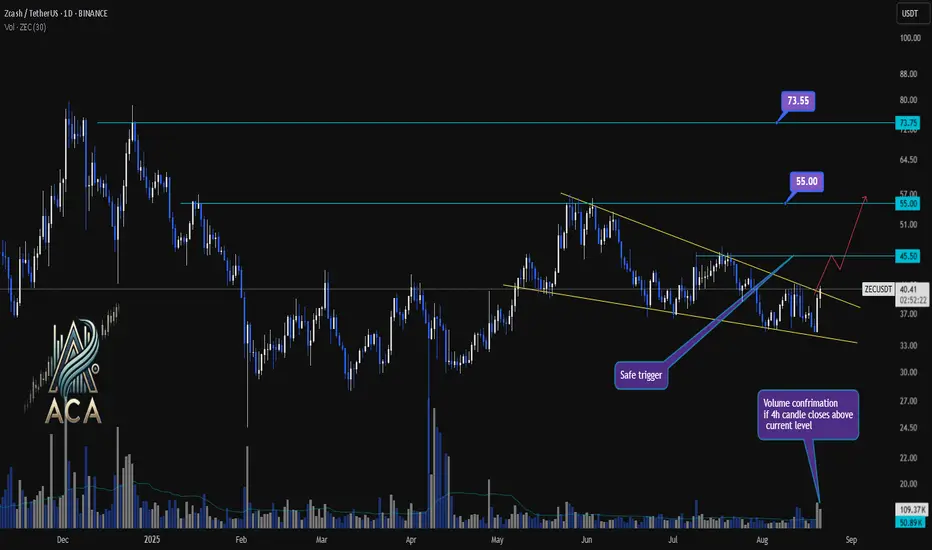
ZCASH Wave Analysis – 21 August 2025
- ZCASH broke daily Falling Wedge
- Likely to rise to resistance level 43.15
ZCASH cryptocurrency recently reversed from the support area between the support level 34.30 (which has been reversing the price from May) and the lower daily Bollinger Band.
The upward reversal from the support level 34

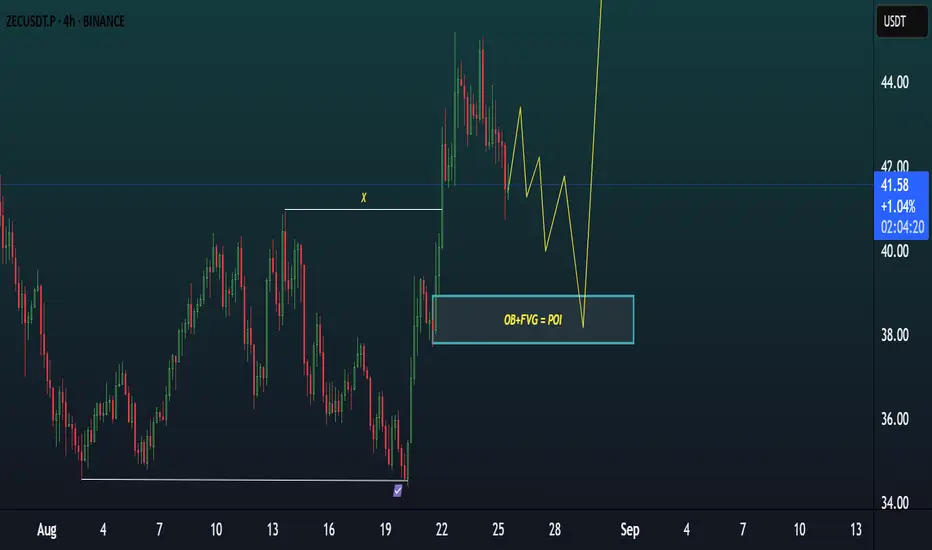
ZECUSDT TRADE IDEA.ZECUSDT | 4H Bullish Setup
🔑 Key Structure: Bullish BOS confirmed, liquidity sweep done.
🟦 POI Level: OB + FVG confluence around $38–39 (strong demand zone).
📉 Current Price: 41.5 — pulling back after recent rally.
📊 Trade Plan: Expect retrace into demand zone before bullish continuation. Watc
ZECUSDT Daily Chart Analysis | Symmetrical Triangle BO WatchZECUSDT Daily Chart Analysis | Symmetrical Triangle Breakout Watch
🔍 Let’s dissect the ZEC/USDT daily chart, where price action is nearing a pivotal breakout from a symmetrical triangle—often a precursor to major moves when combined with rising volume.
⏳ Daily Chart Overview
Zcash has been conso

ZEC has gained momentum relative to XMR, up 90 points todayXMR is experiencing a 51% attack
ZEC is a similar project. ZEC is supported by thorchain. Is it time for us to become ZCASH bulls?

See all ideas
Summarizing what the indicators are suggesting.
Oscillators
Neutral
SellBuy
Strong sellStrong buy
Strong sellSellNeutralBuyStrong buy
Oscillators
Neutral
SellBuy
Strong sellStrong buy
Strong sellSellNeutralBuyStrong buy
Summary
Neutral
SellBuy
Strong sellStrong buy
Strong sellSellNeutralBuyStrong buy
Summary
Neutral
SellBuy
Strong sellStrong buy
Strong sellSellNeutralBuyStrong buy
Summary
Neutral
SellBuy
Strong sellStrong buy
Strong sellSellNeutralBuyStrong buy
Moving Averages
Neutral
SellBuy
Strong sellStrong buy
Strong sellSellNeutralBuyStrong buy
Moving Averages
Neutral
SellBuy
Strong sellStrong buy
Strong sellSellNeutralBuyStrong buy
Displays a symbol's price movements over previous years to identify recurring trends.
Frequently Asked Questions
The current price of ZEC / Tether (ZEC) is 42.073 USDT — it has fallen −0.80% in the past 24 hours. Try placing this info into the context by checking out what coins are also gaining and losing at the moment and seeing ZEC price chart.
ZEC / Tether price has risen by 14.16% over the last week, its month performance shows a 3.70% increase, and as for the last year, ZEC / Tether has decreased by −2.11%. See more dynamics on ZEC price chart.
Keep track of coins' changes with our Crypto Coins Heatmap.
Keep track of coins' changes with our Crypto Coins Heatmap.
ZEC / Tether (ZEC) reached its highest price on May 12, 2021 — it amounted to 372.079 USDT. Find more insights on the ZEC price chart.
See the list of crypto gainers and choose what best fits your strategy.
See the list of crypto gainers and choose what best fits your strategy.
ZEC / Tether (ZEC) reached the lowest price of 15.400 USDT on Apr 13, 2024. View more ZEC / Tether dynamics on the price chart.
See the list of crypto losers to find unexpected opportunities.
See the list of crypto losers to find unexpected opportunities.
The safest choice when buying ZEC is to go to a well-known crypto exchange. Some of the popular names are Binance, Coinbase, Kraken. But you'll have to find a reliable broker and create an account first. You can trade ZEC right from TradingView charts — just choose a broker and connect to your account.
Crypto markets are famous for their volatility, so one should study all the available stats before adding crypto assets to their portfolio. Very often it's technical analysis that comes in handy. We prepared technical ratings for ZEC / Tether (ZEC): today its technical analysis shows the buy signal, and according to the 1 week rating ZEC shows the buy signal. And you'd better dig deeper and study 1 month rating too — it's neutral. Find inspiration in ZEC / Tether trading ideas and keep track of what's moving crypto markets with our crypto news feed.
ZEC / Tether (ZEC) is just as reliable as any other crypto asset — this corner of the world market is highly volatile. Today, for instance, ZEC / Tether is estimated as 1.93% volatile. The only thing it means is that you must prepare and examine all available information before making a decision. And if you're not sure about ZEC / Tether, you can find more inspiration in our curated watchlists.
You can discuss ZEC / Tether (ZEC) with other users in our public chats, Minds or in the comments to Ideas.