ZKUSDTCryptocurrency Futures Market Disclaimer 🚨🚨🚨
Trading cryptocurrency futures involves high risks and is not suitable for all investors.
Cryptocurrency prices are highly volatile, which can lead to significant gains or losses in a short period.
Before engaging in crypto futures trading, consider your risk tolerance, experience, and financial situation.
Risk of Loss: You may lose more than your initial capital due to the leveraged nature of futures. You are fully responsible for any losses incurred.
Market Volatility: Crypto prices can fluctuate significantly due to factors such as market sentiment, regulations, or unforeseen events.
Leverage Risk: The use of leverage can amplify profits but also increases the risk of total loss.
Regulatory Uncertainty: Regulations related to cryptocurrencies vary by jurisdiction and may change, affecting the value or legality of trading.
Technical Risks: Platform disruptions, hacking, or technical issues may result in losses.
This information is not financial, investment, or trading advice. Consult a professional financial advisor before making decisions. We are not liable for any losses or damages arising from cryptocurrency futures trading.
Note: Ensure compliance with local regulations regarding cryptocurrency trading in your region.
thanks for like and follow @ydnldn
ZKUSDT.P trade ideas
VETUSDTCryptocurrency Futures Market Disclaimer 🚨🚨🚨
Trading cryptocurrency futures involves high risks and is not suitable for all investors.
Cryptocurrency prices are highly volatile, which can lead to significant gains or losses in a short period.
Before engaging in crypto futures trading, consider your risk tolerance, experience, and financial situation.
Risk of Loss: You may lose more than your initial capital due to the leveraged nature of futures. You are fully responsible for any losses incurred.
Market Volatility: Crypto prices can fluctuate significantly due to factors such as market sentiment, regulations, or unforeseen events.
Leverage Risk: The use of leverage can amplify profits but also increases the risk of total loss.
Regulatory Uncertainty: Regulations related to cryptocurrencies vary by jurisdiction and may change, affecting the value or legality of trading.
Technical Risks: Platform disruptions, hacking, or technical issues may result in losses.
This information is not financial, investment, or trading advice. Consult a professional financial advisor before making decisions. We are not liable for any losses or damages arising from cryptocurrency futures trading.
Note: Ensure compliance with local regulations regarding cryptocurrency trading in your region.
thanks for like and follow @ydnldn
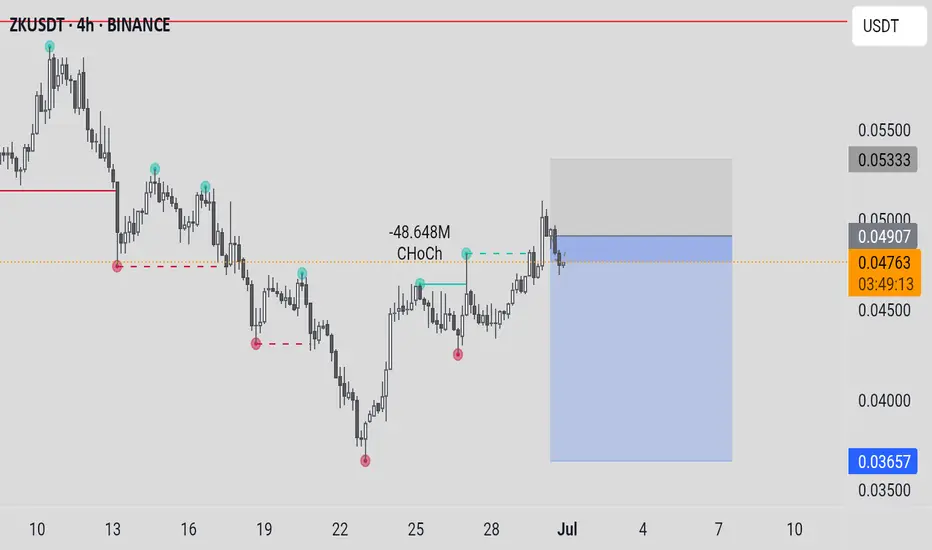
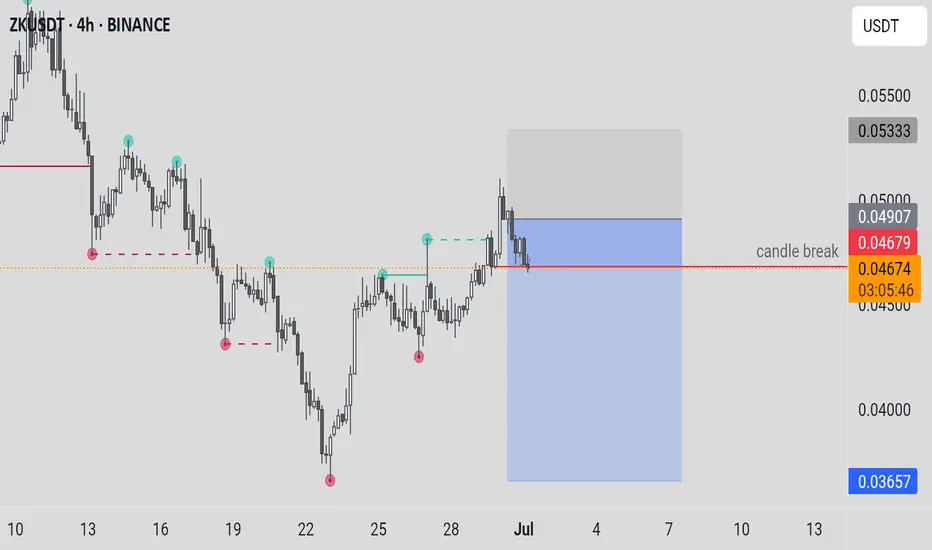
ZK USDTif zk broke the resistance upper red line
it will boost the price to get the big profit.
Don't buy now just keep eye on it.
wait for broke and retest the level again then enter into trade.
ZKUSDT 2D AnalysisZK ~ 2D Analysis
#ZK This trade is very risky, buy if you still have confidence in this coin with a short term target of at least 15%+ from here.

Need to be careful.A new downward wave may occur. Need to pay attention.
The market is very enthusiastic about Ethereum, we need to be cautious in these exciting moments.
* The purpose of my graphic drawings is purely educational.
* What i write here is not an investment advice. Please do your own research before investing in any asset.
* Never take my personal opinions as investment advice, you may lose your money.
ZK/USDT Buy the Silence?A familiar cycle:
▪️ Hype peak
▪️ -80%+ crash
▪️ Silence
▪️ Consolidation
We're likely somewhere between phase 3 and 4.
Retail has moved on. Volume is dead.
But the chart is quietly forming a structure.
This is when real positions are built — the kind people tweet about after the breakout.
While ETH is stuck in sideways motion, L2 narratives remain asleep.
But not forever.
Sooner or later, big players will return to the scalability game.
And when they do — low-cap L2 tokens like this one get their second chance.
The only question is:
Will you be the one who sold the bottom,
or the one who bought the silence?

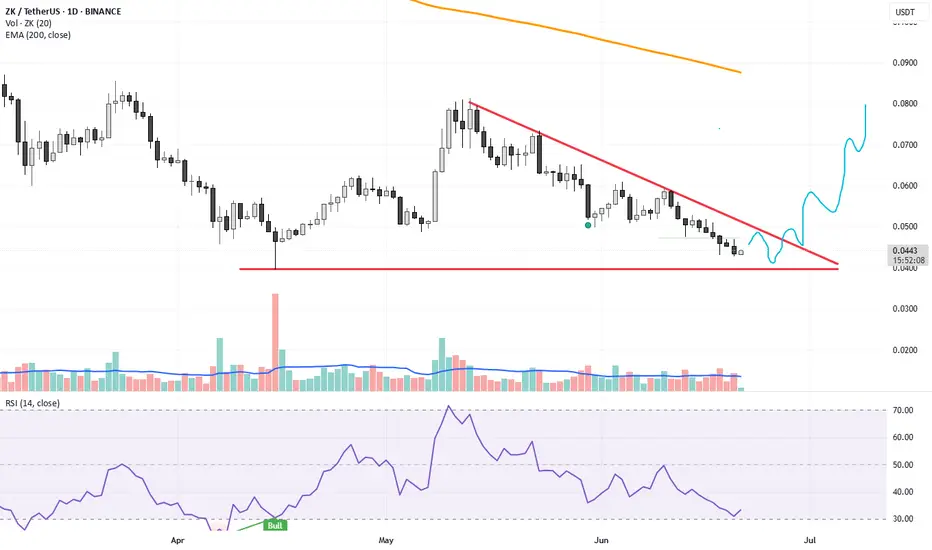
ZKUSDT breakdown alertZKUSDT breakdown alert
ZKUSDT has broken down from a triangle pattern, signaling potential bearish momentum. The price has slipped below the triangle’s lower support line, suggesting that sellers are gaining control and further downside could follow if the move holds.
This kind of pattern breakdown often leads to increased volatility and downward continuation. However, if ZKUSDT reclaims the breakdown zone quickly, it might invalidate the move and trap late sellers.
Key levels to monitor:
* Breakdown zone (previous support)
* Immediate lower support areas
* Volume confirmation
Watch closely — if the breakdown holds, ZK could continue its decline in the coming sessions.

ZKUSDT 1D AnalysisZK ~ 1D Analysis
#ZK Buy incrementally on retest of this support block with short term target of at least 15%+ from here and long term target of $0.2727

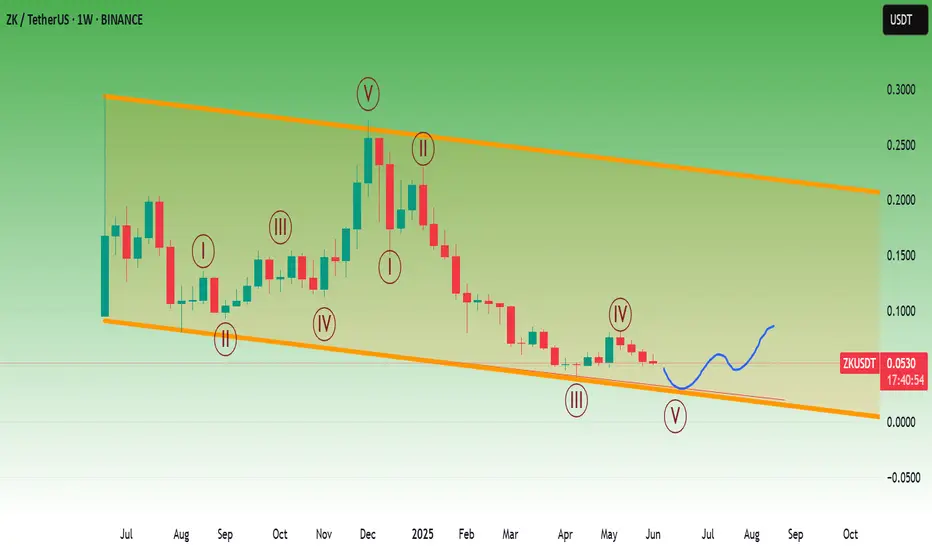
long term sideways movement, good potential next bull runlong term sideways movement, good potential next bull run

ZK Aanalysis (12H)After forming a 3D bottom, the price moved upward with a strong and rapid bullish wave that was stronger than the previous bullish waves within the bearish move, reclaiming a key zone. Additionally, an important trigger line has been broken, which strengthens the bullish outlook on ZK.
We are looking for buy/long positions within the green zone toward the targets. The targets are marked on the chart.
A daily candle closing below the invalidation level will invalidate this analysis.
For risk management, please don't forget stop loss and capital management
Comment if you have any questions
Thank You

ZK Secondary trend.-82% Wedge. Reversal zones. 01 05 2025Logarithm. Time frame 3 days. Decrease from listing about -82%. For cryptocurrencies of such liquidity and capitalization, this is not the maximum decrease (-90-96%). But sometimes from such values as now (-82-85%), taking into account the news hype during the listing "whales $ 458 million", a reversal and strong pumping can occur under the market as a whole. For example, like another hype project of "hanging noodles" - Flare (distributed to XRP holders). Decrease by -82% and then pumping slightly above the listing price under the next alt season of the cycle + 560%.
This does not necessarily mean that this will happen, this is an example of what happens from such values of decline with such liquidity and hype. In some ways, not only in the structure of the TA formation, but in the hype and disappointment of "investors", the projects are identical.
Main trend , and the previously shown zone, in which the price is now.
ZkSync Main trend. L2 for ETH. $458 million funds 21 02 2025
Main trend now in the moment (full trading history).
There is no need to guess the minimums and maximums. It is important to know these zones and have an acceptable average price, from the position of the trend and its potential. It is regulated by the distributed entry volume (in advance) at potential reversal zones.

Zkusdt trade opportunityZK has completed a 1:1 Bear Pennant Breakdown, perfectly meeting its projected downside target with a -72.83% measured move. This confirms the exhaustion of the previous bearish leg and sets the stage for a potential bullish reversal.
With the bear cycle target achieved, bulls are now likely to regain control. The Buy Accumulation Zone highlighted on the chart serves as a high-probability region for re-entry, especially as market sentiment begins to shift.
For bullish continuation to validate, we need to see a clean break above the Immediate Resistance Zone. Once that occurs, price may accelerate toward the short-term, mid-term, and higher-term targets as indicated:
🔹 Short-Term Target: 0.0833
🔹 Mid-Term Target: 0.1446
🔹 High-Term Target: 0.2323
Momentum will likely strengthen with each structural confirmation. For now, the focus remains on accumulation and observing price behavior near the 0.0595 level.
This is a scenario to track closely ZK is now transitioning from distribution into early signs of recovery.

ZKUSDT 2D AnalysisZK ~ 2D Analysis
#ZK Buy back from here with a short -term target of at least 15%+ from here.

ZK/USDTKey Level Zone: 0.05470 - 0.05570
HMT v8.1 detected. The setup looks promising, supported by a previous upward/downward trend with increasing volume and momentum, presenting an excellent reward-to-risk opportunity.
HMT (High Momentum Trending):
HMT is based on trend, momentum, volume, and market structure across multiple timeframes. It highlights setups with strong potential for upward movement and higher rewards.
Whenever I spot a signal for my own trading, I’ll share it. Please note that conducting a comprehensive analysis on a single timeframe chart can be quite challenging and sometimes confusing. I appreciate your understanding of the effort involved.
Important Note :
Role of Key Levels:
- These zones are critical for analyzing price trends. If the key level zone holds, the price may continue trending in the expected direction. However, momentum may increase or decrease based on subsequent patterns.
- Breakouts: If the key level zone breaks, it signals a stop-out. For reversal traders, this presents an opportunity to consider switching direction, as the price often retests these zones, which may act as strong support-turned-resistance (or vice versa).
My Trading Rules
Risk Management
- Maximum risk per trade: 2.5%.
- Leverage: 5x.
Exit Strategy
Profit-Taking:
- Sell at least 70% on the 3rd wave up (LTF Wave 5).
- Typically, sell 50% during a high-volume spike.
- Adjust stop-loss to breakeven once the trade achieves a 1.5:1 reward-to-risk ratio.
- If the market shows signs of losing momentum or divergence, ill will exit at breakeven.
The market is highly dynamic and constantly changing. HMT signals and target profit (TP) levels are based on the current price and movement, but market conditions can shift instantly, so it is crucial to remain adaptable and follow the market's movement.
If you find this signal/analysis meaningful, kindly like and share it.
Thank you for your support~
Sharing this with love!
HMT v2.0:
- Major update to the Momentum indicator
- Reduced false signals from inaccurate momentum detection
- New screener with improved accuracy and fewer signals
HMT v3.0:
- Added liquidity factor to enhance trend continuation
- Improved potential for momentum-based plays
- Increased winning probability by reducing entries during peaks
HMT v3.1:
- Enhanced entry confirmation for improved reward-to-risk ratios
HMT v4.0:
- Incorporated buying and selling pressure in lower timeframes to enhance the probability of trending moves while optimizing entry timing and scaling
HMT v4.1:
- Enhanced take-profit (TP) target by incorporating market structure analysis
HMT v5 :
Date: 23/01/2025
- Refined wave analysis for trending conditions
- Incorporated lower timeframe (LTF) momentum to strengthen trend reliability
- Re-aligned and re-balanced entry conditions for improved accuracy
HMT v6 :
Date : 15/02/2025
- Integrated strong accumulation activity into in-depth wave analysis
HMT v7 :
Date : 20/03/2025
- Refined wave analysis along with accumulation and market sentiment
HMT v8 :
Date : 16/04/2025
- Fully restructured strategy logic
HMT v8.1 :
Date : 18/04/2025
- Refined Take Profit (TP) logic to be more conservative for improved win consistency

ZkSync Main Trend. L2 for ETH. $458 million funds 21 02 2025Logarithm. Time frame 3 days.
🟢Reversal zone. At the moment, there is a fractal repetition with the previous reversal zone. The logic and key local levels on which the direction of the secondary trend will depend are shown with arrows.
🔴Also showed the range and future levels of an unlikely extremely negative scenario. That is, a breakthrough of the long stop collection zone of a large squeeze (this happens very rarely, since it is irrational, but since in the news background earlier during the listing - funds of 458 million investments, then why not) and the formation of a capitulation channel under the channel with a full range (hold the chart and pull it down), or only from its median (dotted, more likely if we go this way).
Also, regardless of the implementation of scenario 1 or 2, the maximums of this cycle are shown (hold the chart and pull it up). Or rather, the zone. The percentage itself will be different, the "levels" of the zone, most likely, will not.

Is ZkSync ZK The Next OM and LUNA?Hello, Skyrexians!
Recently coins started to scam, like we have seen 90% for OM, 2 days ago there were bad news from $BINANCE:ZKUSDT. Why these news are good and this is not the same story we will try to cover today.
Since ZK has been listed it moves technically despite the low capitalization. On the daily time frame we can see the global Elliott waves picture - the irregular correction ABC. Now price is printing wave C which consists of 5 waves. Awesome oscillator gives us an idea where waves 3 and 4 have been finished and now we are in wave 5. We suppose this correction is over because we have the confirmed bullish reversal bar and we had the negative news next to the bottom. We suppose that crowd has been sold their coins into others and now rocket can be really empty.
Best regards,
Skyrexio Team
___________________________________________________________
Please, boost this article and subscribe our page if you like analysis!

ZKsync: Your Altcoin Choice (S2)ZKsync has been crashing and it keeps on crashing. Yesterday this pair produced the highest bearish volume ever on the daily timeframe and the highest since August 2024. This is likely the bottom.
The volume bar yesterday is just too big, it is completely out of proportion with the other bars. The last time this happened ZKUSDT started to grow. Believe it or not. I will take this as a bullish reversal signal.
A new All-Time Low. Bears are done, or could be done. This is a good entry point because of how the market behaved in the past. This is a potential bottom catch.
The main target here on this chart has a nice 787% potential for growth. This can be achieved soon, within a short six months. Huge potential for profits to be honest and the low is very risk. Since the pair is trading at bottom prices, it can't go much lower, the Altcoins market is already starting to turn. What one does, is exactly what the rest does as well.
Thank you for reading.
You can enter now, full force. Go ahead!
Namaste.

ZK Ready for next move up!TP 0.0881
SL 0.0694
Indicators are indicated that ZK is preparing for next impulse move!

Zk/USDT RSI Given the RSI in the past and now that I have drawn a line around it, history could repeat itself and a 240% move could occur. This is not a buy or sell signal, it is purely a personal analysis.

Trading opportunity for ZKUSDTBased on technical factors there is a Buy position in :
📊 ZKUSDT
🔵 Buy Now
🪫Stop loss 0.0635
🔋Target 0.0888
📏 R/R 2
💸RISK : 1%
We hope it is profitable for you ❤️
Please support our activity with your likes👍 and comments📝

Picked up some ZKFor a long time the price was in the ABC correction, at the moment we see all 5 descending waves. It would be great to see a local reversal and an uptrend.
The author's opinion may differ from yours,
Consider your risks,
DYOR.

ZKUSDT 2DZK ~ 2D Analysis
#ZK Buy gradually on this support block, if you still have a Conviction on this coin with a short -term target of at least 15%+.

#ZK/USDT#ZK
The price is moving in a descending channel on the 1-hour frame and is adhering to it well and is heading to break it upwards strongly and retest it
We have a bounce from the lower limit of the descending channel, this support is at a price of 0.0676
We have a downtrend on the RSI indicator that is about to break and retest, which supports the rise
We have a trend to stabilize above the moving average 100
Entry price 0.0729
First target 0.0792
Second target 0.0838
Third target 0.0896
