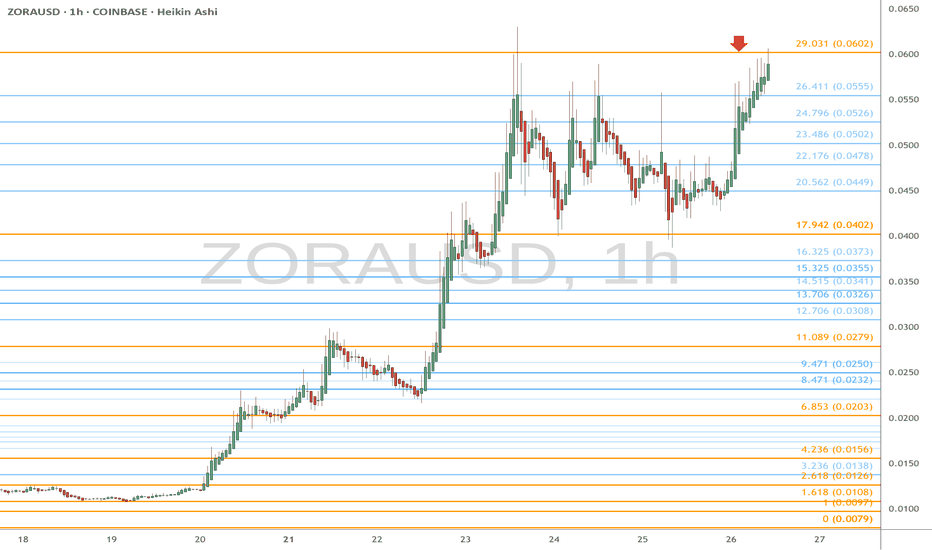
ZORA Long Setup Gem Hiding in the RoughZORA is shaping up as a key player in the next NFT 2.0 wave, fueled by Coinbase CEO Brian Armstrong and the growing momentum on Base. Strong support sits in the $0.014–$0.025 zone, making it an attractive area to buy dips.
The first profit target is $0.23–$0.61, with long-term potential toward the $5–$8 zone by 2025–2026 as NFT adoption accelerates.
This could be one of the standout plays in the NFT 2.0 cycle.
ZORA2USD trade ideas
ZORAUSD Breaks Resistance — Momentum Trade Setup Active“ 🔥”
✅ Key Price Levels from Your Chart:
Level Type Price
Entry (Breakout Zone) 0.08164
Stop Loss 0.08036
Target 1 0.08397
Target 2 0.08701
Extended Target 0.08800
🎯 Trade Idea (LONG Bias):
Entry: Price has broken through recent resistance (white/yellow zone) and is currently holding above it.
Stop Loss: Placed just below the previous consolidation zone and the breakout candle body, at 0.08036, offering logical invalidation.
Take Profit 1: At 0.08397, where price previously showed a reaction (marked in red).
Take Profit 2: At 0.08701, near the upper resistance zone.
Risk-to-Reward: Approx 1:2.5 — excellent R:R ratio for short-term scalps or swings.
📌 Observations:
Volume spike confirms breakout with strong buyer interest (8.72M volume).
Candle body closed strongly above previous resistance.
Momentum is clear, with consistent higher lows and strong upside candles.
No pattern needed — pure level-based breakout with clean upside targets.
⚠️ Risk Management Tips:
If price closes below 0.08036 on high volume, consider it invalidation.
Lock partial profits at 0.08397 to reduce risk and trail SL to breakeven.
Watch BTC/ETH direction — sudden reversals can drag ZORAUSD too.
🧠 Summary:
Breakout trade in progress
High volume + strong breakout candle
Excellent R:R with well-defined levels
Good for intraday to short swing trade
ZORA/USD MACD Bearish Crossover Signals Momentum ShiftZORA/USD has recently registered a negative crossover on the daily chart’s Moving Average Convergence Divergence (MACD) indicator. This occurs when the MACD line drops below the signal line, a well-known bearish setup that often points to weakening momentum.
The MACD is a widely used momentum tool that helps traders identify potential buy or sell opportunities by tracking the relationship between the MACD and signal lines. When the MACD line is above the signal line, it typically reflects bullish momentum and potential for continued upward price action.
However, with ZORA’s MACD now below the signal line and heading toward the zero mark, the setup indicates fading bullish pressure and the possibility of bears gaining control over the market in the near term.
ZORA Weakens as Sellers Take the LeadZORA is showing signs of bearish momentum, as the Balance of Power (BoP) indicator has flipped negative.
This shift indicates a clear drop in buying pressure, signaling that bulls are beginning to lose their grip on the market. At press time, the momentum indicator stands at -0.74, reinforcing the bearish sentiment.
With sellers gradually taking control, the path of least resistance appears to be to the downside. Traders should exercise caution and watch for further confirmation of a sustained downtrend.
Ask ChatGPT


