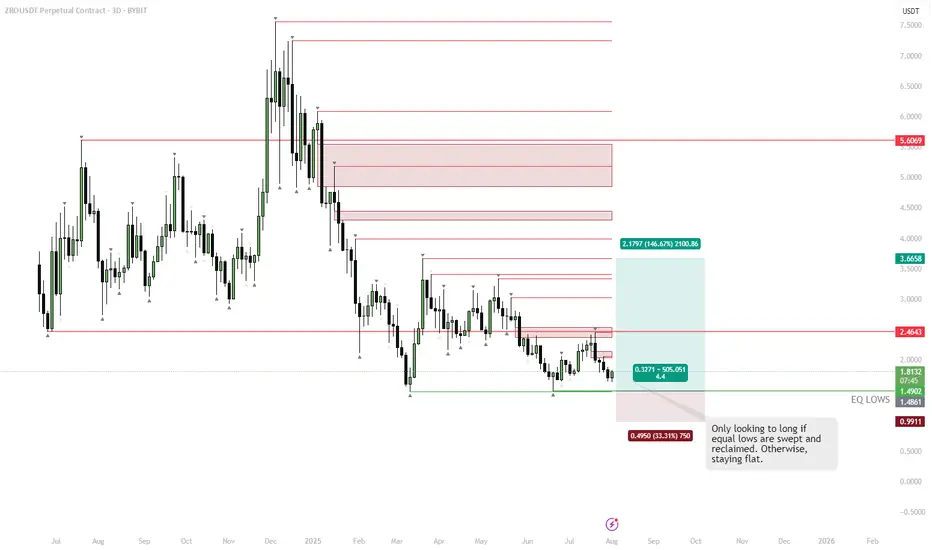
ZRO – Best SetupPrice is consolidating near key equal lows around $1.48–1.50. Liquidity likely sits below these lows, making a sweep into that zone attractive for larger players. Chasing longs here is risky without confirmation.
Plan:
• Wait for a clean sweep below the equal lows
• Look for a strong reclaim of the range back above $1.50 (failed breakdown)
• Entry trigger is confirmation of buyers stepping in after the sweep
If these conditions are met, targeting $2.46 and higher makes sense. No sweep/reclaim = no trade.
ZROUSDT trade ideas
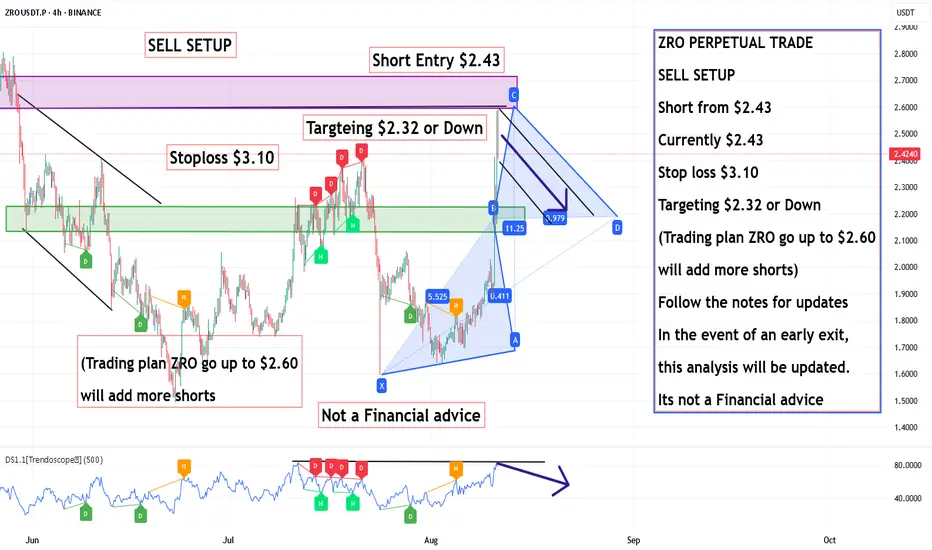
ZRO PERPETUAL TRADE , Short from $2.43ZRO PERPETUAL TRADE
SELL SETUP
Short from $2.43
Currently $2.43
Stop loss $3.10
Targeting $2.32 or Down
(Trading plan ZRO go up to $2.60
will add more shorts)
Follow the notes for updates
In the event of an early exit,
this analysis will be updated.
Its not a Financial advice
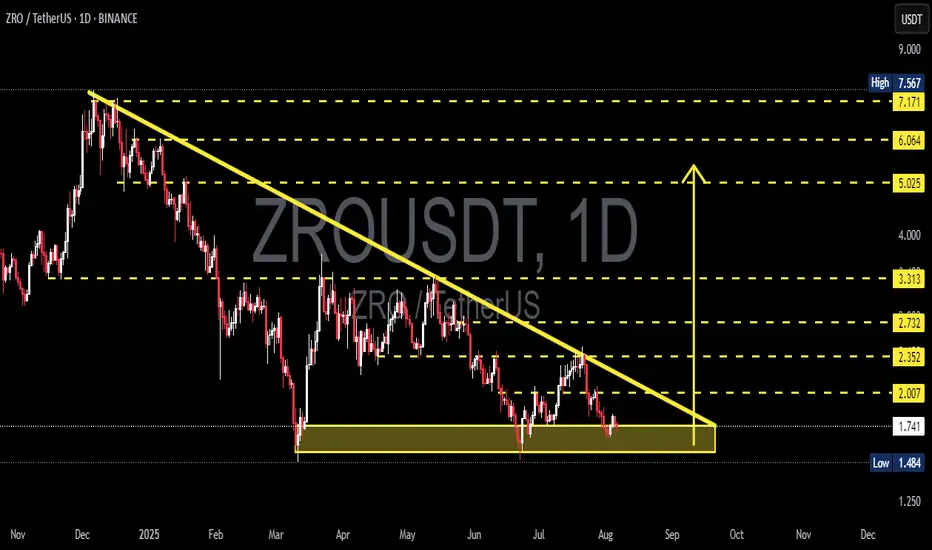
ZRO/USDT Coiled for a Major Move – Breakout or Breakdown?📌 Overview:
The ZRO/USDT pair is currently at a highly critical point. Price action has been consolidating within a large Descending Triangle for several months, and is now coiling near the apex — a classic signal of an incoming major move.
The strong support zone around 1.73 – 1.74 USDT has been tested multiple times and continues to hold, while the long-standing descending trendline from the all-time high acts as key dynamic resistance.
---
📊 Pattern & Market Structure Analysis:
🟡 Pattern: Descending Triangle
Flat horizontal support at ~1.73 USDT has acted as a demand zone.
Consistent lower highs suggest continued selling pressure and market indecision.
While typically a bearish continuation pattern, this setup can also lead to a bullish reversal breakout if resistance is breached with volume.
🧱 Key Support:
The highlighted yellow box shows clear accumulation, where buyers continue to defend the zone.
A breakdown below this support could trigger sharp downside movement and panic selling.
📉 Descending Resistance:
The downward sloping trendline is the critical breakout level.
A strong daily candle close above it would invalidate the bearish structure.
---
🚀 Bullish Scenario (Breakout):
If the price successfully breaks above the descending trendline with volume:
Short-term targets: 2.007 → 2.352 USDT
Mid-term targets: 2.732 → 3.313 USDT
Long-term bullish targets: 5.025 – 6.064 USDT and beyond
Additional confirmations: Volume spike, bullish RSI breakout, daily close above resistance.
---
🔻 Bearish Scenario (Breakdown):
If price fails to hold 1.73 USDT and breaks down:
Initial downside target: 1.484 USDT (historical support)
If that fails, ZRO may enter new low zones below 1.40
Breakdown with high volume would validate a strong bearish trend continuation.
---
🧠 Possible Strategies:
Breakout traders: Entry on daily candle close above descending trendline with volume.
Retest buyers: Wait for breakout, then enter on a successful retest of the trendline as new support.
Short sellers: Look for breakdown below 1.73 zone for short opportunities to 1.48 or lower.
Always use tight stop-loss based on volatility and support/resistance zones.
---
📈 Conclusion:
ZRO is at a make-or-break point. The market is coiling tightly within a Descending Triangle, and a massive move is likely just around the corner. Whether that move is up or down will depend on how price reacts to the descending trendline and the horizontal support.
Traders should stay alert and watch for either a confirmed breakout above the trendline, or a confirmed breakdown below the 1.73 USDT support level. The reaction here will set the tone for ZRO’s next big trend.
#ZRO #ZROUSDT #CryptoBreakout #TechnicalAnalysis #DescendingTriangle #AltcoinSetup #SupportAndResistance #CryptoChart #BreakoutWatch
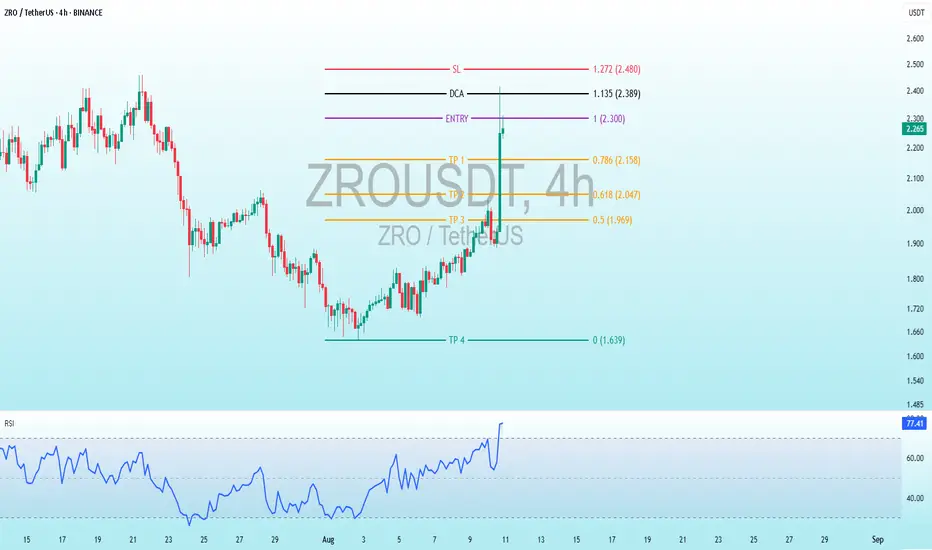
ZRO/USDT 4H Analysis: Breakout Potential with Overbought RSIBINANCE:ZROUSDT
Price Action and Key Levels
Timeframe: 4-hour (ZROUSDT.4h).
Current Price: As of the latest candle, the price appears to be around 2.292 USDT (based on the right-side price scale).
Historical Movement: The chart shows a significant downtrend from early July, followed by a recovery and recent consolidation around the 2.0–2.5 USDT range.
Support and Resistance:
SL (Stop Loss): Marked at 1.127 USDT (red line), indicating a potential exit point if the price drops further.
DCA (Dollar-Cost Averaging): Set at 2.389 USDT (black line), suggesting a level for additional buying.
Entry: Two entry levels are marked at 2.300 USDT (purple line) and 2.389 USDT (green line), indicating planned buy zones.
Take Profit (TP) Levels:
TP1: 0.786 (2.158 USDT, orange line).
TP2: 0.618 (2.047 USDT, orange line).
TP3: 0.5 (1.969 USDT, orange line).
TP4: 0.169 (1.649 USDT, green line).
These levels likely represent Fibonacci retracement or extension levels, with TP1–TP3 showing potential profit targets and TP4 a deeper support.
RSI Analysis
Indicator: The Relative Strength Index (RSI) is plotted at the bottom, with a scale from 0 to 100 and overbought (70) and oversold (30) levels marked.
Current RSI: Around 78.30, indicating the asset is in overbought territory as of the latest data point (late August).
Trend: The RSI has been rising sharply, suggesting strong bullish momentum, but the overbought condition may signal a potential reversal or consolidation soon unless supported by further price action.
Observations
The price is currently above the entry levels and near the TP1 zone, suggesting a profitable position if entered at the lower levels.
The overbought RSI could indicate a risk of a pullback toward the DCA or TP2 levels (around 2.0–2.1 USDT).
The chart reflects a trading strategy with predefined entry, exit, and profit-taking levels, likely based on technical analysis (e.g., Fibonacci or support/resistance).
Conclusion
The ZRO/USDT pair shows a recovery from its earlier lows, with the price nearing profit-taking zones and an overbought RSI suggesting caution. Monitoring for a potential pullback or breakout above current levels would be key.
Zrousdt buy opportunityZROUSDT has broken out from a falling wedge pattern, signaling a potential bullish reversal. The accumulation zone offers an attractive area for initiating long positions, with price structure and breakout momentum aligning to favor upside continuation. Monitoring volume confirmation and key resistance reactions will be critical for validating further bullish follow-through.
#ZRO/USDT#ZRO
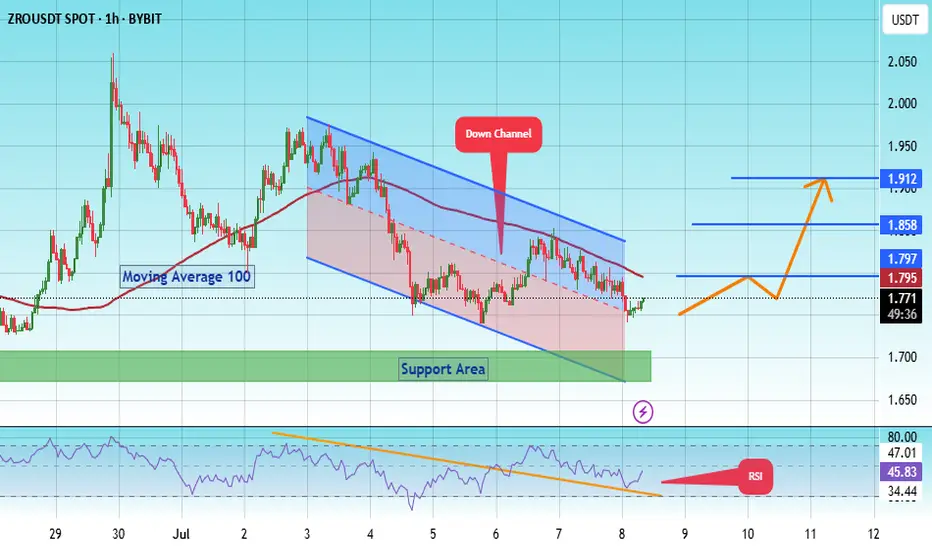
The price is moving within a descending channel on the 1-hour frame, adhering well to it, and is heading for a strong breakout and retest.
We have a bounce from the lower boundary of the descending channel, this support at 1.71.
We have a downtrend on the RSI that is about to be broken and retested, supporting the upside.
There is a major support area in green at 1.70, which represents a strong basis for the upside.
Don't forget a simple thing: ease and capital.
When you reach the first target, save some money and then change your stop-loss order to an entry order.
For inquiries, please leave a comment.
We have a trend to hold above the 100 Moving Average.
Entry price: 1.764
First target: 1.795
Second target: 1.858
Third target: 1.912
Don't forget a simple thing: ease and capital.
When you reach the first target, save some money and then change your stop-loss order to an entry order.
For inquiries, please leave a comment.
Thank you.

#ZRO/USDT#ZRO
The price is moving within a descending channel on the 1-hour frame, adhering well to it, and is heading for a strong breakout and retest.
We have a bounce from the lower boundary of the descending channel, this support at 1.71.
We have a downtrend on the RSI that is about to be broken and retested, supporting the upside.
There is a major support area in green at 1.70, which represents a strong basis for the upside.
Don't forget a simple thing: ease and capital.
When you reach the first target, save some money and then change your stop-loss order to an entry order.
For inquiries, please leave a comment.
We have a trend to hold above the 100 Moving Average.
Entry price: 1.764
First target: 1.795
Second target: 1.858
Third target: 1.912
Don't forget a simple thing: ease and capital.
When you reach the first target, save some money and then change your stop-loss order to an entry order.
For inquiries, please leave a comment.
Thank you.
ZROUSDT Forming Descending TrendlineZROUSDT (LayerZero Token) is signaling a potential breakout setup on the charts, following a prolonged downtrend and recent attempt to flip a descending trendline. The price is now testing this resistance level with solid volume, suggesting buyers are stepping in. If confirmed, the move could lead to a strong rally—targeting 60% to 70%+ gains from current levels.
LayerZero (ZRO) is not just a chart pattern; it's fueled by strong fundamentals as a leading omnichain interoperability protocol. The token plays a key role in governing and fueling transactions within a growing ecosystem of cross-chain applications. Notably, VC heavyweight Andreessen Horowitz (a16z) recently invested $55 million in ZRO, locking its tokens for three years—adding serious institutional confidence.
The broader narrative is also compelling: LayerZero is expanding rapidly, with over 125 connected blockchains and a proposal underway to acquire Stargate—a move that would deepen ecosystem integration and project reach
This mix of technical breakout setup, strong investor support, and infrastructure-driven narrative makes ZROUSDT an attractive opportunity for technical and fundamental traders alike. Watch for a sustained close above the descending resistance line to consider entries toward the projected upside.
✅ Show your support by hitting the like button and
✅ Leaving a comment below! (What is your opinion about this Coin)
Your feedback and engagement keep me inspired to share more insightful market analysis with you!
ZRO UPDATELayerZero (ZRO) rose 23.68% in 24h, outpacing the broader crypto market (+2.03%).
Key drivers:
$110M Stargate Acquisition Proposal – Bullish consolidation play
Technical Breakout – RSI signals overbought but momentum persists
Market Sentiment Shift – Greed index supports risk appetite
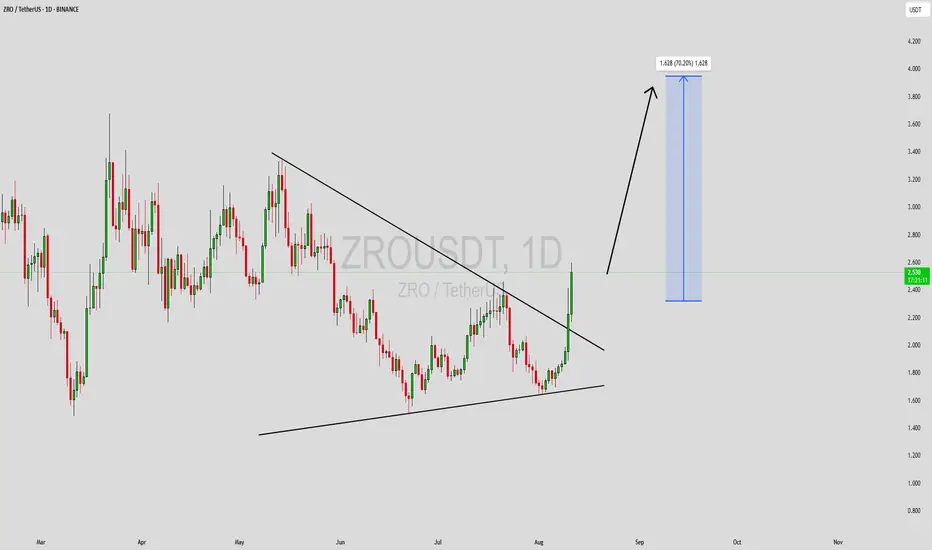
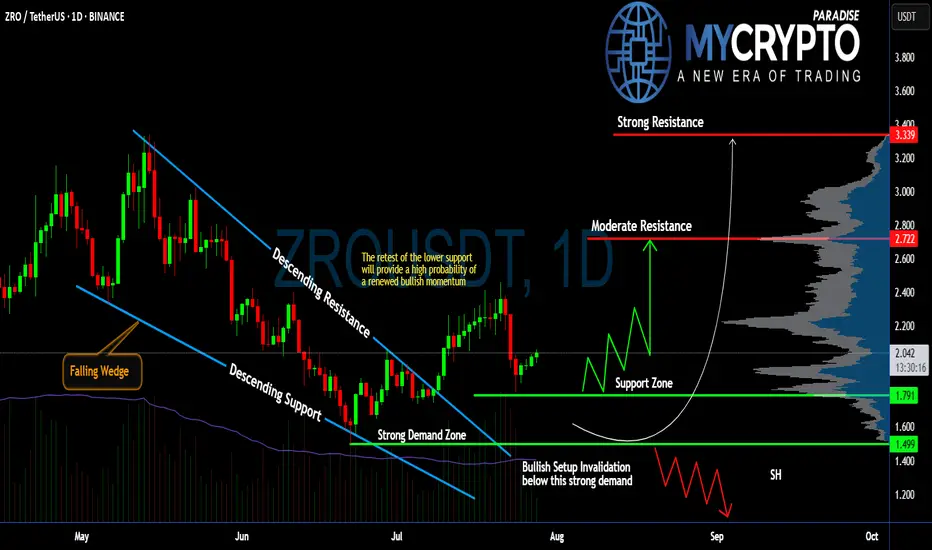
Will #ZRO Continue to Climb or Not? Must Watch For BullsYello, Paradisers! Are we witnessing the beginning of a powerful bullish reversal on #ZROUSDT, or is this just a fakeout setup? Let’s dissect this setup of #LayerZero:
💎After weeks of consistent bleeding, #ZRO has printed a classic falling wedge pattern, often a precursor to bullish reversals. This wedge has now been broken to the upside, with price currently trading around $2.037, suggesting renewed buyer interest following the breakout from descending resistance.
💎What’s crucial here is the retest of the wedge’s descending support, which aligns perfectly with a strong demand zone between $1.499 and $1.791. As long as #ZROUSD respects this zone, the probability of a bullish continuation remains high. This zone also serves as a clear invalidator for the setup—if price closes below $1.499, the bullish thesis will be off the table.
💎From here, if bulls can maintain control, we’re eyeing a potential move toward the moderate resistance at $2.722. That’s the first real hurdle where profit-taking or short interest could spike. A clean break above that level would open the path to the strong resistance around $3.339, where a heavy supply zone is likely to cap further upside.
💎Until then, we expect a series of zigzag corrections above the support zone before any sustained push higher. However, be cautious, losing the $1.499 support turns the structure bearish and could drag the price toward the $1.20 region, or lower.
Stay patient, Paradisers. Let the breakout confirm, and only then do we strike with conviction.
MyCryptoParadise
iFeel the success🌴
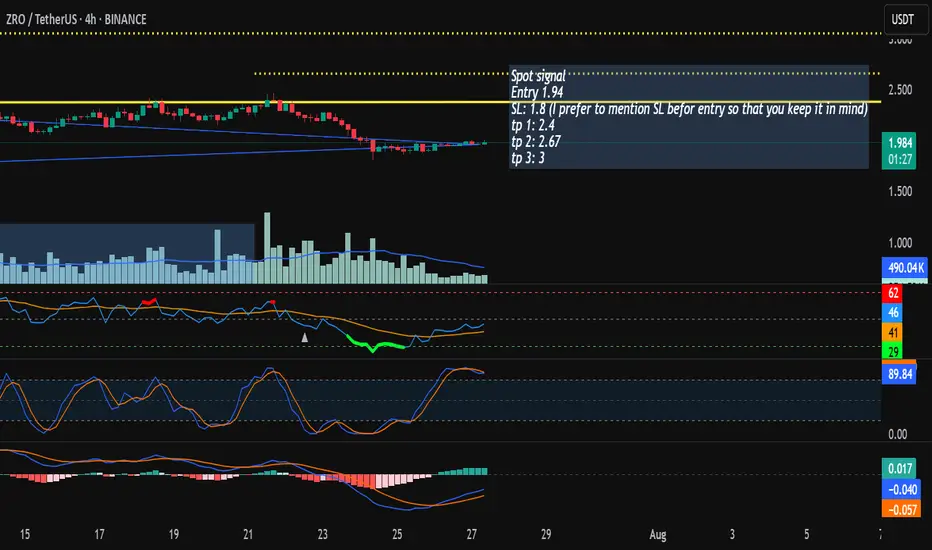
zro, spot buySpot signal (as it is not volatile)ZRO is gaining strength against ETH, once it gain 2.4 and sustain it, then it can shoot upto 3. currently it is range bound.
Entry 1.94
SL: 1.8 (I prefer to mention SL before entry so that you keep it in mind)
tp 1: 2.4
tp 2: 2.67
tp 3: 3
ZROUSDT lets sing a song 🎧
📌 Key Elements on Chart:
🔴 Resistance Zones (Red Boxes):
Marked from approx 2.35 to 2.50 USDT
Multiple red boxes stacked → showing layered resistance
Price is nearing the upper edge, suggesting rejection likely
🟡 Gann-Like Fan Lines (Yellow):
Multiple ascending support/resistance lines
Price is currently near the upper boundary, testing this zone
🔵 Vertical Time Lines (Cycle Dates):
Marked important time zones where reversal might occur
Noted dates:
July 18, 2025
July 20, 2025
July 21, 2025
Possibly July 22, 2025
🔽 Bearish Arrows:
Arrows indicate expected movement:
Price touches upper resistance
Breaks below fan supports
Heads toward 1.90 – 1.60 USDT range
🧠 Interpretation of This Idea:
You’re expecting a trend reversal after hitting the resistance zone near 2.40–2.50.
Time-based Gann or cycle analysis suggests mid-late July 2025 as a potential trend change window.
The fan lines act as temporary support, but if broken, sharp drop is expected.
This is a counter-trend short setup based on price + time confluence.
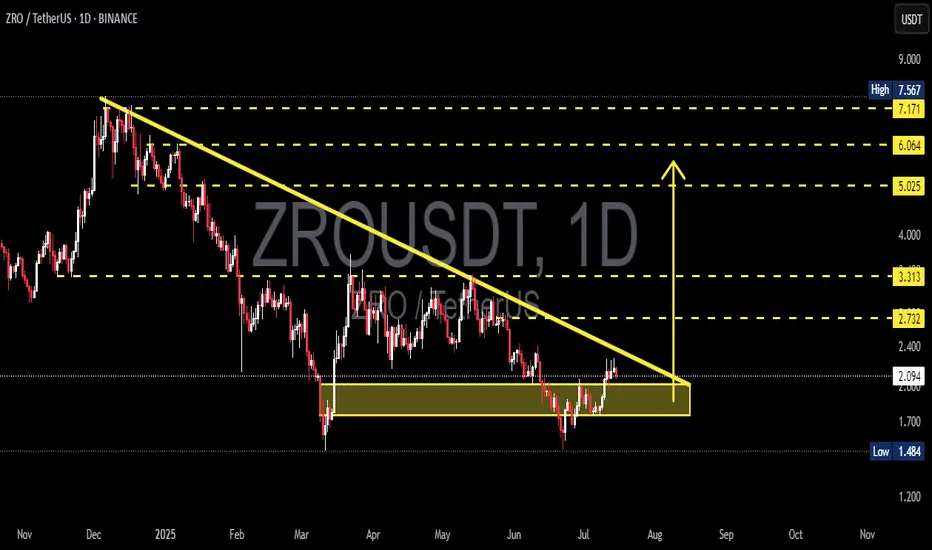
ZRO/USDT Breakout Watch – Ready to Rally After Being TrappedZRO is currently in a technically significant phase. After months of relentless selling pressure, the price action is now forming a classic Descending Triangle, and price is testing the upper boundary of this structure. A breakout from this zone could trigger a strong bullish reversal with multi-stage targets ahead.
🧩 Pattern Structure & Price Action:
📐 Descending Triangle (Potential Reversal)
Lower Highs have been forming since November 2024.
Strong horizontal support at $1.90 – $2.00, tested multiple times.
Price volatility is compressing, which often precedes a breakout.
This pattern is often considered bearish, but in this extended downtrend context, it can become a bullish reversal pattern if price breaks out to the upside with strong volume.
📊 Key Zones & Target Levels if Breakout Happens:
1. 🔹 $2.30 – Breakout confirmation zone (trendline break).
2. 🔹 $2.73 – Minor resistance from previous structure.
3. 🔹 $3.31 – Strong psychological and historical resistance.
4. 🔹 $5.02 – Primary breakout target based on pattern height.
5. 🔹 $6.06 – $6.50 – Mid-term extension target based on Fibonacci and prior supply zone.
6. 🔹 $7.17 – $7.56 – Extended bullish target in case of strong rally continuation.
🟢 Bullish Scenario:
If price breaks out with a strong daily close above $2.30 accompanied by volume:
Buyers gain control.
Descending triangle becomes a launchpad for upward momentum.
Gradual rally toward $5 and beyond becomes very likely over the next few weeks.
🔴 Bearish Scenario:
If price fails to break the resistance and instead drops below $1.90:
Price could fall toward $1.60 as near-term support.
If bearish pressure continues, price may test the $1.48 support zone (previous local bottom).
Structure remains bearish until significant buying pressure returns.
🧭 Conclusion:
ZRO is at a critical decision point. A clean breakout from this pattern could be the beginning of a major recovery rally. However, failure to break resistance could lead to another leg of consolidation or downside. This is a high-opportunity setup for traders watching for volume and confirmation.
#ZRO #ZROUSDT #CryptoBreakout #TechnicalAnalysis #AltcoinSeason #CryptoTrading #DescendingTriangle #ReversalPattern #ChartAnalysis
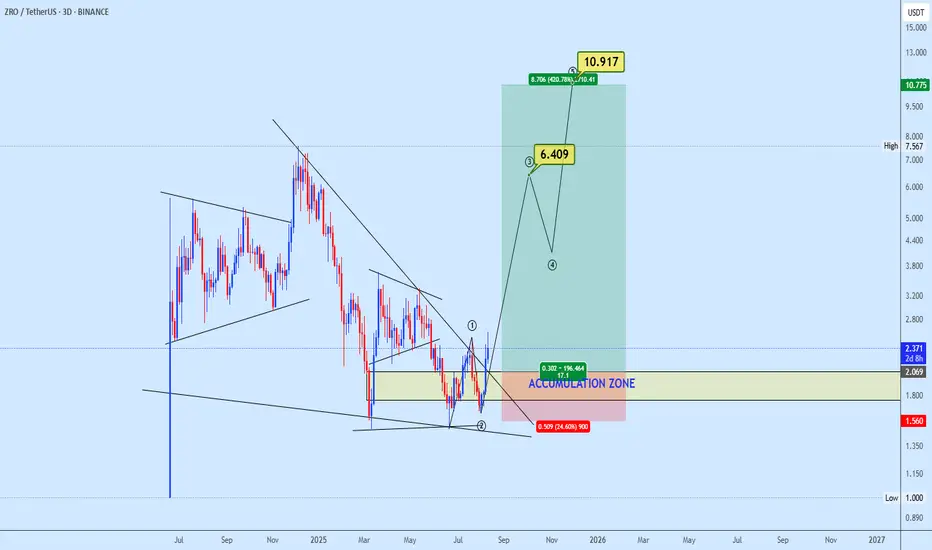
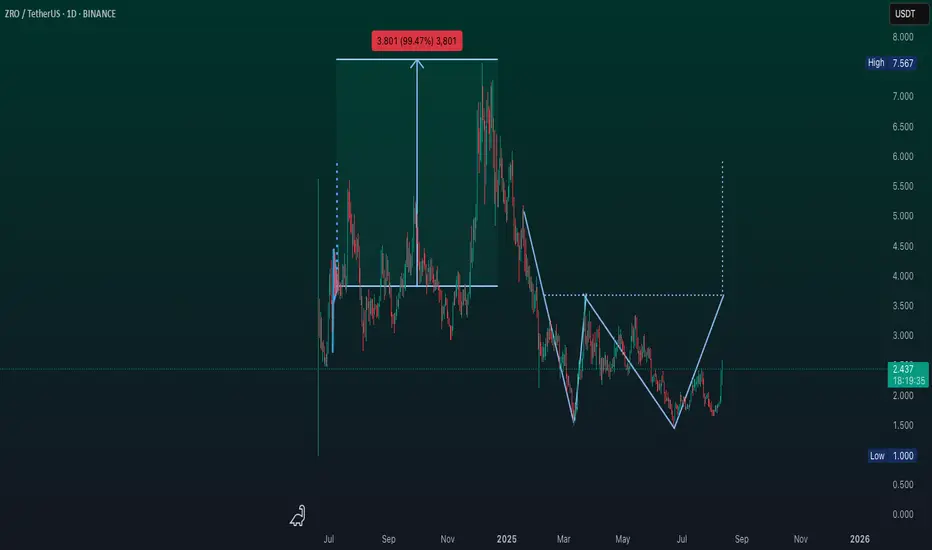
ZRO/USDT Wave AnalysisSince 2024, CSE:ZRO established a key level around $3. Moving into 2025, the price experienced a sharp decline, breaking below $3 and finding support near $1.5.
In mid-March, the long-term downtrend channel was decisively broken with a +140% move. However, the price failed to reclaim the $3 key level on the back-test, resulting in a prolonged sideways range between $2.3 and $3.
During this consolidation phase, there was a notable upthrust right at the $3 key level, which triggered another strong correction, sending price back to retest the $1.5 support zone.
Currently, we are seeing a clear breakout from the descending channel. With Bitcoin reaching new all-time highs, the outlook for CSE:ZRO has turned positive, and a new bullish wave is expected. The primary target remains a break above the $3 key level. Importantly, this breakout is developing with a healthier structure compared to the rapid, unsustainable move in March.
Risk management: Place stop-loss orders below $1.7 to protect capital.

#ZRO/USDT#ZRO
The price is moving within a descending channel on the 1-hour frame and is expected to break and continue upward.
We have a trend to stabilize above the 100 moving average once again.
We have a downtrend on the RSI indicator that supports the upward move with a breakout.
We have a support area at the lower boundary of the channel at 1.65, acting as strong support from which the price can rebound.
We have a major support area in green that pushed the price higher at 1.58.
Entry price: 1.69
First target: 1.75
Second target: 1.82
Third target: 1.90
To manage risk, don't forget stop loss and capital management.
When you reach the first target, save some profits and then change your stop order to an entry order.
For inquiries, please comment.
Thank you.

ZROUSDT 12H#ZRO has broken above the descending resistance on the 12H chart.
Price is currently facing rejection at the Ichimoku cloud, while the 12H SMA50 is providing dynamic support.
📌 If a successful bounce occurs, the next potential targets are:
🎯 $2.171
🎯 $2.381
🎯 $2.590
🎯 $2.888
🎯 $3.267
⚠️ As always, use a tight stop-loss and apply proper risk management to protect your capital.

ZRO ZRO recently broke structure to the upside with strong momentum hinting at smart money involvement.
Price is now consolidating just above a key bullish OB a potential sign of reaccumulation.
Beneath this range, there’s a clear liquidity pool around 1.805 formed by multiple EQ L This area is a likely target for a liquidity sweep, as smart money often drives price below such levels to trigger SL and trap sellers before resuming upward movement. BINANCE:ZROUSDT

LayerZero, Exposing The Bottom, NEW Uptrend in The MakingNotice how a very steep decline suddenly becomes flat. The bottom that is. As ZROUSDT was crashing down from December 2024 we have lower lows. Then something changes; market dynamics, price action, the trend, instead of lower lows the bottom goes flat and yesterday we have a double-bottom. This means that bears are no longer in charge. Buyers were present at support.
Truly, that's all we need to know.
No complexities, no hundreds of indicators, no "fundamentals," nothing, none.
Just this small amount of information tells us that the downtrend is over, with the downtrend being over we know a reversal can happen any day. We are expecting this reversal to start to shape itself now. A new uptrend will show up in the coming weeks. Bullish action will start within days.
LayerZero is going up.
Thank you for reading.
Namaste.

$ZROUSDT Descending channel 4h chart.$ZRO/USDT is trading near the bottom of a descending channel on the 4H chart.
If support holds, a bounce toward the upper channel could offer a 26.96% upside.
Watch for confirmation, but a breakdown below the channel may signal further downside.
DYRO, NFA

#ZRO/USDT#ZRO
The price is moving within a descending channel on the 1-hour frame, adhering well to it, and is heading towards a strong breakout and retest.
We are experiencing a rebound from the lower boundary of the descending channel, which is support at 2.10.
We are experiencing a downtrend on the RSI indicator that is about to be broken and retested, supporting the upward trend.
We are heading towards stability above the 100 Moving Average.
Entry price: 2.16
First target: 2.21
Second target: 2.23
Third target: 2.26

3.5 RR tradeShould be a fairly safe trade, and a minimum first target. Could possibly hold for a bit more, or less depending on how the chart develops

#ZRO/USDT#ZRO
The price is moving within a descending channel on the 1-hour frame, adhering well to it, and is heading toward a strong breakout and retest.
We are experiencing a rebound from the lower boundary of the descending channel, which is support at 2.34.
We are experiencing a downtrend on the RSI indicator that is about to be broken and retested, supporting the upward trend.
We are heading toward stability above the 100 Moving Average.
Entry price: 2.36
First target: 2.40
Second target: 2.44
Third target: 2.48

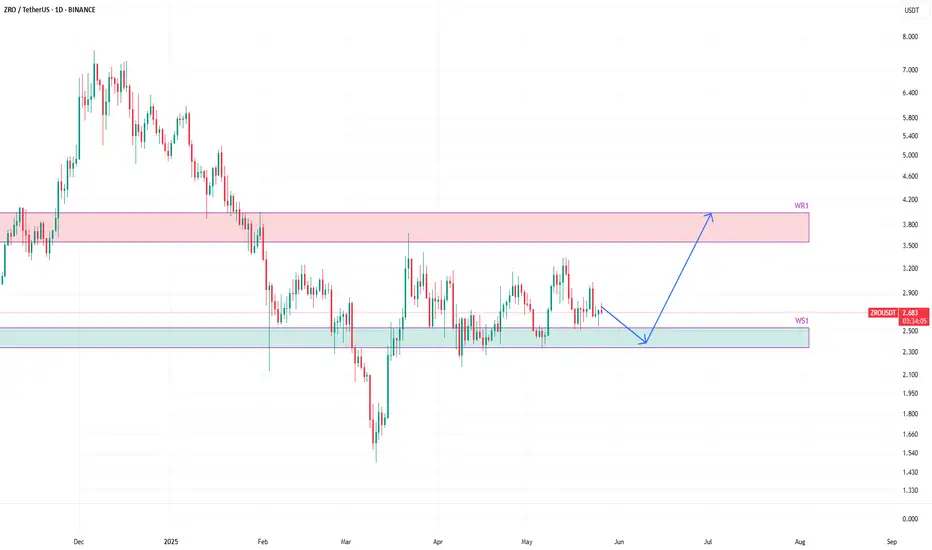
ZROUSDT to bounce from weekly supportZROUSDT is currently ranging between weekly resistance WR1 and weekly support WS1.
I expect the price to trade in this range, more around WS1, and then dip into WS1 before boucing towards WR1 zone.
Therefore, any dip into the WS1 zone presents a good long opportunity.