ZRX - the revenge of the boy that never pumpedHey there!
Weekly levels baby, that's all it is about.
Nothing fancy. Just see for yourself!
Clear range level retested and ready to fly to ATH on Binance :)
Make sure to get a piece of the action - iz gonna be guuuud.
Take care,
Vlad The Crypto Trader
Market insights


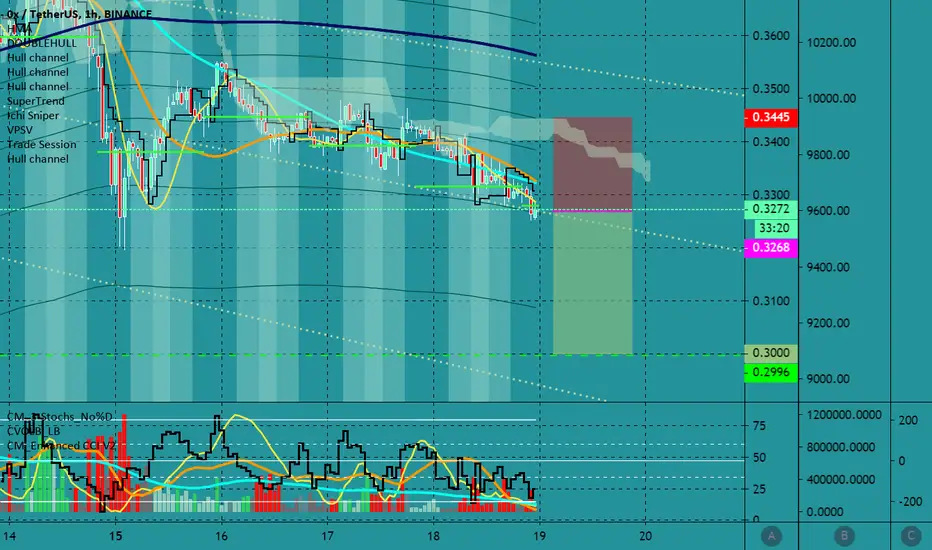
ZRXUSDT 05 JULY 2020 1825 hrsSupply keeps showing up at key resistance. Demand into the low ground does not appeasr to be evident.
Careful long. Might want to wait for a re-visit to a key support.


0X break out and retestperfect retest here lets see if it holds
also part of the DeFi craze so maybe its a good time to get in

ZRXUSDTZRXUSDT, the trend has been increasing and is currently in the middle of the resistance and support line. The expectation is more increases. Here are some possibilities at this point.
1. It might continue to increase and hit the support line above. Wait for an open-close candle then buy.
2. It might decrease and pull back the support line. Wait for an open-close candle then sell.
- Look at the Engineering Robo's signals how well work.

ZRXUSDT - ride the wave until it's over Hey everyone,
really nice continuation setup forming on this pair.
Not balanced but the Point of Control seems to suggest that we could rip upwards even more - just take a look at that Daily chart!
Early entry for a good Risk-Reward Ratio too 🤤
Anyhow, let's see what it does.
As always, take into account your initial risk.
Take care,
Vlad The Crypto Trader

Ready to grow? Corrected to 0.5 fib
50 holds
Target is on chart
This is not the financial advice.
Any feedback is welcomed.


ZRXUSDT shortThe Head and shoulders pattern is formed. A price will broke the neckline. So it will be downtrend. At day chart we have bearish signals too.
Signals:
Dark cloud cover at day chart
EMA 9 crossing EMA 20
MACD line crossing Zero line
Please support my work by clicking the LIKE/FOLLOW button.
Always do your own analysis and trust your intuition!
If someone wants advice or private analysis send a PM. I would be grateful to earn some money for you and you send me some donation for my work.

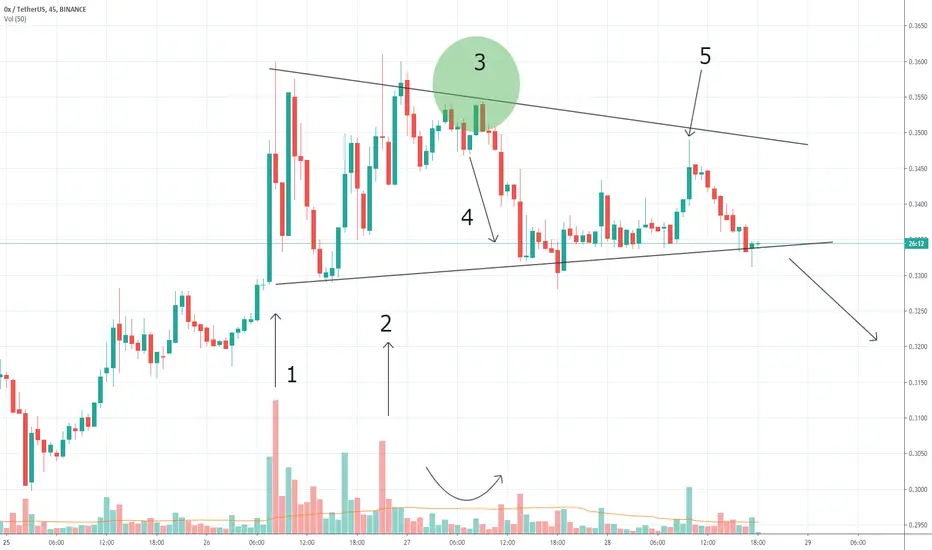
Bearish triangleZrx looks very weak on this 45m chart.
You see 1-2 bars with the maximum volume, I highlighted them with two arrows, they have a maximum above the level of 0.35. However, these extremely high volumes on attempts to rise can mean hidden weakness.
Most likely, hidden professional selling occurred around 0.35 because at point 3 there is trading on very small volumes near the resistance level. This means a weak market and a lack of demand.
Arrow number 4 indicates a surge in volumes amid falling prices - a typical occurrence for selling pressure. Sellers come out of the shadows.
A burst of activity on arrow number 5 indicates a bull trap. This is a fraudulent movement that often occurs on the eve of decline.
Thus, we can most likely say that the chart tells us a bearish story. Several attempts to establish a bullish trend were not successful, therefore, a bearish breakdown of the triangle in this situation looks like the most logical development.

ZRX/USDT - sellers dominateLook at the candles sellers dominate. The fuse at the top is a sign of the seller.
It all depends on the BTC. It can change the mood in the market if one candlestick gives up.
ZRX/USD such a triangle looks down.
The indicators show the weakness of the asset.
Break-down support (key level) and move down.
Cancel downwards, going beyond the 0.37$ level.
Push ❤️ if you think this is a useful idea!
Before to trade my ideas make your own analysis.
Thanks for your support!


ZRXUSDT is going up guy's!!! Just wait for the retest!Just wait for a retest on the support/resistance to confirm the long. (Yellow line)

ZRX/USDT looks intrestingAs you can see, we're facing a triangle pattern and also a wedge in it. if ZRX can manage to breake the resistance we might have 7% profit. what do you think?
