Audacity618
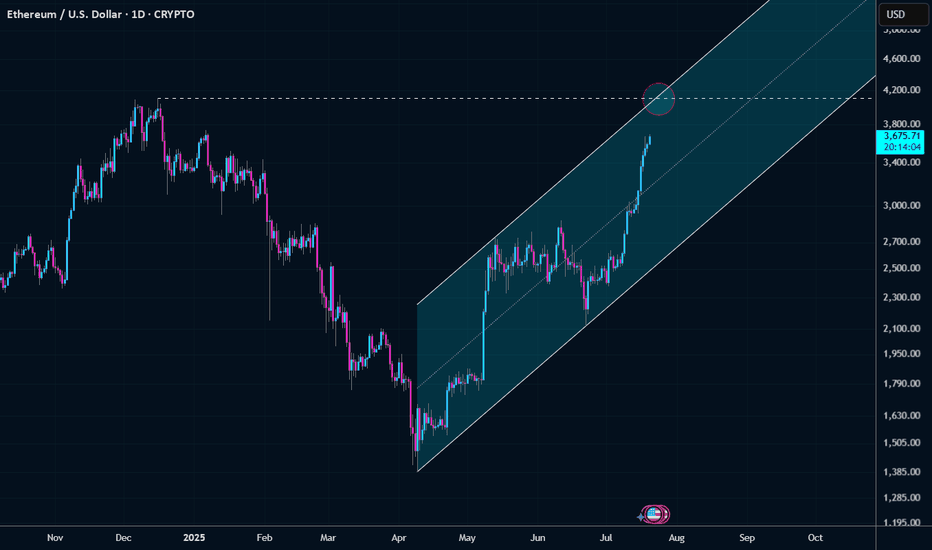
PremiumI think ETH just melts up from here to ~4100 short term high. We're seeing inflows into the ETH ETFs that are larger than the BTC ETF inflows now.
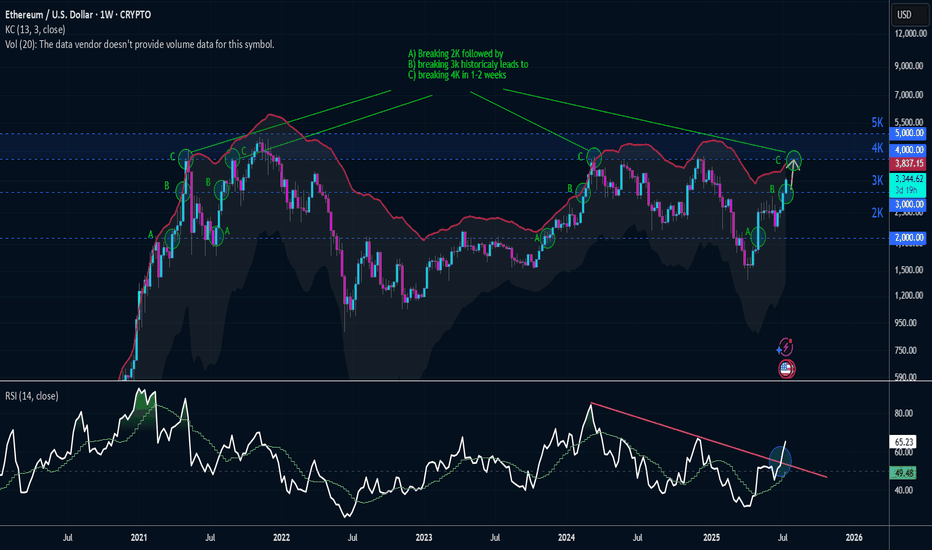
4 out of 4 historical times -> Ethereum has hit 4K in 1 to 2 weeks after breaking 2K and 3K sequentially.
Next week is "Crypto Week" in the U.S. House of Representatives. The House will consider the CLARITY Act, the Anti-CBDC Surveillance State Act, and the GENIUS Act. Bill Helps Ethereum By... CLARITY Act Protecting decentralized infrastructure from U.S. blacklists Anti-CBDC Act Preserving demand for decentralized stablecoins, defending privacy GENIUS...
Not quite a dark cover cloud candlestick today but given how strong the Nasdaq was today and NASDAQ:TSLA slumped is a fairly pathetic price action on day 2 post Austin launch. IMO a lot of shorts were on the sidelines until robotaxi commenced. They waited for the pop and now feel more confident in entering short since they were able to assess launch. Buy the...
22M market cap - cashflow and EBITDA positive company. Breakout on the downward linear trend line
Potential cup and handle formation as it the trend works into the bottom of the handle. Still think this comes back into play as the "big beautiful bill" comes back into focus and national debt is a topic of concern.
I think this pullback mainly driven by middle east uncertainty is a great gift to buy the pullback on BITSTAMP:ETHUSD
Unlike other headline news, long term interest rates breaking out to the upside is an immediate threat to equity prices especially if it's driven by bond vigilantes rather than strong economic news. This will immediately compress valuations and particularly hurt high growth and small caps the most. In addition, this is not a one-off headline where equities markets...
Small Caps look the least extended in this equity rally and I really like the tight ranges before it advances to it's next box. My analysis puts IWM imminent on its next advance upwards. Put this trade idea under: "The trend is your friend until it bends".
More of a warning rather than a call for bearish or bullish price plays. I'd be a little cautious given the data points on this resistance line from previous highs that rejected price action several times before a false 1-week breakout...
Not really liking the treasury bond price action. Still believe that bond vigilantes are dumping US treasuries... not liking the head and shoulders pattern on the weekly... the higher treasury yields don't seem to be impacting the equity markets... until they do.
Prior plunges below this custom weekly Keltner channel have a good track record of highlighting buying opportunities. In simile terms.. when markets plunge too much and too fast, a great accumulation occurs with wild oscillations. After the accumulation will come a "disbelief rally" where the market will continue to rip higher in a concave down curve to the...
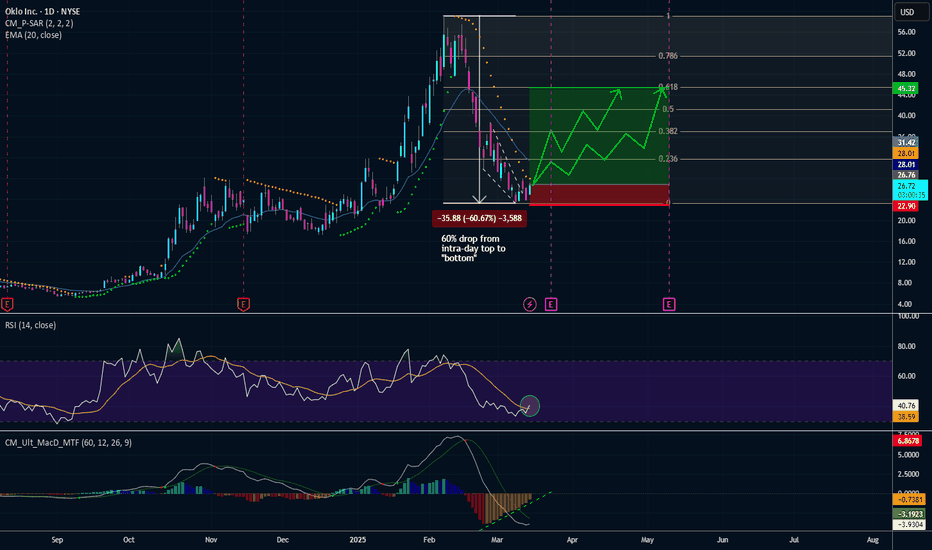
OKLO is my personal favorite nuclear play that feeds off the AI energy. Really beat up since it's height in early February, down over 50% as of today (as are a lot of other stocks given the macroeconomic backdrop). Chris Wright, a member of its Board of Directors, was confirmed as the U.S. Secretary of Energy on February 3, 2025. As a result, Wright has stepped...
The Russell 2000 is down 17% from November highs. According to Bank of America, small caps are not pricing in a recession. Historical small-cap selloffs during recessions have been 35-40%, with forward P/Es dropping about 30%. Earnings are still 38% below their peak. Small caps trade at 14.2x earnings, slightly below the historical average, suggesting they reflect...
Confluence of bearish signals here. Target $100. - Death Cross 50ma < 100ma - Breakdown of year-long log trend - under 200ma - Topping Arch pattern
Retracement back to ~527 and then lower leg down to >500. Following a similar pattern to the Jan 2022 top -> a failed breakout higher, 50-60% retracement, than lower leg.
Putting aside my personal beliefs on the current state of the economy (bad inflation and job figures for January combined with looming potential tariffs), The Nasdaq tape reads very bullish breaking out of this tight wedge formation (blue), if it can hold this breakout and continue to move upward, I believe we have a nice bull rally play to go long.
The amount of hyper speculation in quantum stocks is still mind boggling. I see this tracking a classic bubble pattern where we may start to flip from the "return to normal" phase to a "fear" sell off as we get closer to earnings (early March). Short this back to under $6 from the bull trap.


