AutoMarkets
EssentialGold has made an impressive recovery off the $3,250 zone, pushing back into the $3,380–$3,390 region — a key supply area which previously led to strong sell-offs. We’re now sitting at the upper boundary of a 1H ascending channel and just under a significant resistance area seen on the 4H and daily timeframes. Although bullish momentum is still present, price is...
Gold (XAUUSD) recently broke a major ascending trendline that had held since late June, leading to an aggressive sell-off from the $3,440s down to the $3,270 zone. Following that, price is now consolidating just beneath the previous support trendline, forming what appears to be a bear flag or rising channel inside a corrective structure. The $3,330–$3,340 zone...
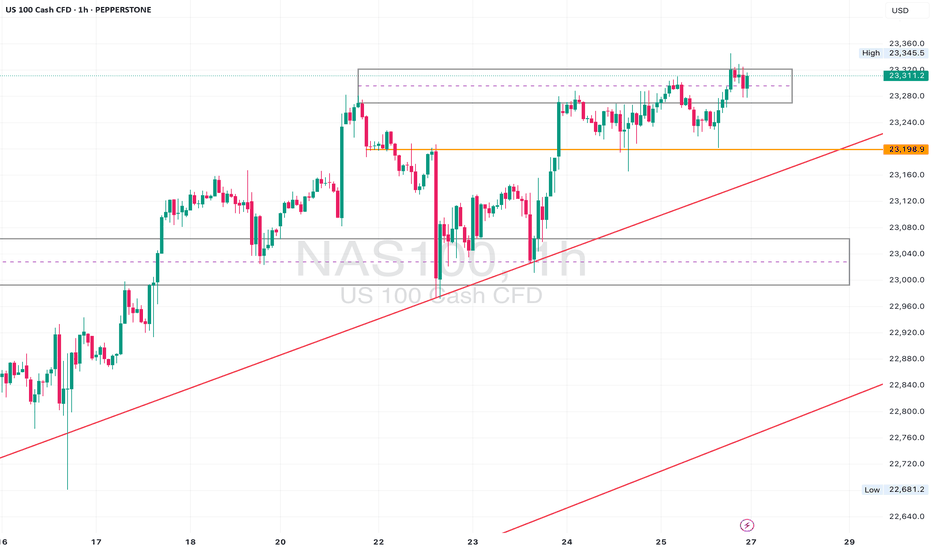
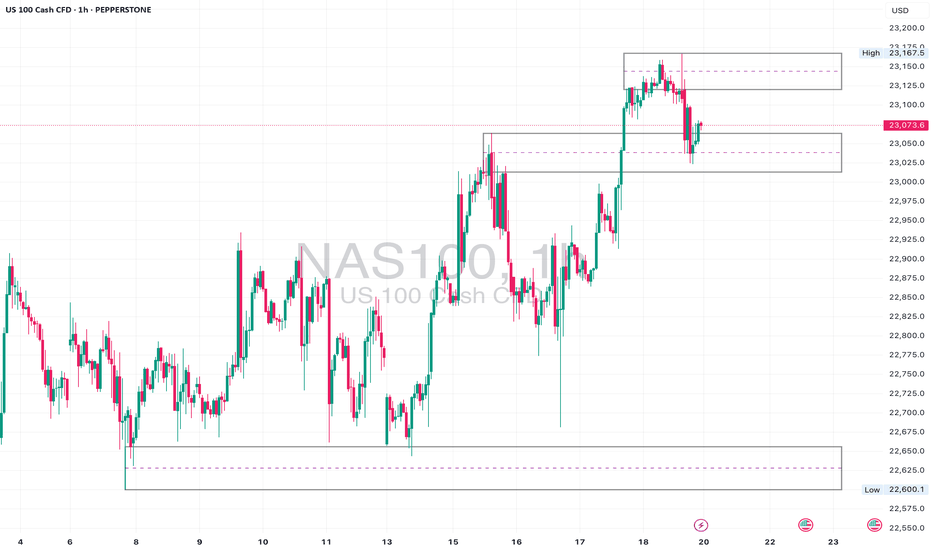
Daily Analysis: Price is testing the upper boundary of the long-term ascending channel. Structure is still bullish with no major breaks of support. If momentum holds, we could extend toward the channel top. 4H Analysis: Retesting breakout structure. Support is forming around 23000–23050. Bullish momentum remains valid unless price closes below this zone. 1H...
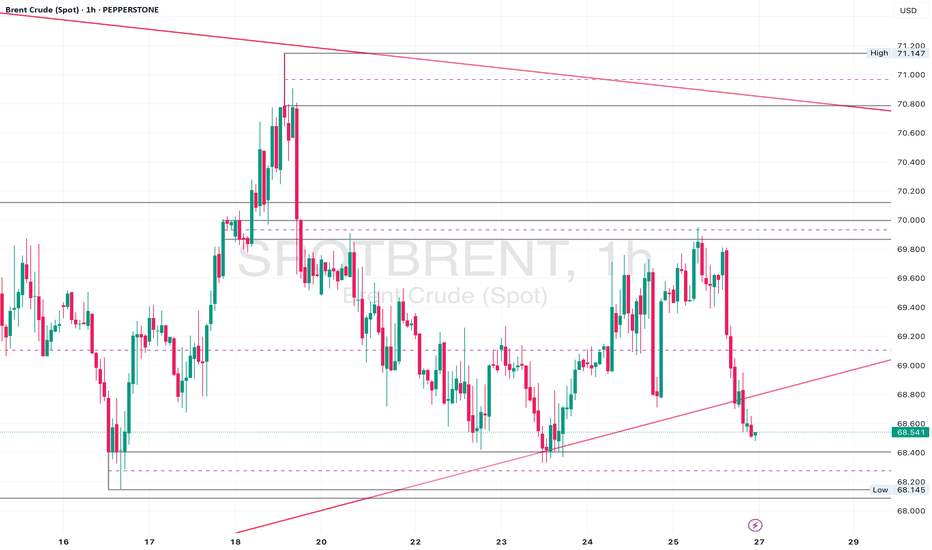
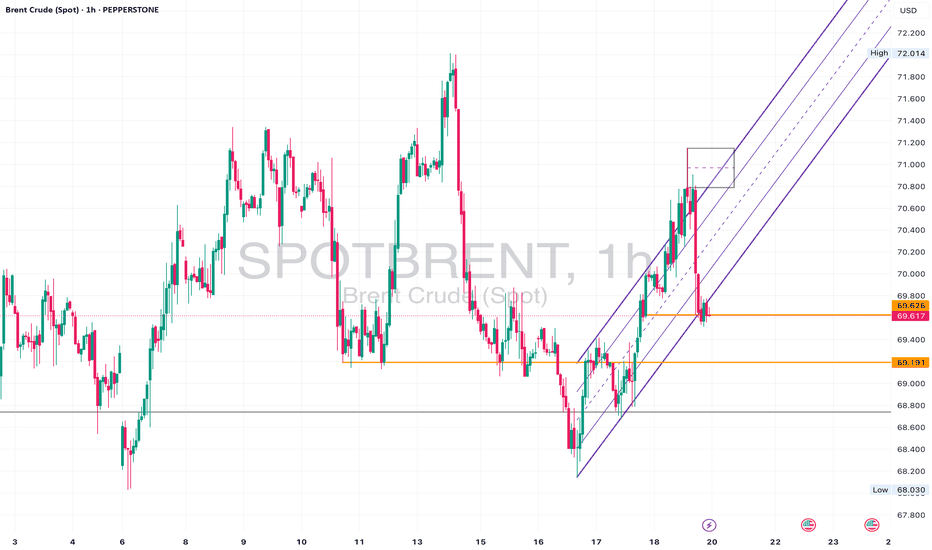
Daily Analysis: Price is holding above the ascending trendline and forming higher lows. Multiple rejections from the 68.00 region suggest strong demand. As long as we remain above the trendline, bulls stay in control. 4H Analysis: Pullback after rejecting 71.00. Now sitting inside the 69.60–69.20 demand area. Bullish channel is still valid unless we break below...
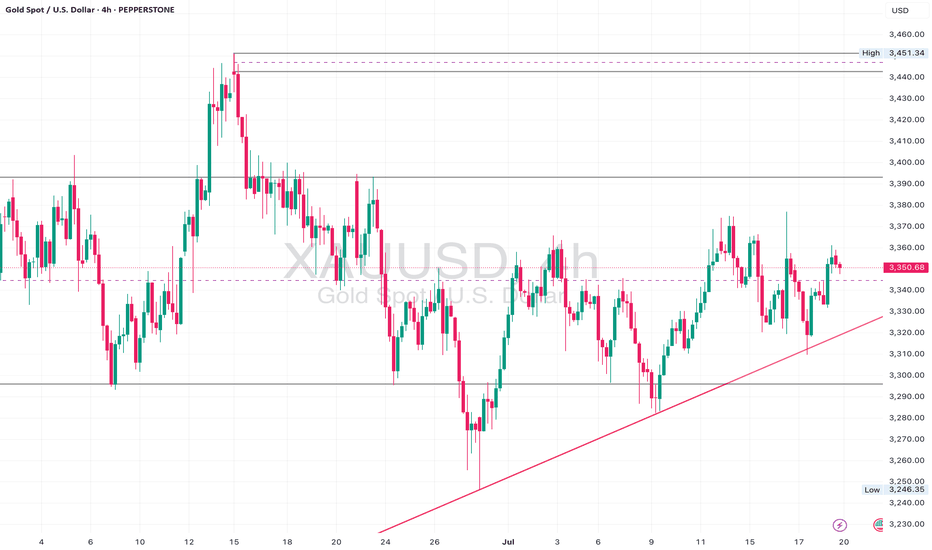
Daily Analysis: Price is respecting the long-term trendline support and still holding firmly above the 3300 region. Bulls are defending structure with a clean series of higher lows. No major change in trend as long as price remains above 3246. 4H Analysis: Price is consolidating above the trendline and building structure around 3350. A clean break and close above...
• Daily: Maintaining higher lows along the trendline. Strong support at 3,300. • 4H: Still respecting the diagonal, and showing strength despite short-term pullbacks. • 1H: Breakout from descending trendline and now retesting the breakout zone at 3,350. ⚠️ Watch For: • Clean bullish break above 3,365 confirms new impulse wave toward 3,400+. • Support at...
• Daily: Price is sitting above long-term trendline support, but momentum is waning. • 4H: Structure looks indecisive with constant failures near 71.00. • 1H: Recent break of the upward channel. Now retesting that zone from below. ⚠️ Watch For: • Retest of 69.60–70.00 as resistance. • Break and close below 69.20 could signal deeper downside. • If it holds...
• Daily: Price is nearing the upper boundary of a rising wedge pattern — showing signs of overextension. • 4H: Strong bullish structure with clean breaks and retests of minor consolidation ranges. • 1H: Small range developing after recent high. A deeper pullback to 22,960–22,880 would offer a cleaner entry for continuation. ⚠️ Watch For: • Wedge resistance on...
USDCHF has broken beneath a key ascending trendline that’s been supporting price since July 3rd. This drop comes after multiple failed attempts to break the 0.7986–0.8000 resistance zone — a level that continues to reject bullish pressure. Now, price is retesting the broken trendline and the 50 EMA from below, creating a potential bearish continuation setup if...
Gold is coiling tightly within a symmetrical triangle on the 5-minute chart, pressing against key support around 3,352. Price action is compressing between a rising trendline and descending resistance — indicating an imminent breakout. ⸻ 📍 Key Levels: • Support: 3,352-3,350 zone – defending so far. • Resistance: 3,360-3,366 area – repeated rejection...
The NAS100 (US100) is in full breakout mode on the daily, surging past previous highs near 22,140 with strong momentum. Price is now trading at ~22,550, decisively above prior resistance, which could now act as support if we retest. 🔎 Multi-Timeframe Breakdown: ✅ Daily Chart: • Massive bullish structure intact. • Clean breakout above horizontal resistance at...
Gold (XAUUSD) is pressing deep into key daily support around $3,275 after a sharp drop from the $3,450s. The daily trendline that’s defined this bullish run since January is now being tested for the first time in months, signaling a possible structural shift. On the Daily chart, price has decisively broken below the mid-range of the recent consolidation box and...
Brent Oil is hovering just above critical support near 66.00, with a clear bearish structure visible across timeframes: 🔎 15m & 1h: Price action is consolidating near the ascending support trendline drawn from early June lows. Short-term price structure shows lower highs and lower lows, suggesting continued downside pressure. 📉 4h & 1D: The recent sell-off from...
GBPUSD continues its impressive rally, tapping into the upper boundary of a clean ascending channel across the 1D and 4H timeframes. 🔹 Daily: Structure remains bullish with price pressing into long-term channel resistance near 1.3765. This is a key inflection point — bulls may need fresh momentum to break above. 🔹 4H: Sharp impulsive move has stretched to the...
EURUSD remains firmly bullish on all major timeframes, respecting the internal structure of an ascending channel. • Daily: Price continues to respect both the red trendline and broader purple bullish channel. Buyers are defending the mid-line and pushing toward the upper boundary. • 4H: Clear higher highs and higher lows. Price recently revisited and bounced off...
📍 Levels Marked: 22,101 Resistance | 21,880 Mid-Level | 21,375 Channel Support ⸻ 📊 Technical Breakdown: The NAS100 has surged into the 22,000+ range, breaking above the mid-level channel boundary after consolidating beneath it for days. This breakout takes us right back into an untested supply zone from March. On the lower timeframes (1H & 23min), price...
Brent Oil delivered a textbook reversal last week. After weeks of climbing within a rising channel, price printed a strong rejection wick at the upper boundary (~$79.45), then followed through with a violent sell-off, slicing through structure and breaking the channel cleanly. 🔍 Key Levels: • Rejection High: $79.45 • Structure Break: $74.89 (former support,...
Gold remains bullish on the higher timeframes, holding a long-term ascending trendline from the daily. However, price action has respected a clear horizontal resistance zone around 3392, forming a multi-tap ceiling. On lower timeframes, we’re seeing a series of higher lows, suggesting buyers are still stepping in — but without clean breakouts, the market remains...


