BraveTigercat
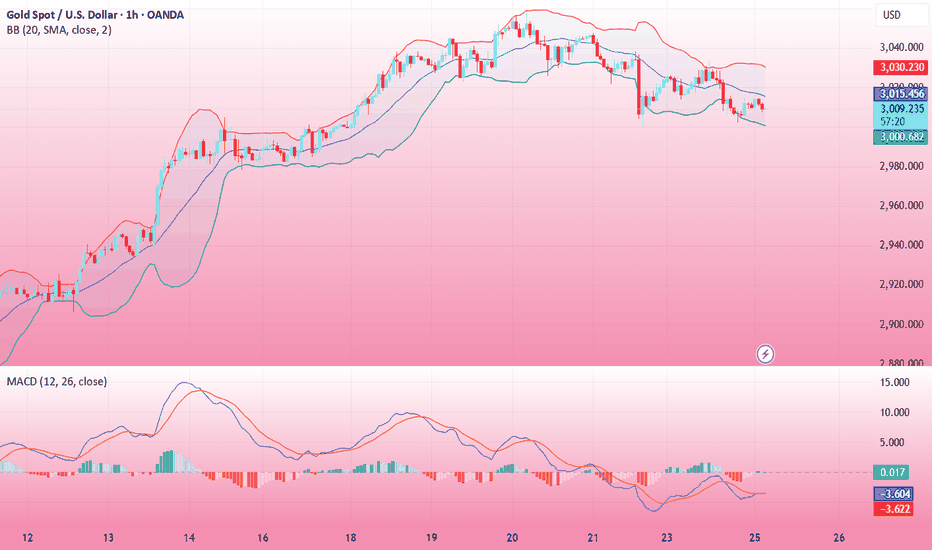
Today's buying and selling boundaries: 3015 Support and resistance levels: 3046 3034 3027 3004 2996 2985 Trading strategy: If the price breaks through 3015, consider buying, the first target price is 3027 If the price breaks through 3004, consider selling, the first target price is 2996
Today's buying and selling boundaries: 150.25 Support and resistance levels: 151.62 151.11 150.78 149.73 149.40 148.89 Trading strategy: If the price breaks through 150.78, consider buying, the first target price is 151.11 If the price breaks through 150.25, consider selling, the first target price is 149.73
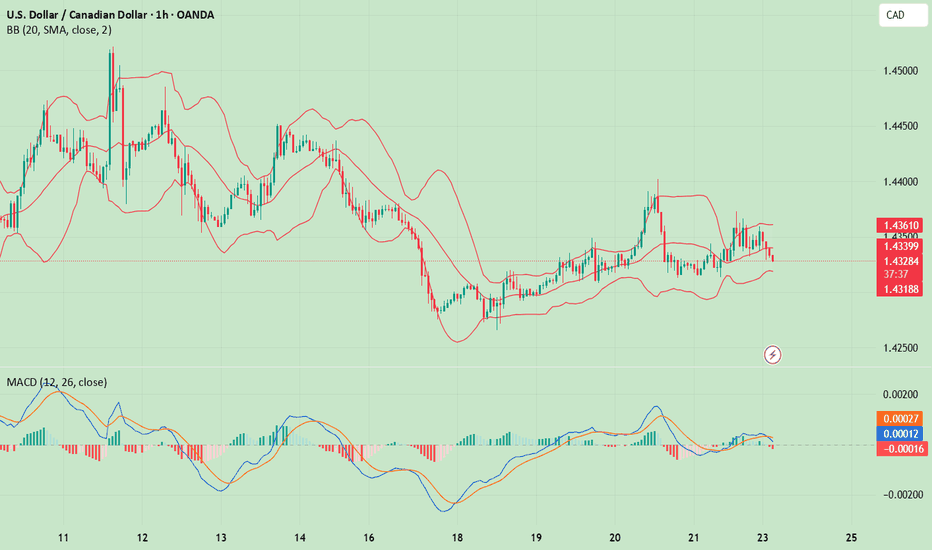
Today's buying and selling boundaries: 1.4318 Support and resistance levels: 1.4379 1.4356 1.4342 1.4295 1.4280 1.4257 Trading strategy: If the price breaks through 1.4342, consider buying, the first target price is 1.4356 If the price breaks through 1.4295, consider selling, the first target price is 1.4280
Today's buying and selling boundaries: 1.2929 Support and resistance levels: 1.3007 1.2978 1.2959 1.2899 1.2880 1.2850 Trading strategy: If the price breaks through 1.2929, consider buying, the first target price is 1.2978 If the price breaks through 1.2899, consider selling, the first target price is 1.2880
Market news: In the early Asian session on Tuesday (March 25), spot gold fluctuated narrowly and is currently trading around $3,012 per ounce. London gold prices fell 0.4% on Monday, falling to $3,002 per ounce during the session. The US dollar hit its highest level in more than two weeks, prompting more gold bulls to take profits, and investors to assess US...
Technical analysis of ETH on March 24: Today, the large-cycle daily line level closed with a small positive line yesterday, and the K-line pattern showed a continuous rise, but the price is still at a low level. The fast and slow lines of the attached gold cross indicator are below the zero axis, so I am still bearish on the big trend, but there is a large demand...
Technical analysis of BTC on March 24: Today, the large-cycle daily level closed with a small positive line yesterday. The K-line pattern is still a single negative and a single positive. The price stands on the MA30 daily average line. The attached indicator is running in a golden cross, but the fast and slow lines are still below the zero axis. According to the...
Crude oil market analysis: Recently, crude oil has been hovering at the bottom. There are short-term stabilization signals, but it is basically difficult to turn around if you don't buy at 70.00. Today's idea is still bearish. Crude oil is sold regardless of weekly or short-term. Today's idea is still to sell at a high price and bearish. Crude oil pays attention...
Gold market analysis: Last week, gold kept rising, but suddenly turned around and began to give back on Friday. The position of 3020 was broken, and it was not so strong in the short term. Is the big top of gold coming? This is the focus of traders at present. Judging from the previous pattern and moving average indicators, its adjustment has not changed the...
Market news: In the early Asian session on Monday (March 24), spot gold fluctuated in a narrow range and is currently trading around $3,022 per ounce. The international gold price fell 0.7% last Friday due to the strengthening of the US dollar and profit-taking. It once hit the 3,000 integer mark during the session. However, geopolitical and economic uncertainties...
Today's buying and selling boundaries: 3023 Support and resistance levels: 3071 3053 3041 3005 2993 2975 Trading strategy: If the price breaks through 3023, consider buying, the first target price is 3041 If the price breaks through 3005, consider selling, the first target price is 2993
Today's buying and selling boundaries: 149.18 Support and resistance levels: 150.25 149.85 148.59 148.77 148.51 148.11 Trading strategy: If the price breaks through 148.59, consider buying, the first target price is 149.85 If the price breaks through 149.18, consider selling, the first target price is 148.77
Today's buying and selling boundaries: 1.4345 Support and resistance levels: 1.4404 1.4382 1.4368 1.4322 1.4308 1.4286 Trading strategy: If the price breaks through 1.4345, consider buying, the first target price is 1.4368 If the price breaks through 1.4322, consider selling, the first target price is 1.4 308
Today's buying and selling boundaries: 0.6278 Support and resistance levels: 0.6326 0.6308 0.6297 0.6260 0.6248 0.6230 Trading strategy: If the price breaks through 0.6278, consider buying, the first target price is 0.6297 If the price breaks through 0.6260, consider selling, the first target price is 0.6248
Today's buying and selling boundaries: 1.0824 Support and resistance levels: 1.0887 1.0863 1.0848 1.0799 1.0784 1.0760 Trading strategy: If the price breaks through 1.0824, consider buying, the first target price is 1.0848 If the price breaks through 1.0799, consider selling, the first target price is 1.0784
Market news: Mainly due to the strengthening of the US dollar and investors' continued profit-taking, the US Treasury yields are rising, which put pressure on the international gold price and suffered a fierce sell-off. The London gold price once fell to around the $3,000/ounce mark during the session, and then recovered some of its losses. The geopolitical and...
Crude oil market analysis: Yesterday's crude oil daily line closed with a big positive, is it a buying opportunity? In fact, looking at the pattern, it has been hovering at this position for a long time, and the short-term is basically a snake. If the position of 70.00 is not broken, it is difficult to form a buying opportunity. The idea of crude oil today is...
Gold market analysis: Recently, the market is dominated by bulls. The daily line has been setting new highs. However, after setting a new high of two points yesterday, the bulls did not continue. Today, we need to adjust our thinking in the short term. The bullish daily line cross star means that the short term needs to be oscillated and repaired. There is no...


