Bullmaste
Premiumidea TL;DR • structure: HH/HL since June low (\~1.05). I’m labeling current move as wave (4) inside an ascending channel. • plan: buy/scale in on the red box 1.30–1.20 (0.5–0.618 retrace of the June leg). • targets: 1.62 / 1.97 / 2.13–2.43 (midline + 0.786 fib) for wave (5). • invalidation: daily close < 1.18 (breaks HL) → next shelf 1.05 then 0.93. details Price...
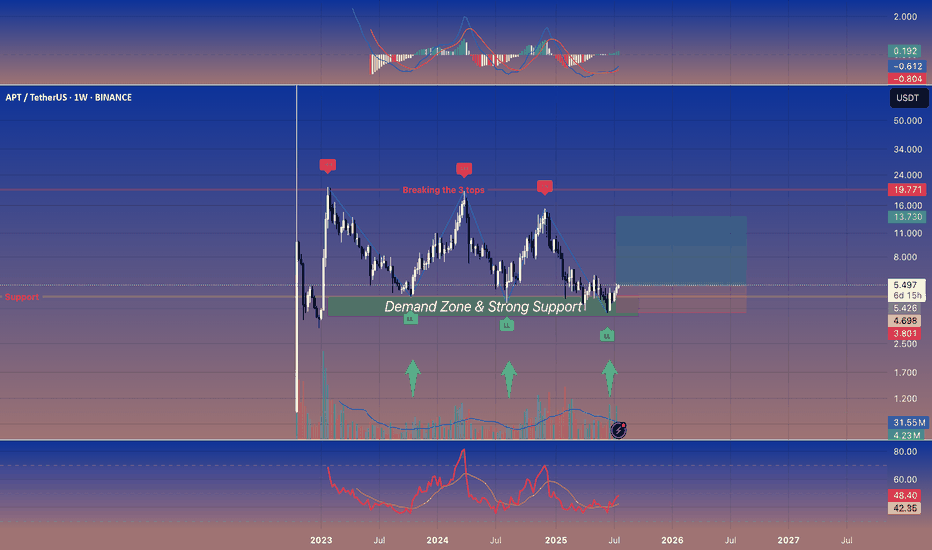
🚀 Aptos: The Sleeping Giant 😴🌋 APT keeps bouncing off a rock‑solid \~\$5 demand zone. If it finally pops above \~\$7.5‑8, the giant could wake up in a hurry. 📈 --- 👀 Quick‑Glance Weekly Checklist | 🔍 Focus | What’s Happening | | ------------------------ |...
🐂 BULLMASTER MODE ACTIVATED 🚀 BTCUSD ripping in a pristine up-channel 📈 – Wave (2) ✅, prime setup for monstrous Waves (3)→(5)! Key support at \~\$108K, next barriers \$114K–116K 🔥 Lock in longs, tighten stops, and let’s stampede to the moon! 🌕💥 \#Bitcoin #Bullrun #ElliottWave
Ethereum (ETHUSD) • Daily Chart 🚀 --- 🔑 Key Levels * Demand Zone (Support): \$2,350–2,550 * Price has bounced here twice in the last year. * Immediate Resistance: \$2,741 * Multiple rejections around this level recently. * Next Major Resistance: \$3,437 * Former highs in late 2024/early 2025. * Big Supply Zone (Strong Sell Area):...
1️⃣ 🟢 KAS/USDT KAS/USDT found a bottom at 0.0831 USDT and is now tracing a quick five-wave rally. A clean 4H candle close above 0.0875 USDT flips the bias bullish. First target: 0.0901 USDT. 🚀✨ 2️⃣ Wave Structure • Wave (1) peaked near 0.0872 USDT • Wave (2) held at 0.0831 USDT (strong flip) • Wave (3) climbed toward 0.0880 USDT • Wave (4) pulled back to 0.0862...
“Coiled price, loaded zones – when it pops, don’t blink.” 🐂 🔭 Big-Picture Structure - Descending wedge** (white) compressing since Nov ’24 → stored energy. - Demand Zone 2.15 – 1.97** (green) = 0.786 Fib **+ Major FVG** → institutional bid. - Supply Zone 3.20 – 2.85** (crimson) caps every bull raid since Jan. - Minor FVG 2.10 – 2.20** (teal) hugs wedge...
🚀 SOL Ready for Liftoff? 🌕 SOL just broke out of a beautiful falling wedge on the daily timeframe — a classic bullish reversal pattern 🕊️ 📈 After months of downtrend, we’re now seeing early signs of structure flipping and price reclaiming key zones. Here’s my bullish roadmap: 🔹 First Target Zone: $180 (testing previous support turned resistance) 🔹 Second...
📉 NASDAQ 100 🦢💥 By: Bullmaster 🐂 This isn’t just a chart – it’s a macro time bomb ticking louder each month. Zoomed out to the monthly timeframe, the US Tech 100 is sitting at the edge of a massive rising wedge, formed over two decades. We’ve completed what looks like a classic Elliott Wave 5-structure ✅ Every historic peak is marked: 🧱 Dot Com Bubble Peak 🏦...
My price action analysis for ETH, let's see what will happen


