Calon_Sultan
BMRI create double top formation in big timeframe 4200 is reasonable if this stock will rebound, but this big cap need more accumulation phase from big player 3600 area is make sense if we can touch it, all in
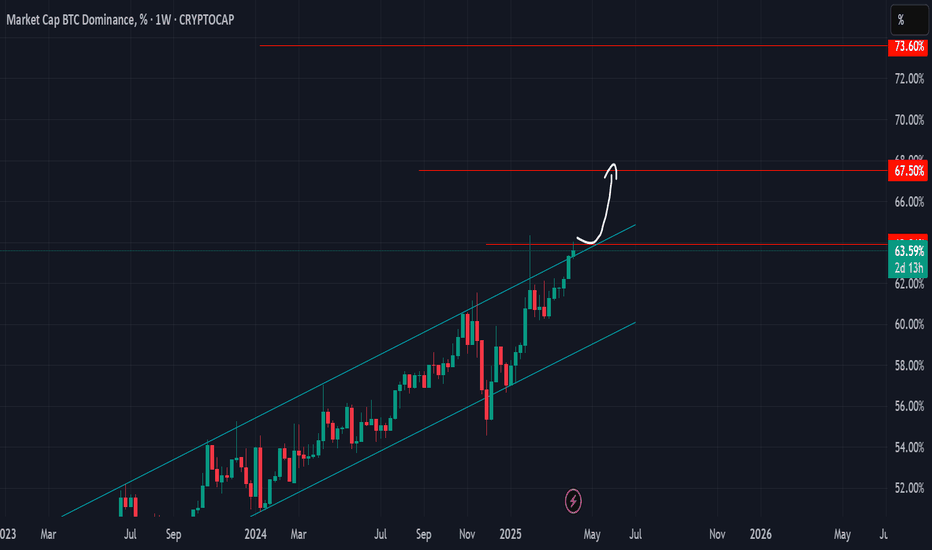
If dominance break above 64 this is also break bullish channel and maybe going parabolic to 67 or maybe can up to 70
One of the best times to buy blue chip stocks from Indonesia which is currently discounted 30% from ATH Quite simple, if it breaks and closes below 7600 then the bearish trend will continue and maybe we will meet 6500, but if 7600 is strong then we will likely push up with the first target at 8600 then 9800
The reason is here 1. Bitcoin still reject bearish trendline from January 2025 2. Flag pattern created from 10 March and before flag its down trend, chance to bearish continuation 3. CME gap at 84k, can trigger breakout flag pattern and more downside risk incoming from short seller 4. No more bullish sign till we can close above 96k 5. New moon on 29 March i...
OTHERS reject trendline from early December 2024 and early February 2025 simple, if we cant break trendline and go above 270, its so over 190 or lower incoming
CRV cant break current major resist and created wick in the top also we see final EW so short full leverage is legit here
ENA cant breakout trendline and create fakeout like before if ENA can't close above trenline we will see another rug like before
HYPE current condition sentiment is bad, and break uptrend channel, not yet retested But if we can retest channel around 15.5 till 16 doing short full leverage is legit
1. Fakeout on bearish trendline 2. Flag pattern from bearish trend legit to short
Insane price action, Flag pattern but its already breakout from downtrend trendline this is my scenario If Bitcoin can break above 90k, we are continue bull market But if Bitcoin can break above 90k and break below 84k bearish continuation ahead
Bitcoin bearish movement + flag pattern = Bearish continuation 82k is programmed
Bitcoin currently breakout triangle and now retest but wait, this price action is still in range of flag pattern from bearish trend, and now we can see like in mid point of flag so we must wait and see
Simple, ETH can go lower to 1.2k area cz of double top in high timeframe
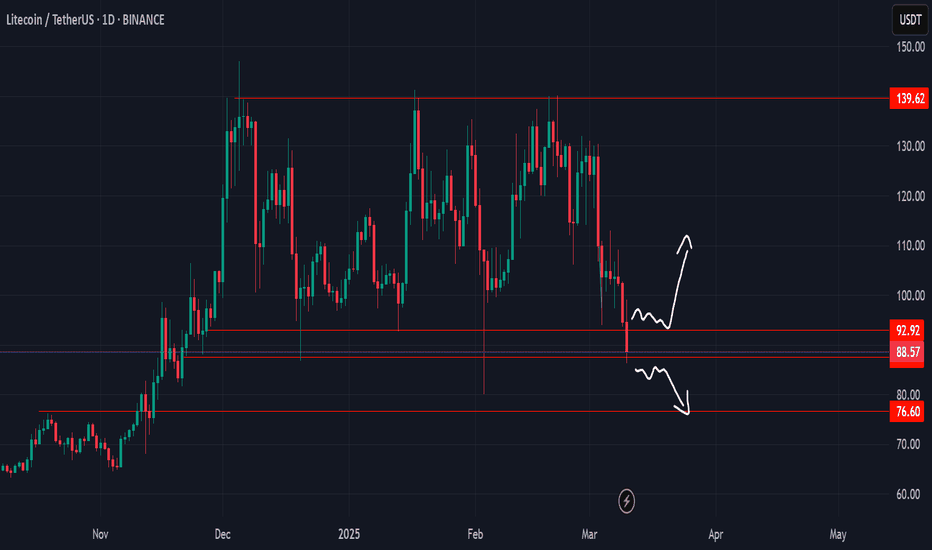
LTC is on strong support zone, but if can't go back to above 92, we can posible heading to 76
Dominance structure is pretty bullish after long wick And we are in mid level here, pretty sure if we can pump go to 63 in dominance in several days maybe
Chart is insane, most likely same on daily timeframe We can see maybe we are in Panic and Capitulation phase, and maybe will chop till end of Q2 after we see depression phase which will more drive price going rug ? FYI Doge is the legend Meme Coin, so please consider about "new" memecoin
Bitcoin will going down to sweep long position then if we can go back above 78k I think it will retesting 80k again
BBRI Broadening Wedge on H4 timeframe most likely will sweep low like invalidation Then retail fully out and sideways before next leg up


