Captain-MAO
PremiumRecently performed a liquidity sweep below the $0.066 level, taking out late longs and weak hands. This move marked a potential final low, as price quickly reclaimed the $0.066 zone and is now holding it firmly as new base support. This kind of reclaim after a sweep is a classic signal of accumulation and trap reversal, often leading to explosive upside moves....
From the initial buy setup, CROSS delivered an impressive +200% rally, confirming strong bullish interest. Over the past 20 days, price action formed a clean symmetrical triangle, signaling a healthy consolidation phase after the explosive move. Now, breakout and successful retest of the pattern have been confirmed, indicating that momentum is shifting back in...
Litecoin (LTC) has spent the last three years forming a textbook accumulation pattern, specifically a classic horizontal box range, with key support around the $100 zone acting as a historical floor. This level has held through multiple bearish cycles, showing strong buyer defence and accumulation interest from long-term holders and institutions. After a...
INIT has successfully double-bottomed around the $0.35 zone, confirming it as a strong demand area. The first leg off this support showed a powerful push from buyers, signaling renewed interest and a potential trend shift. Now, price action is heating up again as buyers step in aggressively with rising volume, reinforcing the bullish momentum.
FIS has shown an aggressive push from buyers, confirming strong demand as the price consistently defends the $0.10–$0.11 zone as solid support. This accumulation range has held firm despite market volatility, indicating a possible base formation. signaling momentum building for a breakout.
has been consolidating in a tight accumulation range for an extended period (~6 months), consistently defending the $0.04 support zone. Price action suggests a potential base-building phase, with buyers repeatedly absorbing dips below $0.04 and establishing a clear floor. A breakout scenario is developing as SOLV attempts to challenge the key resistance at $0.05...
has spent over 100 days in consolidation, and is now beginning to break through major resistance levels, signaling a structural shift in momentum. Price is currently forming a new base support above the breakout zone, indicating strong buyer interest and commitment to higher prices. This behavior reflects a classic breakout-retest pattern, where bulls defend...
BIO/USDT is showing signs of trend exhaustion after a prolonged downtrend, with price structure tightening and buyers stepping in aggressively. The chart suggests the worst may be behind, as bullish momentum builds at the base of the structure. The pair is now approaching the critical flip zone at $0.075, a level that acted as key support-turned-resistance. A...
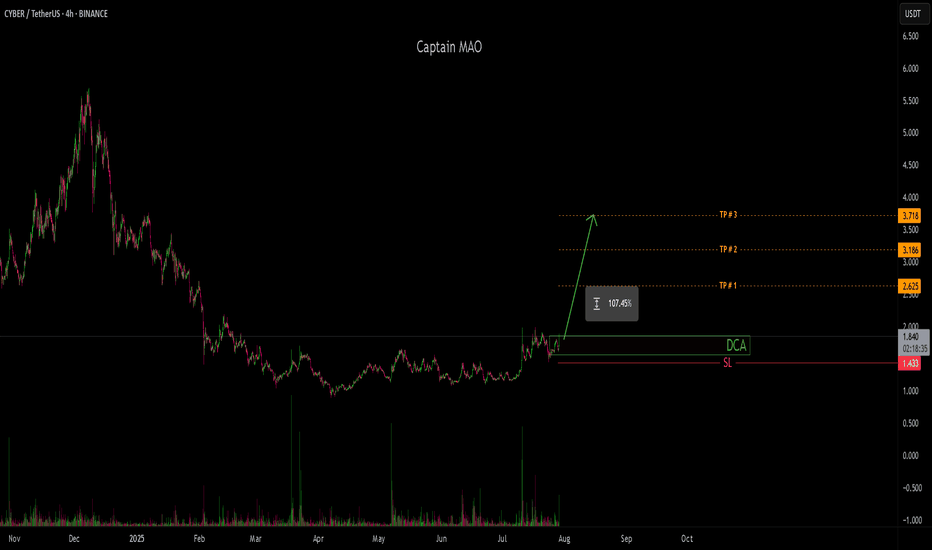
CYBER/USDT is nearing the end of a clear re-accumulation phase, marked by steady consolidation and higher low formations. The structure suggests that smart money has been loading in, preparing for the next major leg upward. Price action is tightening, and momentum is shifting—indicating a potential breakout from the range. Given the current setup and market...
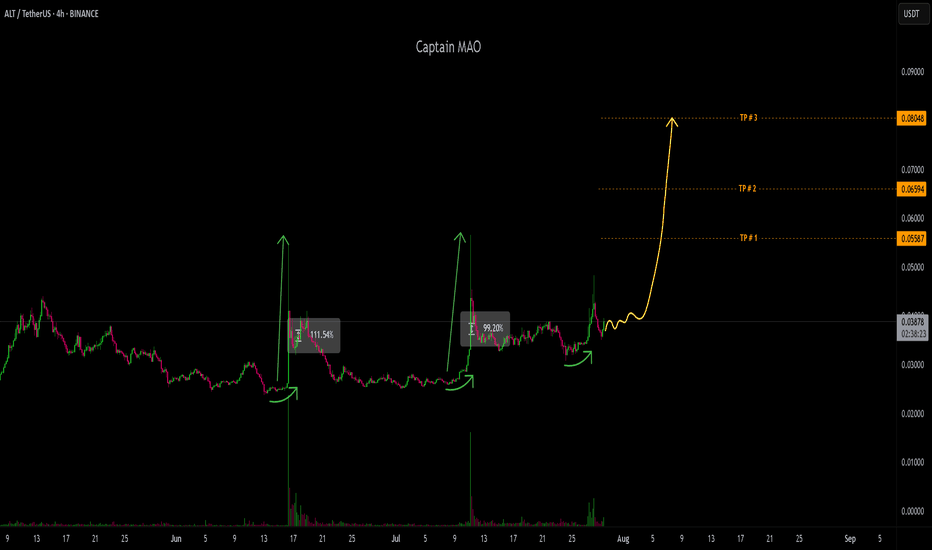
ALT/USDT is shaping a superbullish market structure, driven by aggressive buyer pressure and consistent demand. Price has repeatedly defended the $0.035 zone, which now stands out as a strong base support—a clear sign of accumulation and market confidence. This level has acted as a springboard for multiple bullish pushes, with buyers stepping in early and heavily...
Continues to maintain a bullish market structure, printing consistent higher highs (HH) and higher lows (HL)—a clear indication of sustained buyer control. Price is currently consolidating within an upward accumulation box, where buyers are actively absorbing supply on each dip. This phase reflects strong accumulation in an uptrend, often preceding an impulsive...
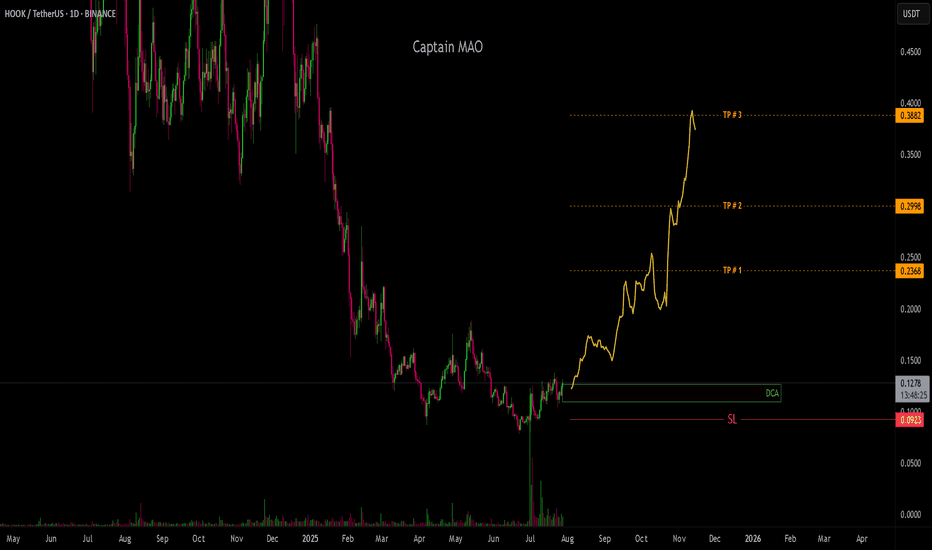
Has successfully reclaimed the critical $0.10–$0.11 zone, which previously acted as major resistance and is now flipping into new base support. This reclaim is a significant technical signal, suggesting that sellers are being absorbed and buyers are stepping back in with strength. The pair is now hovering above this reclaimed zone, consolidating tightly—a classic...
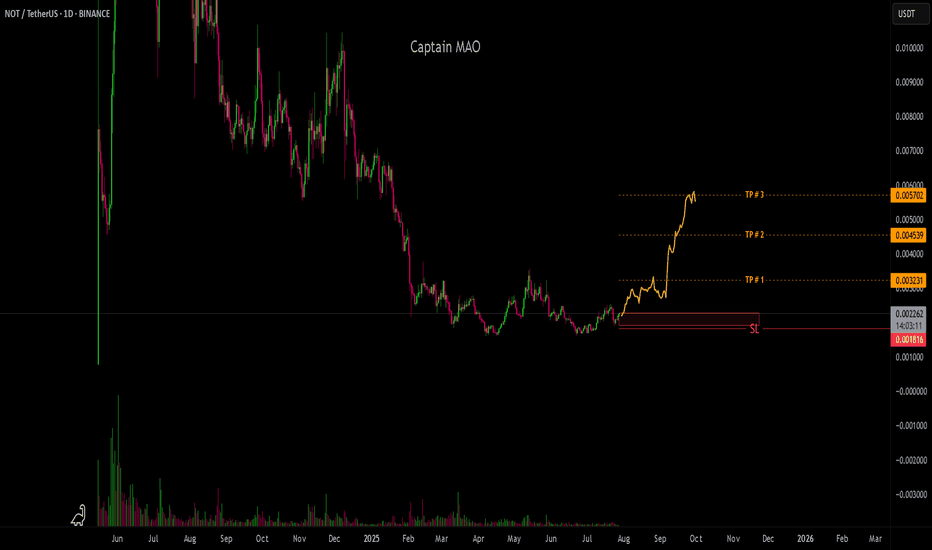
Has been ranging for over 170 days, forming a classic accumulation box structure, signaling strong base-building behavior. The long consolidation phase indicates that smart money may be actively accumulating before a major rally. Price action is showing early signs of reversal, with demand stepping in near the lower boundary of the range. Breakout attempts are...
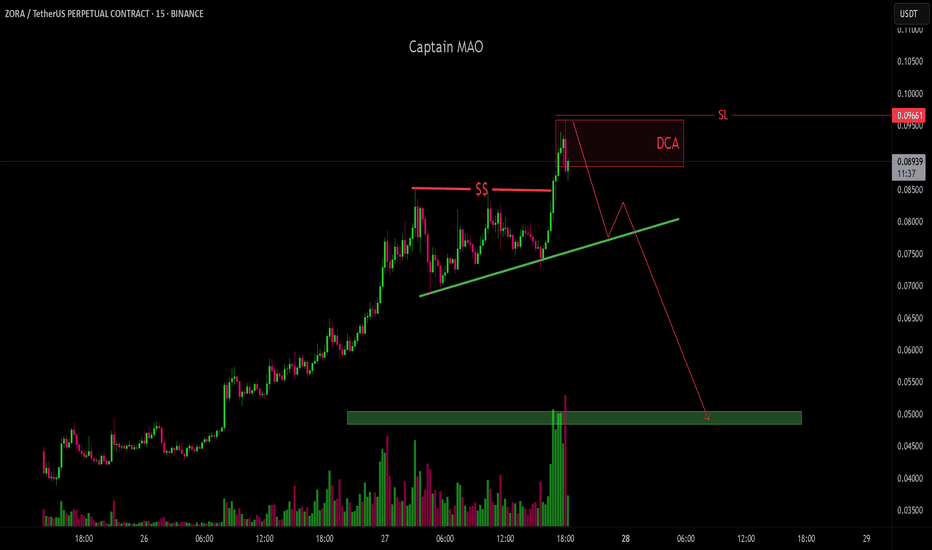
has recently completed a massive rally, surging nearly 700% since its July 2025 . Price has now swept key liquidity above the 0.085 level, marking an exhaustion point after a parabolic advance. liquidity grab in this zone, indicating potential bull trap behavior and weakening
has delivered an explosive move since July 2025, rallying nearly +700% from its listing price. This kind of parabolic price action typically marks the climax of a strong impulse wave, especially for newly listed tokens on perpetual markets. Currently, ZORA is showing early signs of exhaustion, with price stalling near recent highs. Momentum indicators are...
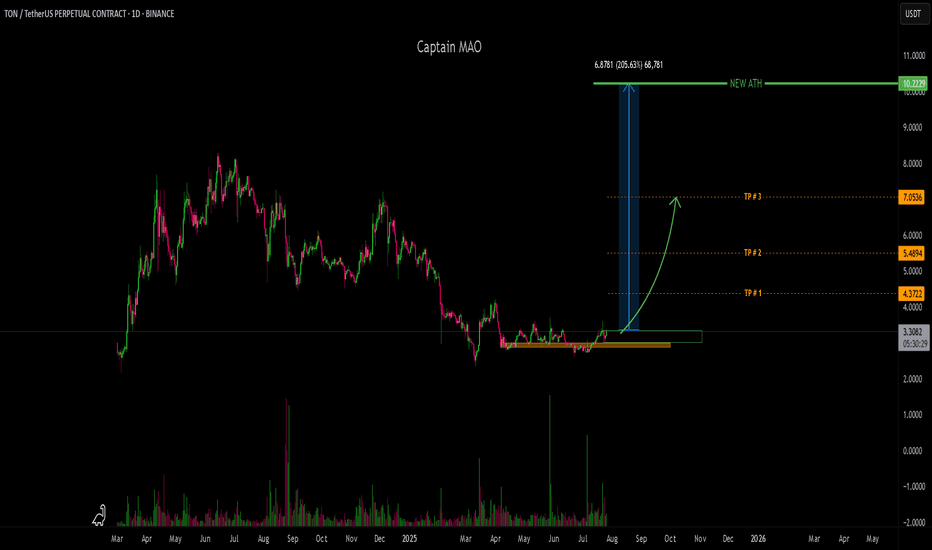
TON/USDT has been in a sideways consolidation phase for over 100 days, tightly ranging between the $2.90–$3.50 zone. This prolonged accumulation is forming a solid base structure, often seen before major trend reversals in high-cap altcoins. Recent price action is beginning to show early signs of bullish momentum, with buyers gradually stepping in and volume...
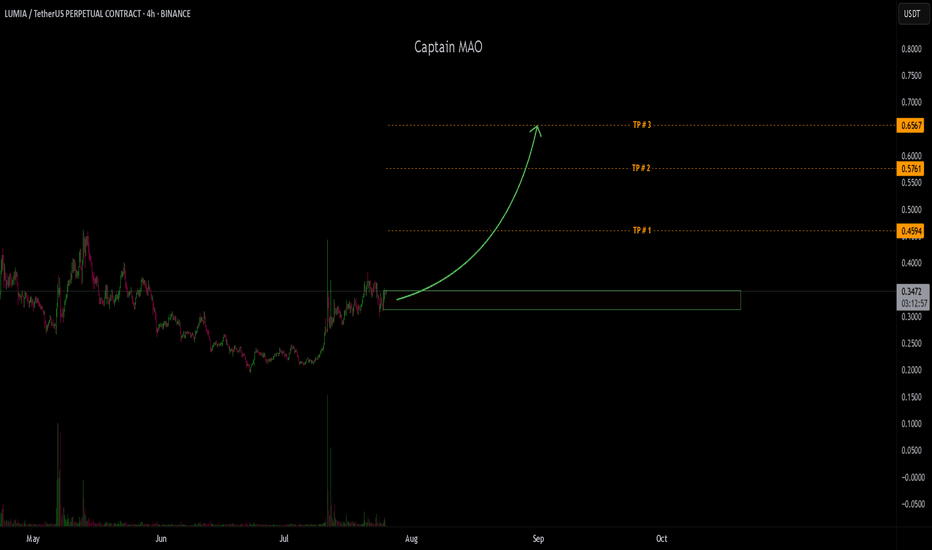
LUMIA/USDT has shown strong bullish momentum, with the first leg printing over +100% gain—signaling early strength and buyer dominance. Over the past two weeks, price action has been consolidating in a tight re-accumulation phase, forming a healthy base just above previous resistance . This phase appears to be nearly complete, and the chart structure suggests it's...
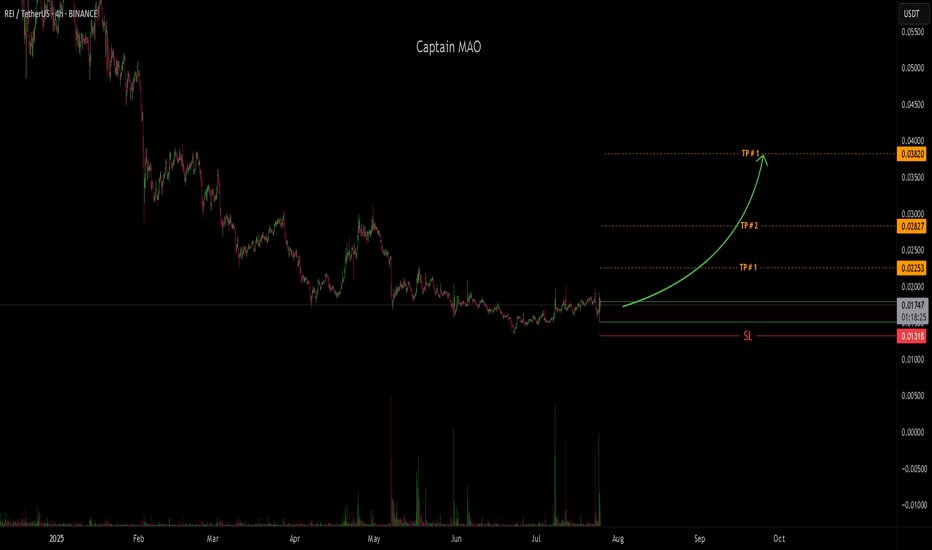
REI has consistently defended the $0.015 zone for the past 40 days, signaling early signs of a potential reversal point in alignment with the broader market cycle. This base-building behavior suggests strong underlying demand, making it a high-potential setup. A breakout with a "god candle" could be the first major sign of trend reversal. The green box marks a...


