ClearTradingMind
PremiumIn this time I am going to look a long in this pair because I can see a strong double bottom formation with strong demand area. After touching this demand zone, price bounced back and now making a triangle breakout. The breakout from the triangle gives more power to the upside move, and I am expecting price to continue bullish till 172.900 level. After reaching...
Nifty Bullish Outlook -Current Price: 24,905 (approx) - Key Demand Zone: 24,620 – 24,660 - Key Supply Zone: 25,200 – 25,240 Technical View - Strong Demand Bounce: Nifty reversed sharply from the demand zone (24,620–24,660), indicating strong buying interest. - Trend Breakout Potential: Price is approaching resistance near 24,920; a breakout could push ...
EURAUD – Bearish Outlook - Key Zone: 4hr FVG (Fair Value Gap) near 1.7800 – 1.7820 - Fibonacci Levels: Retracement aligns with 0.5 – 0.618 zone, potential reaction point. - Expected Target: 1.76350 Analysis: 1. Market shows a downward structure with lower highs and lower lows. 2. A possible pullback into the FVG zone could trigger a bearish...
AUDJPY – Bearish Bias - Pattern: Double Top + Supply Zone Rejection - Current Price: Around 96.65 - Expected Target: 96.10 - The chart shows a double top pattern near the supply zone, signaling potential weakness. - Price failed to break above the supply area twice, creating bearish sentiment. - A pullback towards resistance followed by rejection could...
- The price is approaching a supply zone near 119,450 – 120,000, where previous selling pressure existed. - Structure shows a potential lower high formation, signaling bearish momentum could continue. - Risk-to-reward ratio looks favorable if entry triggers at 119,450 and target is 115,200. - Confirmation with bearish candle rejection at the supply zone is...
On the 1-hour chart, EURNZD is approaching the 0.618 Fib retracement level and testing a Fair Value Gap (FVG) 🟧 after a strong bearish move. - Supply + OB zone above 1.96600 is acting as resistance - Demand + OB zone near 1.94000 is the target area Plan: - Expecting a rejection from current levels (1.95500 – 1.95700) or from the upper supply zone 🎯 Target:...
On the 1-hour chart, EURUSD tapped into the 4hr Supply + OB zone 🟧 and failed to hold above previous structure. - BoS (Break of Structure) shows weakness at highs - ChoCh (Change of Character) confirms bearish shift - Price rejected from 0.236 Fib level (1.17400) and is moving lower Plan: - Expecting price to move toward 1.16200 (≈ 120 pips from current...
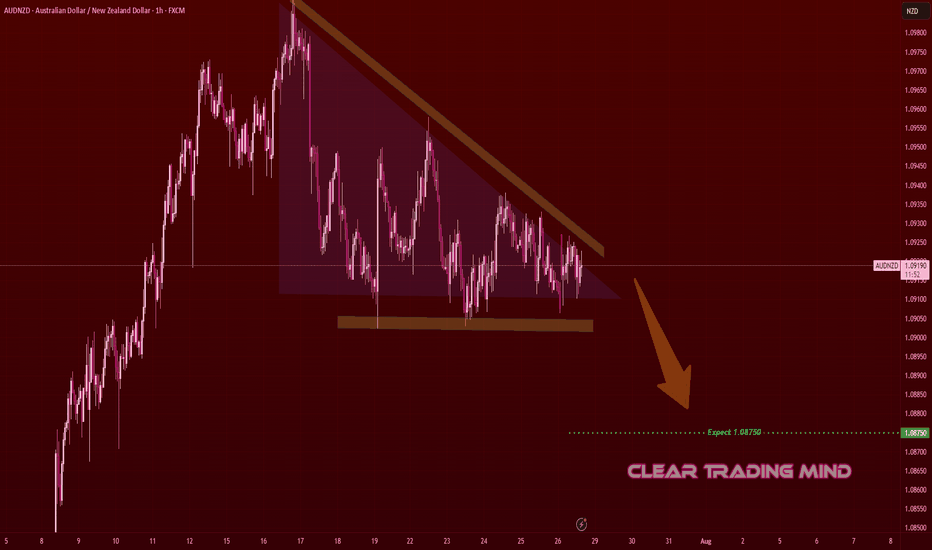
On the 1-hour chart, AUDNZD is forming a descending triangle 📐, a bearish continuation pattern. - Horizontal support is holding but getting repeatedly tested - Lower highs indicate selling pressure Plan: - Break and close below support may trigger a bearish continuation - Target: 1.08750 🎯 (≈ 35 pips from current price) - Invalidation if price breaks above...
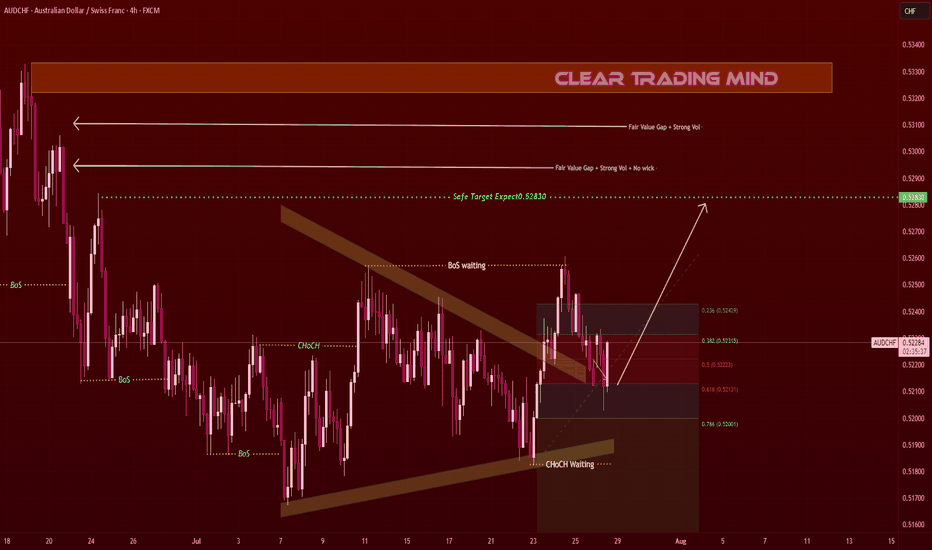
AUDCHF on the 1-hour chart is respecting a contracting triangle pattern 🔺 and showing bullish intent. From a 4hr perspective: - Fair Value Gap + Strong Volume Zone 🟧 above price - Safe Target: 0.52830 Key Observations: - CHoCH waiting for confirmation (bullish structure) - BoS expected above the triangle top - Current pullback holding near Fib 0.382 –...
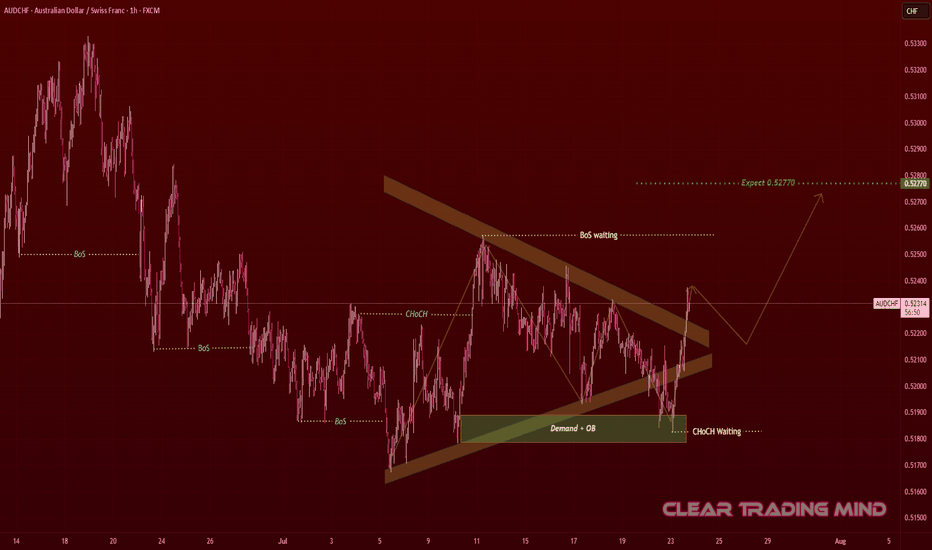
AUDCHF on the 1-hour chart is forming a contracting triangle 🔺, showing consolidation after a downtrend. From an SMC perspective: 🟩 Demand + OB (Order Block) zone holding strong near 0.51900 🔄 Previous CHoCH shows buyer interest ⏳ Waiting for BoS (Break of Structure) confirmation above the triangle Plan: * Breakout Entry: Above 0.52400 after retest...
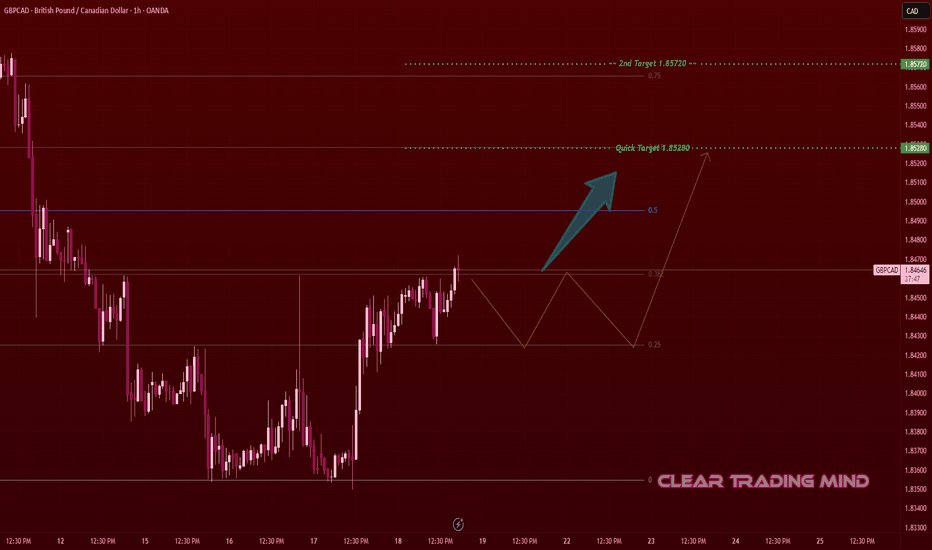
This is my personal setup for GBPCAD on the 1-hour chart. After a strong downtrend, the price has started to form a bullish reversal pattern from the 1.83600 zone. I’m watching the current bullish structure which is showing good strength and higher lows. 🔹 Entry Idea: I’m planning to enter above 1.84700, once price confirms a breakout and retest. This level also...
CADCHF is compressing within a descending triangle structure, showing signs of bullish intent as it continues to reject a key demand + 1H order block area. 🔹 Trade Idea: I’m watching for a bullish breakout above 0.58380, which will also confirm a trendline breakout from the descending triangle. Until then, I remain on the sidelines. 🔹 Key Technical Factors: -...
🔹 Current View: I'm closely watching the 107,240 zone, where we have a strong Demand + Order Block + CHoCH (Change of Character) setup. This is a key support area that could trigger a fresh bearish move if broken. 🔹 My Plan: I'm waiting for a clear breakout below 107,240 to enter a short position. ➡️ Entry: 107,240 (after confirmed breakout) ➡️ Stop Loss: 109,750...
🔹 Current View: Price is falling from the Shooting Star Candle + Supply zone and is now near a key short-term support at 3295. 🔹 My Plan: I'm waiting for a clear break and close below 3295 to enter a short trade. ➡️ Entry: 3295 (breakout confirmation) ➡️ Target: 3266 ➡️ Further drop possible toward demand zone below 🔹 Supply Zones Noted: - 3340–3350: Supply +...
🔹 Current View: The pair has formed a Double Bottom pattern around 1.8500 after a strong bearish drop from a Double Top near the 4H Supply Zone. This indicates a potential reversal. 🔹 VWAP Insight: The blue line is VWAP, acting as dynamic resistance. Price is currently testing this area. A clean break above it could confirm bullish momentum. 🔹 My Trading...
AUDNZD has broken out of a prolonged consolidation box, supported by a demand zone below. Price is currently retesting the breakout level, which often acts as a launchpad for the next move. 🧠 Key Observations: 🔷 Consolidation Breakout – Price cleanly broke above the consolidation range. 🔁 Retest in Progress – A potential bullish retest is unfolding at...
The recent structure on USDJPY (4H chart) shows a bullish shift supported by a strong double bottom formation within a defined demand zone. After a clean impulse from the bottom, price is now consolidating below the key resistance. 🔹 Trade Idea: I am patiently waiting for the price to break and close above 145.310 to confirm bullish continuation. Entry is valid...
Crude Oil (USOIL) is forming a potential bullish reversal structure on the 1H timeframe, supported by repeated bounces from a well-respected demand zone. Price currently consolidates below the key resistance level with a visible expanding channel, hinting at possible volatility and breakout. 🔹 Trade Idea: I’m waiting for a clear break and close above 66.50 for a...


