CmpCryptoInsights
BINANCE:AIUSDT.P NYSE:AI ⚠️ HIGH RISK TRADE Recommended Leverage: 25x 🟢 LONG Expecting the price to bounce from the white lines support. 📈 ENTRY: If 4H CC above (0.11880), DCA (0.11752) 🎯 TAKE PROFIT: Yellow Lines 🛑 STOP LOSS: 0.11616 (📊 4H Candle Close Below) ⚠️ High Risk – Manage Your Position Wisely! 📌 NFA – DYOR 🧠
BINANCE:HYPEUSDT.P ⚠️ HIGH RISK TRADE 🛑 SHORT The price is within a rising wedge pattern and exhibits bearish divergence. 📈 Entry if breaks below (38.256), DCA (38.659). 🎯 TAKE PROFIT: Blue Lines 🛑 STOP LOSS: 39.213 (📊 4H Candle Close Above) ⚠️ High Risk – Manage Your Position Wisely! 📌 NFA – DYOR 🧠
Hey traders, ✅ Altcoin Season Index Currently at 47, a neutral zone — not yet favoring altcoins True altseason usually begins when the index rises above 75, showing consistent altcoin outperformance Historically, transitions from this level to full altseason take around 1–3 months, assuming BTC dominance declines ✅ Bitcoin Dominance (BTC.D) BTC dominance is...
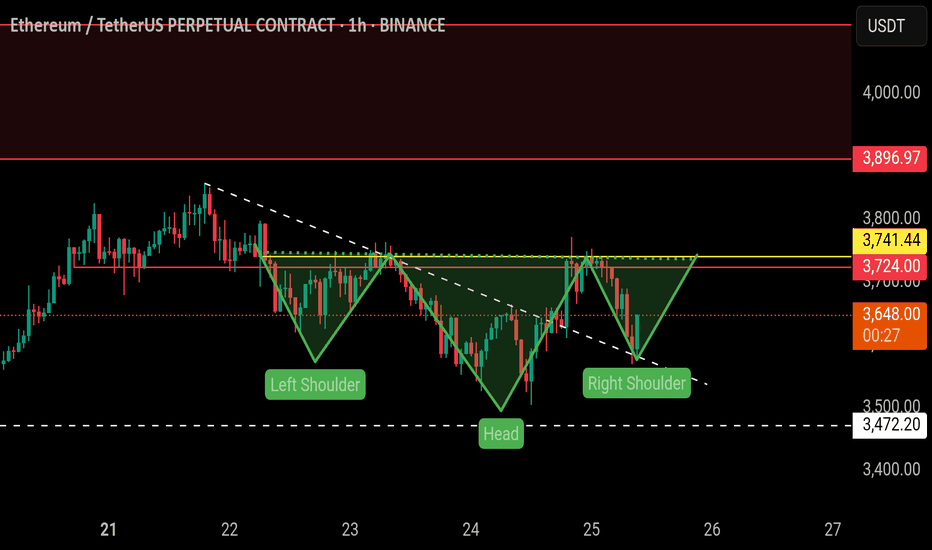
BINANCE:ETHUSDT.P On 1H TF, the price is forming inverted head and shoulders pattern, which is a strong bullish pattern. The price has retested the trendline support and bounced back. Expecting it to breakout above yellow line soon. A breakout above the yellow line will be a bullish and pattern confirmation. We can initiate a long entry from here. Please...
MEXC:BTCUSDT.P 🔹 Price pushing through key resistance zones BTC just tapped the 0.618 Fibonacci level (119,212) after breaking above 0.5 — signaling strength in short-term momentum. If bulls can hold above this level, the next logical targets are: ➡️ TP1: 119,976 (0.786) ➡️ TP2: 120,950 (Full retracement) 🔸 Key Support: 118,675 🔸 Invalidation below:...
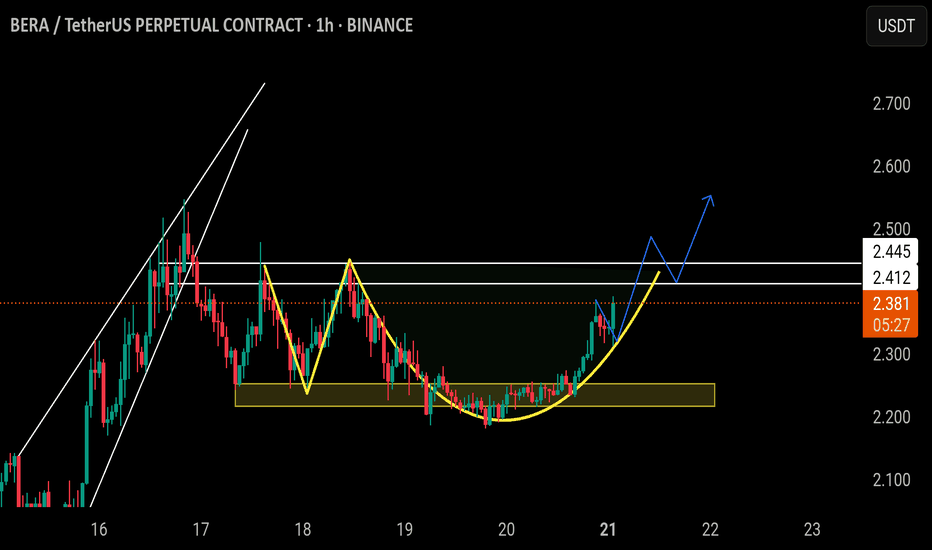
BINANCE:BERAUSDT.P $Bera/Usdt The price is forming Adam and even pattern, if the price able the break above the white lines resistance, following a successful retest, the price will go higher and higher. Aggressive entry at Current market price. Safe entry after the breakout of white lines resistance following a successful retest of the white lines. NFA DYOR
$Wif/Usdt BINANCE:WIFUSDT.P The price is formed the Inverted head and shoulders pattern and did a breakout of the neckline, expecting the price to retest green lines (neckline). If 1H CC hit and bounce above the green lines, it'll be a long opportunity. Entering at current price will increase the SL, it's suggested to wait for a retest, to have better entry...
BINANCE:BTCUSDT.P 🚨 BTC has cleanly broken above $120K, tagging $123,300 today (ATH) — pushing the top boundary of a well-respected rising channel that’s been in play since April. 🔍 Analysis: Structure & Trend: Price broke out of a Descending Triangle back in March — that move initiated a trend, not just a spike. Since then, BTC has followed an ascending...
CRYPTOCAP:INJ BINANCE:INJUSDT.P The price recently broke out from the inverted head and shoulders pattern; now, the price is going to retest the pattern's neckline. If the price hits and bounces above the white line zone, or if the 4H candle hits and closes above the upper white line, it will be a good long opportunity. TP: YELOW LINES SL: 12.052 / 4H CC...
Volume weighted Moving Average 🔍 VWMA in Crypto Trading Smarter than simple MAs. Powered by volume. What is VWMA? 🎯 VWMA = Price + Volume Combined Unlike SMA/EMA, VWMA gives more weight to high-volume candles. ✅ Shows where the real trading pressure is. Why Use VWMA? 💥 Volume Confirms Price Price movement + High Volume = Stronger Signal VWMA adjusts...
BINANCE:ENAUSDT.P After breaking out from the falling wedge pattern, the price hit a massive swing TP +500 ROE, Now the price is hovering above the support zone (Blue lines). If the price can hold above the support area, it'll likely continue the upward momentum. TP: Yellow Line SL: Red line
BINANCE:ETHUSDT.P The price did a breakout above the channel but failed to hold above it and dropped back into the descending parallel channel on the 4-hour timeframe, reflecting a short-term bearish trend. The price has been making lower highs and lower lows, gradually grinding toward the immediate support zone between $2,399 and $2,363. The price did a...
CRYPTOCAP:SOL BINANCE:SOLUSDT.P Solana is currently trading within a descending wedge pattern on the 4-hour chart, which is typically viewed as a bullish reversal structure. The price action is compressing between the converging trendlines, suggesting a potential breakout may be on the horizon. The current support zone between $164 and $167 is holding...
CRYPTOCAP:BTC Update: BINANCE:BTCUSDT.P Bitcoin is trading within an ascending triangle pattern, which is typically considered a bullish structure. It is advisable to wait for a confirmed breakout or breakdown from this pattern before considering any entries. The chart color-codes all potential support zones, ranging from minor to major zones, based on...
HIGH RISK BINANCE:RDNTUSDT.P NASDAQ:RDNT The price recently broke out from the Inverted head and shoulder pattern, expecting the price to retest the yellow line. Wait for the price action around the yellow line before entering it. TP: Blue lines SL: Redline / 4H CC below Note: It'll be a swing trade, SL is wider then the regular SL, due to nature of the...
BINANCE:GRIFFAINUSDT.P On the Daily timeframe, after an extended bearish trend, the price broke out of a falling wedge pattern and surged by 189.92%. Currently, the price is consolidating just below the daily resistance level (marked by the red dotted line). The price needs to break above the daily resistance with strong volume for the upward momentum to...
BME:VANA / USDT – Adam & Eve Double Bottom Breakout VANA has completed an Adam & Eve double bottom pattern on the 4H timeframe, which is a strong bullish pattern, now trying to break above the resistance zone. A successful breakout suggests momentum shift in favor of bulls and potentially continue upward moment, following a successful retest may be an...
🟢 ETHFI/USDT – 4H Double Bottom Breakout BINANCE:ETHFIUSDT.P 📍 Timeframe: 4H 📊 Setup Type: Double Bottom (Reversal) ⚠️ Risk Level: Low-Moderate 🧠 Technical Breakdown: Price has formed a Double Bottom pattern, a strong reversal structure signaling seller exhaustion and potential trend reversal: Both bottoms are well-defined and near-equal in depth, signaling...


