CryptoPilot
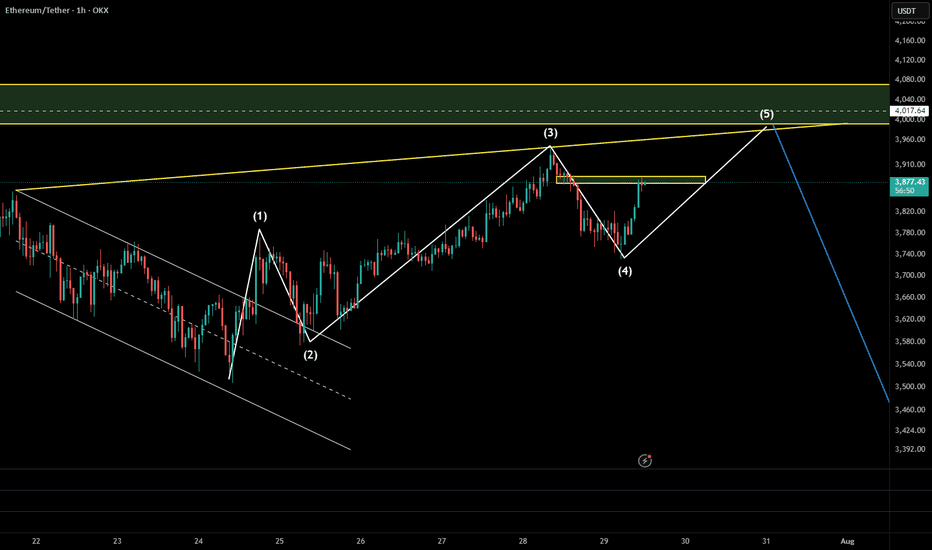
PremiumETH is moving within a rising channel, but momentum is fading. Price failed to break above the midline and is now testing lower support. A fakeout to the upside toward the $4,015–$4,050 supply zone is possible before a deeper drop. The projected path suggests a short-term bounce, final liquidity sweep, then potential reversal. 🟡 Key Resistance: $4,015 🔻...
⏱ Timeframe: 4H / 1H 🔍 Method: NeoWave + Smart Money Concepts (SMC) 📍Posted by: CryptoPilot ⸻ 🧠 NeoWave Progression Update As outlined in our previous analysis, we are tracking a potential Contracting Diametric structure (A–G) originating from the March 2025 highs. 🚨 The G-Leg may now be actively unfolding. Here’s what just happened: • Price rejected sharply...
Timeframe: 4H + 1H Methodology: NeoWave (Glen Neely) + Smart Money Concepts (ICT/SMC) Posted by: @CryptoPilot ⸻ 🧠 NeoWave Analysis: Complex Correction Ending? From a NeoWave perspective, BTC seems to be in the final stages of a Complex Correction that started in March 2025 from ~72k. The upward move appears to form a Contracting Diametric structure (7 legs:...
Are you Ready to Touch 4000$ and start BIG Drop? ETH is in final reound of 5th wave of 5th, 5 of 5. After that I expect a BIG drop
Yesterday, we anticipated a bullish reaction from the 4.20%–4.22% support zone, and the market followed through perfectly. The current structure is forming a contracting triangle (ABCDE), and we are now likely heading into wave E. 🔹 Wave Structure (NeoWave View): Wave D has reacted sharply from the expected support. Wave E is now in progress, targeting the...
📉 SUI/USDT Update – Bearish Structure Confirmed Yesterday, we shared a bearish outlook for SUI from the $4.2 region, anticipating a potential rejection from that key supply zone. Since then, price has respected the resistance and shown early signs of weakness. Here’s what we’re seeing now: 🔹 Elliott Wave Perspective Price seems to be completing a Wave C of a...
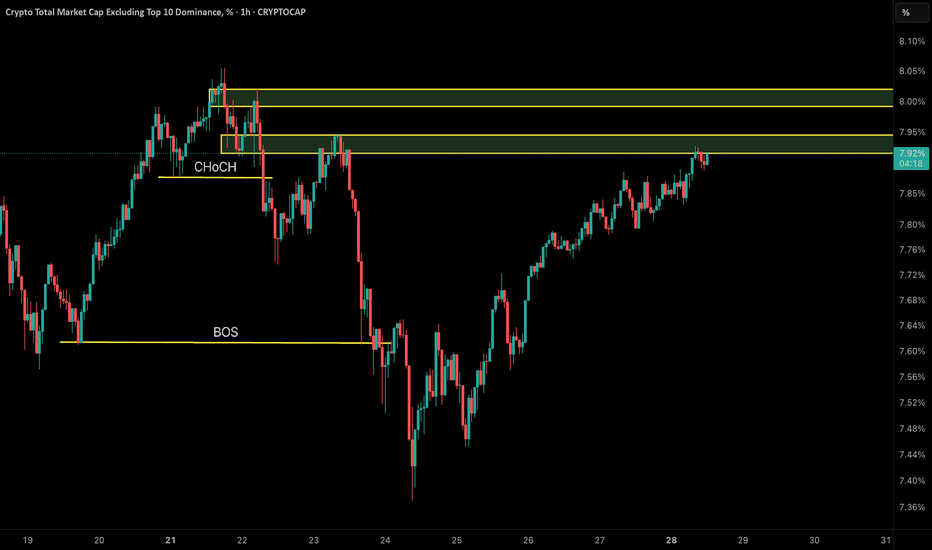
🟡 Structural Analysis: 🔸 First, a CHoCH (Change of Character) occurred around the 7.87% level, formed by the break of the first key low and the failure to create a new high. This was the first warning sign of a trend change from bullish to bearish. 🔸 Then, by breaking the previous support low, the market formed an important BOS (Break of Structure) near 7.61%,...
We are currently observing a Symmetrical Diametric correction pattern unfolding in the USDT Dominance chart. The wave structure labeled A–B–C–D–E shows clear evidence of this complex formation. ✅ Reasons for Diametric Labeling: • Wave A and B initiated the pattern with a sharp drop (A), followed by wave B extending lower than A’s starting point – an early sign...
SUI has been climbing steadily inside a well-structured ascending channel for the past few weeks. The recent breakout above the $4.30 resistance zone – which was a key liquidity level – seems to have swept stop-losses and trapped late buyers. 🔎 Here's what we're watching: - Price broke out of the ascending channel briefly and rejected from the upper parallel. -...
🔻 Bitcoin at Descending Channel Resistance – Watch This Level Closely! 📉 BTC/USDT is currently testing the top boundary of a well-defined descending channel on the 2H chart. 🟨 This zone has acted as strong resistance in the past, and the current reaction suggests the potential for a short-term rejection. Unless we see a clean breakout above $120K with strong...


