CryptoTaoist
PremiumThe market's bullish narrative rests first and foremost on the control of volatility. I won't go too much deeper into that right now, but I have been discussing with AI the current period of volatility expression and would like to highlight the following points about the current period: 4d VIX RSI has not had a 5 point increase since April 1 of this year. ...
According to my discussions with ChatGPT and analyzing various metrics we are currently in one of the longest periods, if not *the longest* period, of Vol suppression in the entire history of volatility. Zooming out and looking at the current chart pattern VIX is very clearly in a falling wedge, which means its falling days are numbered. Once you see a daily...
We can see the classic bull flag consolidation pattern which has been going on ever since the stock market decided to go on a rager! Even with that going on, smart money continues to buy gold on the dips as you should too. Once Trump installs a phoney new BLS chief and moves to pressure the Fed by nominating a new governor after Kugler's departure the...
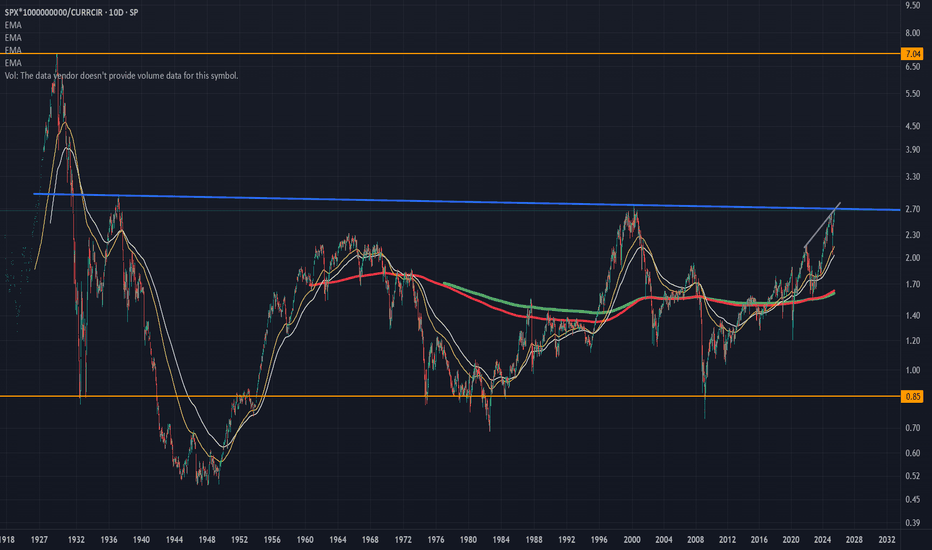
Here is a chart of the entire S and P history versus total currency in circulation. This gives bubble periods (anytime the value is over 2) and times when the market crashed after being in a bubble. If you notice we are fast approaching the line that broke the neck of the market in the 60s and 2000 dotcom bust. If we clear that line, hold on to your hats...
Keeping in line with the massive dollar dump that is about to occur, it is gold that will be the biggest beneficiary. If it keeps its current rate of advance, it will double in value before the end of '28!
DXY testing its last support line before the slide into a steep value crush. What's another 5 trillion added to the debt anyway? Billionaires need more tax breaks!
See here the entire futures contract (ES front contract) history for the S and P. What becomes very clear from connecting the lows is that the S and P has been growing parabolic over its futures chart *entire* history. So we are now at an inflection point in the stock market history. For the first time this year, we below the parabolic arc. It reclaimed it in...
Here we see a big picture look of what Bitcoin is currently up against. You'd think with making a 20% gain in the last 10 days, we'd be able to blast right through this "puny" ~52.5k level. Why is Bitty struggling now? Well the answer goes back to 2020 and 2021. You see the 52.5K area is a massive resistance level in it's own right. It was exactly the...
SPY 10 day RSI is trapped in a rising wedge and absent some massive injection of capital from somewhere (May rate cuts?), we will break the wedge right in line with the old saying, "Sell in May and Go away!"
With a massive 20% gain in the last 10 days, Bitcoin is cruising ever higher. But the real test is now upon us. Bitcoin is right now touching a huge old channel resistance line. This resistance line goes all the way back to 2013 (shown here back at the bottom of the 2020 market) and bitcoin has failed on a number of instances to clear it since it broke below it...
We are already above the highest 3 day bar close of *last year* and it's only the very beginning of the 3 day period and we are still fairly early in the month and early in the year. The 3-day bar is for sure going to test 47505 (white line overhead represents the 150 day average and if it does it all today, or breaks through it today, that's big. The point...
Disclaimer: previously I was short, but as new market information presents itself, it must be followed. Bitcoin just made a major bullish move which is the recapture of it's original October bullish trendline which had broken in the Grayscale sell off. This is majorly bullish. Additionally, we spent several days testing and confirming the major Fibonacci...
Bitcoin rising wedge against it's old bullish trend line. Once it breaks below the line (probably this weekend), it will need to find real support. This ain't it.
We have ever shortening boom bust cycles... Using RSI as a gauge every so often we see deep dips in RSI. (I use 144 RSI not 14 and this is a monthly timeframe.) The first one from the Panic of 1893 to the Great Depression of 1932. ~40 years. The second one from the true end of the Great Depression (1942--US WWII production boom) to the Nixon-Vietnam-Energy...
I want to call particular attention to those calling for 100K bitcoin this year and why, if history is any judge we will not touch that figure for 3-4 more years at least. Follow me on a longterm history of bitcoin price movements, courtesy of Bitstamp, the oldest running record of bitcoin price history going back all the way to 2012. In the picture above, I...
This seems more realistic to me based on past performance. The only thing tough to capture is that there is a steepening in the bottom trend line each cycle. how much that bottom trend line steepens this cycle is the only question. But confirm it, it will. The market demands it. Yes, I know ETFs, world governments monetary systems collapsing, bitcoin will...
Bitcoin is making a classic head-and-shoulders pattern. The neckline is at ~40600. A daily close below this line activates the pattern. A daily close above the right shoulder invalidates the pattern. ~44000 Target is the same as the distance of the head to the neckline. ~33500. Goodluck.


