CryptocurrencyBlot
one day chart,. I confused the week chart setting for the day and found more optimism than there truly is. Still the line are converging and separating and creating time as a chart to distance oneself from reality only to get lost in the timeframes of trade.
Ethereum is not priced for an only up direction as of right now, unlike Bitcoin. As seen in the chart and indicator. The pink and purple dotted lines are close to intersecting and if the pink link crosses over this is a good sign for the chance of a neutrality and even a possible upward forming price chart position.
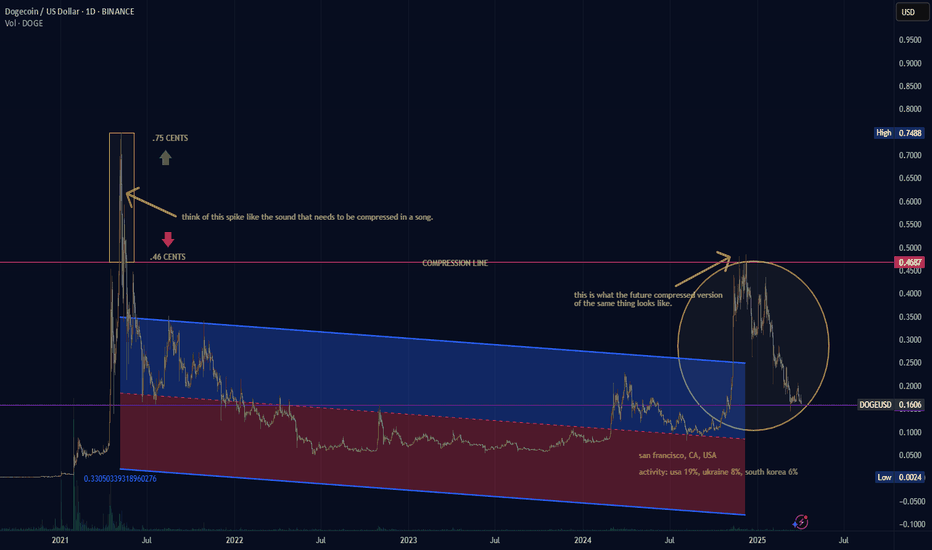
is the fantasy over for Dogecoin? The future version versus the present tense, versus the past, is something to speculate over and theorize on whether what people say about what happened in the past versus the past few months, is worth taking a look at. All the time in music people compress music and think the music is better afterwards. By applying the same logic...
Long form wave count would appear to be in trend with an entirely new cycle for Cosmos, potentially, although I did not go all the way back to the origin of the company which is necessary to get a true depiction of history. Is the history of a company based on short lived moments or is there any knowledge to keeping track of the trend of a company through the...
It is not use in being ahead of the price trend if the price is not going to recovery before Bitcoin, Ethereum, Dogecoin. Dogecoin used to be the one to measure between the big three cryptocurrency prices. Nowadays, Dogecoin is so popular with such a strong price hold and the fact that the unlimited coins means to measure Dogecoin is quite a bit more strange when...
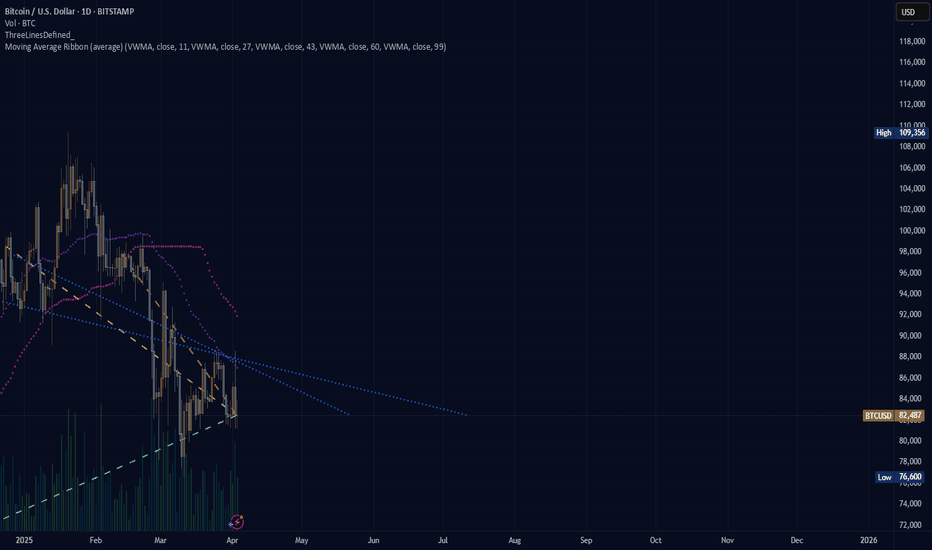
Where is bitcoin going to be during this 2025 year. The image shows a blank canvas. The drawing untold, unknown for now? Where will the price move and how long will it take to move through the pattern, bearish? bullish? neutral? fire? ice? greener pastures? The graph showing what is being seen tends to see a rise in price once the price moves past the crossing of...
Ethereum update. Nothing per se to analyze. More of an image to share with two indicators. Not much else to say here. It would be better if the average lines (pink and purple) had dots closer together. The further those dots become on a descent, the higher the likelihood there is of a big drop in price. We want the purple line to begin to curve in a reversal...
The price of Dogecoin is considered oversold based on an Elliott Wave custom pattern by DGT that I sometimes use to look for overbought and oversold signals. The four diamonds is similar to Jasmycoin's oversold signals.
DGT pattern indicator featuring elliott waves. Green diamond is major oversold, green triangles is minor oversold, same for peaks only circles and so on. I'm seeing a lot of oversold signals in cryptocurrency using this indicator, including Ethereum, the blockchain Jasmy is run on as a layer 2 token IoT company.
bar array pattern fading in and out of a low motion pattern indicator. Use examples from the past to understand the meaning. included lines from previous posts unchanged in purple representing key moments of the jasmy chart for reference. The price broke the previous lows.
Something to consider when developing an NFT project to be offered on Opensea; Even though Base is offered as an alternative to Ethereum, the highest cost blockchain, B3 is tradable. With NFT projects an aspect of their profitability comes from the tradability history of Ethereum NFT information, as we know. If you consider developing and offering an NFT on...
I was recently looking into NFTs on Opensea and while doing so I noticed there are far more NFTs from people based on the Ethereum blockchain compared to the other offerings on Opensea. Even though Solana (SOL) is on the forefront of popularity with Meme projects Opensea does not offer an exclusive Solana chain to provide NFT ideas. Hence, there is not an easy way...
Polygon was originally listed to Coinbase on 3/11/2021. Now what was MATIC goes by POL. POL was listed during September of 2024. For whatever reason it seems like Polygon (POL) has not seen as much attention as with when Polygon was (MATIC). Also, Solana (SOL) has been the main avenue of attention for the last couple of years outside of the mass appeal for NFTs on...
This chart looks like there is no real volume and only someone very rich controlling the price of XLM. If I missed the top to sell and the price of XLM never went higher than previous ATH the price of most cryptocurrency is what would otherwise be stuck in a loop with very little interest from real investors. How is it possible for the chart to be like this?
worst red candles on record in the past four years and various progresses of positive growth measured from lowest in between points.
price of Litecoin went down around -27% on one candle, crazy.
bitcoin compared to the 9 weeks down of jasmy. The last time Bitcoin went down for 9 weeks straight was during April-May 2022.
{9 weeks of down for Jasmy} that certainly was not expected based on the previous performance.


