Dow_Jones_Maestro
EssentialI am anticipating a Bullish close on Thursday to close above these highs for a 1% rally. Then Friday to wipe the board to start the move back down to the other side of the range for the true support Long. I will continue to look for Sells until support. This is a Bearish range at the top.
I want to scratch my prior idea as the market is showing me it is in a distribution phase in this range. I am confident that the all time high will hold until price pulls back down to the prior low of 43,400 and then take out the all time high. Does this look familiar? The exhaustion bar with ZERO follow through is what is telling me this range will break...
Using the Daily timeframe signals, price is in a range. Nothing is setup yet. I will wait for Monday to close down. I want to see a bearish closing day down near the lows for the Low of Week reversal. This is what I am waiting for and will have to see IF price will setup this way. 1. Creeping trend into the low 2. Daily closing bar into the low If...
To me, this week is looking like a weekly candle that is going to be a bearish trending cycle. Sunday, Monday formed the high of the week and immediately sold off. Tuesday and Wednesday was mean reverting around 250 forming a falling wedge consolidation for Thursday/Friday to continue the bearish trend. I am currently short inside the consolidation. To me,...
September I am going to look for bearish trades in line with these three peak wedge formations. I am looking for 46,000 to possibly be the high of month What I am seeing is a build up before the break out of all time highs. I believe the market will make one more dip down to the 43,000 area before the breakout. The biggest clue was August 22nd's...
Price is mean reverting around 500, this much is plain obvious. I will look for a support entry near 250 area. 125 tick stop 500 tick target 4 to 1 Risk Reward The orange box is the middle of the range. I.E. the slaughterhouse. Swing highs and lows formed near the middle get taken I am expecting the break of the highs and for price to hit 46,000
I am looking for a pullback into the 75% retracement area that also coincides with 45,000. Round numbers being double zeros. I am expecting Wednesday to also be a down day. The trade Long, I am expecting it to be on Thursday with Friday being another Long continuation day to finish the month out strong. These are my two trade Ideas for both 4 to 1...
After reviewing my past 500 trades, the absolute most profitable trade management is to hold until market close. If you study the daily chart, most days will close near the highs/lows of the bar. By only using just a stop loss and no profit target, one can capture monster moves. One trade per day, win or loss. Wins will be small 1-2R wins or giant 3-8R...
My gameplan Thursday is to see how this creeping trend plays out. I am looking for the creeping trend to layer down into 750 near the lows of these 8 Hour candles. Price is mean reverting around the 1000 level Creeping trends resolve themselves in one of two ways. They capitulate and blow off in the direction of the trend or they reverse Below I have outlined...
I am short at 45,042 after the close of a fat green bar. My bias is down and so I sell into bull bars. Price is currently mean reverting around 45,000 with the peak formation high above 250. I am looking for price to go down to the next level at 750. I am using a 100 tick stop and a 265 tick target
Today I will be going over a setup that I am finding and am liking. It is a mean reversion; Low of the Day Buy Setup to take out the High of Day. I want to trade like Mcdonald's with each setup being a cookie cutter formula. It is either there, or it isn't. I don't want to guess direction or trade movement. I want a simple setup that repeats itself regularly....
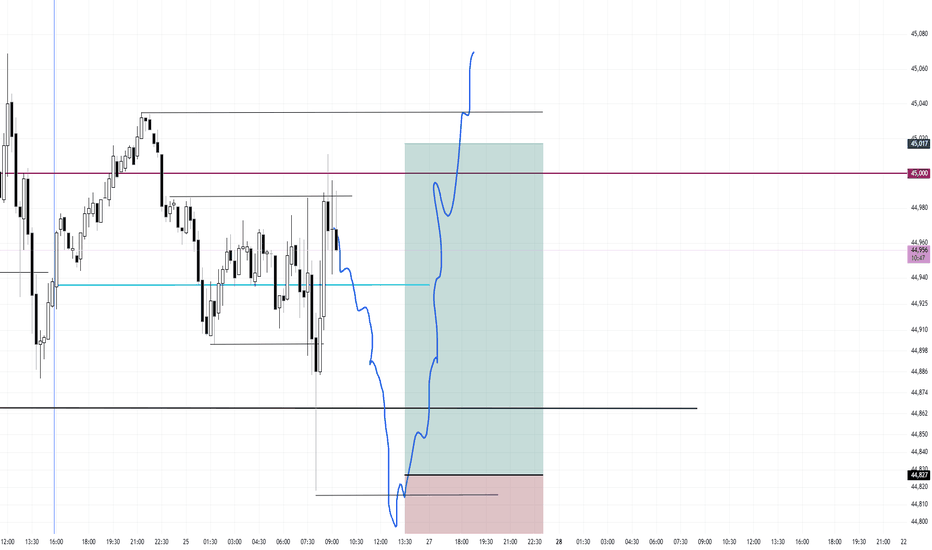
I am waiting for the smallest doji candle I can find pulling back into 750 for the Long trade back up to 45k. I am not chasing this current candle because it is suspended above the numbers out in no mans land
I can see price mean reversion around 250. Therefore, buy the lows and sell the highs. 500 as resistance and 00's as support. So far, the peak formation is at the low of August, therefore, the trend is bullish. I am expecting a run of the high then a dump to 44,000 before the continuation of the bull trend
I will be waiting for around an hour or so after NY opens to pump up into the monthly open and 250 level for the dump back down to the daily open My bias for the next two weeks are bearish.
Now that the first trading day of August has printed, can one reliably forecast the possible month based on just the first day? I am inclined to believe that one can with a small amount of accuracy. Not perfect. There are two types of monthly cycles when the first traded day is a bearish candle right from the open of the month. Type 1 is a bearish...
Looking for a peak formation high to form under the double zeros. The market is most likely targeting the liquidity sitting around the monthly open. I don't see any support until the market takes out some of these lows. Maybe at 44,250. Highlighted in red brush is every peak formation high formed this month.
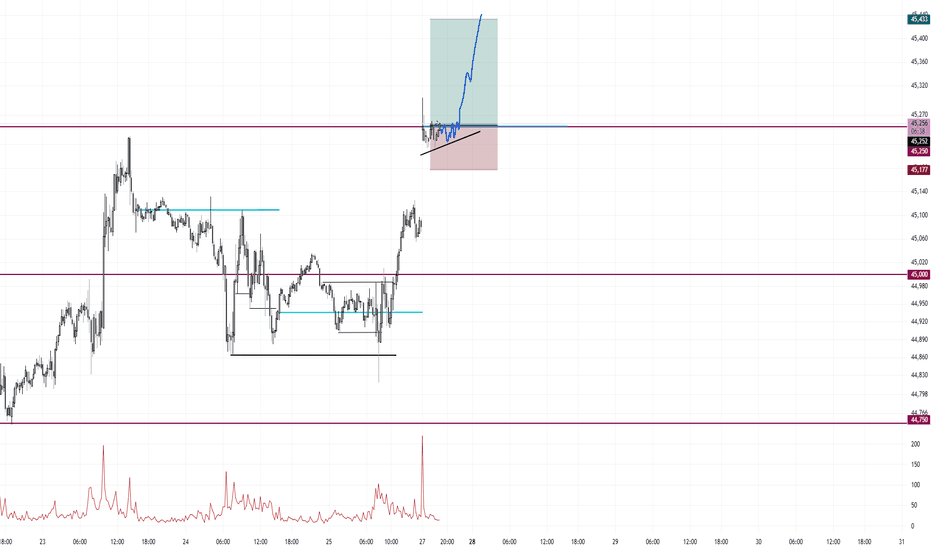
I am going for a gap up and rally idea. Extremely bullish bias. I am already triggered in Long at 45,252 stop is 75 ticks target is 180 ticks This is my one trade for the day. Same idea as Sunday May 11th where it too gapped up at the open over 1% and right into 250 for the rally all day Today's action
Price is mean reverting around 45,000 and also mean reverting around today's open. I will be waiting for a mean reversion play under the low of day targeting the high of day. I will be waiting for a small entry candle, a small doji. I did not take this first run up because the entry vs stop would have been too large. I believe the first mouse in will get dunked...


