F0rexBorex
Premium1. Overall Chart Analysis Timeframe and Trend: This 4-hour chart highlights a short-term downtrend with signs of exhaustion and consolidation. Gold peaked sharply on the left (possibly a local high around 2,400+), followed by a steep decline with lower highs and lower lows, forming what looks like a descending channel (diagonal trendlines connecting peaks and...
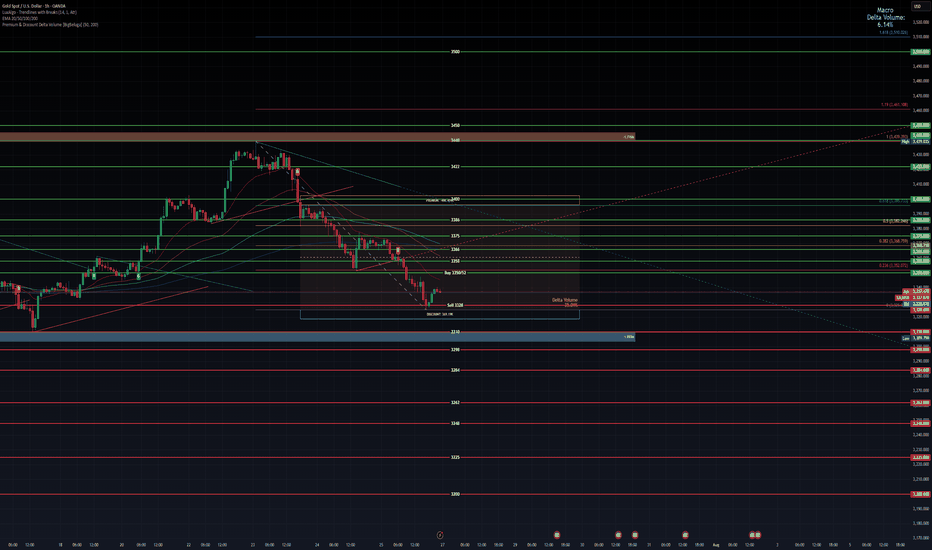
Analysis of the Buy Entry: 2350/52 This level has been chosen as a potential long entry point due to a confluence of several technical factors. Smart Money Concepts (SMC) - Discount Zone: The chart has a "Premium - Discount" range drawn over the recent downward price leg. The equilibrium (EQ) level is marked in the middle. According to SMC principles, traders...
No big write up am travelling but bias would be bullish for the week
No big write up on this one am travelling at the moment , if you put a gun to my head i would say we are in for a bullish week coming
* **Pair**: XAUUSD * **Timeframe**: 1H (1 Hour) * **Platform**: TradingView (OANDA feed) * **Trade Type**: Long (Buy) * **Entry**: 3,318.36 * **TP (Take Profit)**: \~3,419.30 * **SL (Stop Loss)**: Likely in the 3,290–3,295 range (based on visual zone) --- ## 🔍 Trade Breakdown ### ✅ **1. Pattern Recognition: Symmetrical Triangle Breakout** * The white...
### 🧭 **Chart Overview** * **Timeframe**: 1H (1 Hour) * **Platform**: TradingView (OANDA feed) * **Indicators**: * **Moving Averages** (likely EMA or SMA, 5/10/20/50/100/200) * **MACD** * **RSI** * **Buy Zones (Green Lines)**: Upper areas * **Sell Zones (Red Lines)**: Lower areas * **Price at time of analysis**: \~\$3,364 --- ### 🔍 **Technical Indicator...
Gold key levels with buy and sell entries , travelling at the moment will update with full breakdown tomorrow
* **Timeframe:** 1-Hour (H1) * **Instrument:** XAU/USD * **Indicators & Levels Used:** * EMAs 9 & 21 period * Key horizontal support/resistance levels * Pivot levels (weekly, daily, monthly) * Marked **Buy** at 3322.365 and **Sell** at 3318 * Daily Open: 3372.775 * Daily High: 3414.790 * Daily Close: 3305.980 * Daily Low: 3286.805 --- ### 🔍...
From the 4H chart you posted, here's a quick breakdown first: Trend: We're seeing bearish pressure overall after a strong bullish leg. The price is under important retracement levels (0.382, 0.5, 0.618 Fib retracements). Key Levels: Strong resistance zone at 3340-3352 (aligned with Weekly Highs, Daily Highs, and a Supply Zone). Immediate support around 3290...
🔍 Short-Term Forecast for XAU/USD Current Market Context: Price: $3,227.375 (currently) Recent High: Around $3,328 Structure: Strong bullish rally with minor retracement. Currently consolidating under a key resistance zone. Fib Levels: Price has respected Fibonacci retracement and extension levels, particularly 0.618 and 0.786. Volume Delta: High macro delta...
Okay, let's break down this XAU/USD 1-hour chart and factor in the potential impact of US-China tariff news. Chart Analysis (1-Hour Timeframe): * Trend: The chart displays a clear short-term uptrend starting around April 10th. The price has made higher highs and higher lows. It's currently trading above both the white (likely shorter-term) and green (likely...
Recommende buy level 3046 Recommended sell level 3030 Bullish Momentum Early Week: The pair started the week with strong bullish momentum, continuing the trend from the previous week. Concerns about the global economy and geopolitical factors fueled this upward movement, with XAUUSD testing and breaking above the $3110 level, reaching new record...
Entry 2990 Last week's price action in XAUUSD was dramatic. Initial surges, driven by tariff announcements, propelled the pair to record highs. However, this was followed by a significant correction, leaving the market in a state of uncertainty as we enter the new week. Considering the current market context (tariff implications, upcoming US economic data,...
Gold weekly forcast with both Buy and sell levels gold in an uptrend all week from last weeks buy level it ran 553 pips wit little to no drawdown. For this week we are looking at 2 levels for both buy and sell entries . For a buy ill look at entering at 3091 expecting 3098 to 3100 as first resistance , if we brreak we can expect 3112 as next resistance on the...
Gold weekly forcast with both Buy and sell levels gold in an uptrend all week from last weeks buy level it ran 553 pips wit little to no drawdown. For this week we are looking at 2 levels for both buy and sell entries . For a buy ill look at entering at 3091 expecting 3098 to 3100 as first resistance , if we brreak we can expect 3112 as next resistance on the...
This week we are looking to sell Gold down to previous resistance which aligns with Fibonacci 0.382 level for a sell total pips of 309. When we reach our take profit we will go back into a buy at 2994 and a take profit target of 3053 for an additional pip count of 588 pips. Trade idea is based on higher time frame and uses trend lines as well as support and...
Gold weekly forecast with both buy and sell entries. Friday Gold sold off from 2334 all the way to 2300 for a drop of 334 pips before retracing up to where we are now at 3024. What can we expect for the coming week ?. My plan is as follows. For a buy I would look at entering at 3032 expecting first resistance (marked in red on chart ) to be 3038 to 3040...
Last week he had a trade from 2880 that ran for 1244 pips congragulations if you took it. This week we are looking for a sell then leading into a buy at previous resistance. Current Price Action: Gold is trading near $2,984, slightly rejecting resistance. The price is respecting the ascending channel with higher highs and higher lows. Support & Resistance...


